Preliminary Environmental Information Report Appendix 4.3.1: Forecast Data Book - Our northern runway: making best use of Gatwick
←
→
Page content transcription
If your browser does not render page correctly, please read the page content below
Our northern runway: making best use of Gatwick

Preliminary Environmental Information Report
Appendix 4.3.1: Forecast Data Book
September 2021
Our northern runway: making best use of Gatwick

Table of Contents
1    Introduction                                              1

2    Implications of COVID-19 Pandemic                         1

3    Implications of Heathrow’s Third Runway                   1

4 The Basis of the Updated Forecasts, Assessment Cases
and Assessment Years                                   2

5    Recent Growth of Gatwick Airport Ltd                      3

6    UK Aviation Demand and Key Assumptions                    5

7 Gatwick’s Growth With and Without the Northern Runway
Project                                                 7

8    Annual Passengers                                         9

9    Annual Aircraft Movements                                 12

10 Air Cargo                                                   14

11 On Airport Employment                                       15

12 References                                                  16

Preliminary Environmental Information Report: September 2021
Appendix 4.3.1: Forecast Data Book                                                                         Page i
passenger demand and traffic levels throughout 2021, but that by the end of 2021 traffic levels will be
1              Introduction                                                                                                            starting to recover.

                                                                                                                               2.1.2   Beyond this, whilst recognising the current market uncertainty and potential structural impacts around
1.1.           Introduction
                                                                                                                                       business travel, the pandemic is not expected to alter consumer behaviours in a way that will have a
1.1.1          This document forms Appendix 4.3.1 of the Preliminary Environmental Information Report (PEIR)                           significant permanent impact on the long-term demand for air travel. Therefore, it is expected that overall
               prepared on behalf of Gatwick Airport Limited (GAL). The PEIR presents the preliminary findings of the                  demand for air travel will recover to previous levels as consumer behaviours return and are driven by
               Environmental Impact Assessment (EIA) process for the proposal to make best use of Gatwick Airport’s                    factors such as global and UK economic growth, disposable income, consumer confidence and the
               existing runways (referred to within this report as the Northern Runway Project (or ‘the Project’). The                 relative cost of air travel.
               Project proposes alterations to the existing northern runway which, together with the lifting of the current
                                                                                                                               2.1.3   While the immediate outlook therefore remains challenging, there is confidence that passenger and airline
               restrictions on its use, would enable dual runway operations. The Project includes the development of a
                                                                                                                                       demand at Gatwick will return to previous levels over the course of the next few years and then continue
               range of infrastructure and facilities which, with the alterations to the northern runway, would enable the
                                                                                                                                       to grow thereafter.
               airport passenger and aircraft operations to increase. Further details regarding the components of the
               Project can be found in the Chapter 5: Project Description.                                                     2.1.4   Overall, the updated forecasts presented in this data book predict that it will take approximately five years
                                                                                                                                       for passenger traffic at Gatwick to return to levels seen in 2019 and that by the end of the 2020s,
1.1.2          This data book presents air traffic and other forecasts that have been prepared for the purpose of
                                                                                                                                       passenger levels at Gatwick will have returned broadly to where they would have been had the pandemic
               assessing the economic, environmental and social impacts of the Project.
                                                                                                                                       not occurred. This reflects the combination of ongoing capacity constraints already experienced before
1.1.3          For the purposes of the assessment, two scenarios (or cases) have been formulated.                                      and during 2019 and underlying market growth across the London system. For example, Gatwick has
                                                                                                                                       been operating very close to its full potential in the peak summer months for several years. Gatwick’s slot
               1)    Existing Runway Case – assumes continued growth of Gatwick Airport based on continued use of                      capacity has been oversubscribed for many years with significant levels of unmet demand from a range of
                     Gatwick’s existing main runway (referred to as the ‘Baseline’ or ‘Base’ Case)                                     airlines and business models.

               2)    Northern Runway Project Case - making best use of Gatwick’s two existing runways - by bringing
                     Gatwick’s existing northern (standby) runway into operation alongside the existing main runway and        3       Implications of Heathrow’s Third Runway
                     operating the two runways simultaneously (referred to as the ‘Northern Runway Case’)
                                                                                                                               3.1.1   An important factor that will affect the level of air traffic at Gatwick in the future is whether a third runway
1.1.4          The Northern Runway Case represents the airport as it is expected to develop if development consent is                  is brought forward at Heathrow (Heathrow R3).
               granted for the Project.
                                                                                                                               3.1.2   National policy, as set out in the Airports National Policy Statement (NPS) (Department for Transport,
1.1.5          The Baseline Case represents the airport as it is expected to develop if development consent is not                     2018), supports the construction of Heathrow R3, and when it was published expected the new runway to
               granted for the Project. In this case, some further growth in airport passengers and air traffic movements              be provided by 2030.
               would still occur on the existing runway in the years ahead, but not as much growth as would occur under
               the Northern Runway Case.                                                                                       3.1.3   Since its designation, the Airports NPS has been subject to numerous legal challenges. In February 2020,
                                                                                                                                       the Court of Appeal ruled that the designation of the NPS was unlawful and its effect was suspended
1.1.6          The following sections provide an overview of Gatwick’s recent performance alongside wider market                       pending further Government action. In December 2020, however, the Supreme Court overturned the
               conditions, as well as providing insight on the future drivers and assumptions that relate to these                     Court of Appeal’s earlier judgement, ruling that the designation of the NPS was lawful, so reinstating its
               forecasts.                                                                                                              effect as Government policy.

                                                                                                                               3.1.4   During 2020, as a result of the COVID-19 pandemic, Heathrow Airport Holdings Ltd (HAHL) – the owner
2              Implications of COVID-19 Pandemic                                                                                       and operator of Heathrow and the promotors of R3 - suspended the work it had been doing to seek
                                                                                                                                       development consent for R3.
2.1.1          The COVID-19 pandemic had a very severe impact on the global aviation industry in 2020. Gatwick,
               along with all other UK airports, experienced a significant reduction in passenger traffic levels as a result   3.1.5   Following the Supreme Court ruling, HAHL has indicated that it will now be consulting with investors,
               of both Government-imposed restrictions on air travel and reduced passenger demand driven by low                        government, airline customers and regulators on its next steps. HAHL has not provided any timeframe for
               consumer confidence. UK passenger volumes for the calendar year 2020 were 75% down on volumes for                       recommencing its process for seeking development consent. Even if HAHL does restart the consenting
               2019 (75 mppa1 v 300 mppa), with passenger numbers at Gatwick falling from 46.6 mppa in 2019 to                         process, it is considered unlikely that R3 could be operational much before the early / mid-2030s.
               10.2 mppa in 2020. It is expected that Government travel restrictions will continue to have an impact on

1
    mppa, million passengers per annum

Preliminary Environmental Information Report: September 2021
Appendix 4.3.1: Forecast Data Book                                                                                                                                                                                                               Page 1
Our northern runway: making best use of Gatwick
3.1.6 Notwithstanding the Supreme Court judgement there is, therefore, still very significant uncertainty 4.3. Heathrow R3 Assumption for Northern Runway Project
surrounding when, or indeed if, a third runway will now be developed at Heathrow.
4.3.1 As set out in Section 3, given the continuing uncertainty surrounding Heathrow R3, careful consideration
3.1.7 The environmental studies undertaken by Gatwick in 2019 in support of the Project, prior to the pandemic, has been given to the most robust assumption to be made in the traffic forecasts and environmental
had assumed that the Gatwick northern runway would open in 2026, and that Heathrow R3 would open in studies for Gatwick about Heathrow R3. It has been decided that the most robust assumption to adopt, at
2030. Circumstances have now changed and revised forecasts have accordingly now been prepared. least for the purpose of preparing the PEIR, is to assume that a third runway does not come forward at
Heathrow.
3.1.8 Due to delays arising as a result of the COVID pandemic, Gatwick’s northern runway is now assumed to
open in 2029, three years later than originally presented. Due to uncertainty regarding when, or if, 4.3.2 This approach is considered robust as it provides a realistic worst case assessment of the environmental
Heathrow R3 will come forward, the forecasts are now based on a ‘no Heathrow R3’ scenario. This impacts of the Project. This is because if Heathrow R3 was to come forward, traffic levels at Gatwick
approach is considered robust as it provides a realistic worst case assessment of the environmental would be likely to decline in the period immediately following the opening of R3 and this would mean that
impacts of the Project. This is because if Heathrow R3 was to come forward, traffic levels at Gatwick the environmental impacts of the Project, including in relation to noise, traffic and emissions, may have
would be likely to decline in the period immediately following the opening of R3 and this would mean that been understated were Heathrow R3 to have been included in the future baseline.
the environmental impacts of the Project, including in relation to noise, traffic and emissions, may have
been understated were Heathrow R3 to have been included in the future baseline. 4.3.3 The forecasts prepared by GAL for the Northern Runway and Baseline cases therefore adopt a ’No
Heathrow R3’ assumption.
3.1.9 However, as Heathrow R3 remains Government policy, it is considered within the PEIR as a cumulative
development (where appropriate), in line with other proposed developments, based on the information 4.3.4 As GAL progresses its work and prepares its final documents, including the formal Environmental
available at this time. As GAL progresses its work and prepares its final documents, including the formal Statement in support of development consent, the status and information available regarding Heathrow
Environmental Statement in support of development consent, the status and information available R3 will be considered and taking this into account, the approach to forecasting scenarios will be kept
regarding Heathrow R3 will be considered and taking this into account, the approach to forecasting under review.
scenarios will be kept under review.
4.4. Northern Runway Project Assessment Cases
3.1.10 Section 4 explains the basis for the updated forecasts.
4.4.1 The assessment cases for the Project are therefore as follows:
4 The Basis of the Updated Forecasts, Assessment Cases and ▪ Existing Runway Case – assumes continued growth of Gatwick Airport based on continued use of
Gatwick’s existing main runway (referred to as the ‘Baseline’ or ‘Base’ Case)
Assessment Years ▪ Northern Runway Project Case - making best use of Gatwick’s two existing runways - by bringing
Gatwick’s existing northern (standby) runway into operation alongside the existing main runway and
4.1. Realistic Forecasts operating the two runways simultaneously (referred to as the ‘Northern Runway Case’)
4.1.1 Whilst there is inherent uncertainty in predicting long term aviation growth, the forecasts presented have 4.5. Assessment Years
been prepared jointly by GAL’s in-house airline relations and marketing and research teams and ICF, one
of the UK’s foremost experts in air traffic forecasting. 4.5.1 In respect of each of these two cases, forecasts have been prepared for four primary assessment years –
2029, 2032, 2038 and 2047:
4.1.2 In preparing the forecasts, regard has been had to the importance of having a realistic view of the level
and characteristics of air traffic growth that would occur at Gatwick, whilst also ensuring that the ▪ 2029: represents the opening year of the Project (and therefore the first point at which effects arising
environmental impacts of Gatwick’s growth, some of which, such as noise, traffic and carbon, rely heavily from its operation would occur).
on the forecasts, are not understated. This also accords with advice from the Planning Inspectorate to ▪ 2032: an interim assessment year.
ensure that realistic ‘worst case’ environmental impacts are understood. For this reason, the forecasts ▪ 2038: representing the year in which the development works as part of the Project would be
presented are considered to represent a robust and realistic view of the level of traffic growth but are completed.
likely to be towards the upper end of the levels of growth that could occur at Gatwick in the Baseline and ▪ 2047: to meet a specific requirement of guidance in the Design Manual for Roads and Bridges to
Northern Runway cases. assess impacts 15 years after the last of the key highways works associated with the Project are due
to be completed.
4.2. Opening Date of Northern Runway Project
4.5.2 For operational effects, the PEIR assessment concentrates on the period 2029 to 2038, with modelling
4.2.1 Gatwick’s Northern Runway Project is now being planned to be open in 2029. topics focussing on 2029, 2032 and 2038 as the primary assessment years. In addition, for some topics it
is a requirement to assess the effects of the highways improvements 15 years after completion.
Preliminary Environmental Information Report: September 2021
Appendix 4.3.1: Forecast Data Book Page 2Our northern runway: making best use of Gatwick
Therefore, for these topics, an assessment is provided for 2047, where appropriate. Therefore, forecasts Figure 5.1.1: Gatwick Airport Passengers (m)
for 2047 are included in this data book.
50
45.5 46.0 46.6
4.5.3 Forecasts are therefore set out in this data book for the following four ‘design’ years:
43.1
39.9
Cases Design Years 40 38.1
35.3 35.4
34.2 33.6 34.1
32.4 31.4
Year 2029 Year 2032 Year 2038 Year 2047
30
Base Case ✓ ✓ ✓ ✓
Northern Runway 20
✓ ✓ ✓ ✓
Case
4.5.4 Data are also presented for the year 2019 – the most recent full year of operations pre-COVID. 10
Subsequent outputs are typically presented as annual numbers but represent financial years (eg where
this data book quotes Year 2029, this represents forecasts for the financial year 2029/30).
0
2007 2008 2009 2010 2011 2012 2013 2014 2015 2016 2017 2018 2019
5 Recent Growth of Gatwick Airport Ltd
Source: CAA Statistics
5.1. Introduction
Figure 5.1.2: Gatwick Airport Commercial ATMs (000s)
5.1.1 Despite operating with a high degree of slot constraint, Gatwick has still been able to provide significant
levels of growth in the years before the COVID-19 pandemic and, as explained above, GAL expects traffic 300 283 283 283
277
to recover as the effects of the pandemic decline. 259 256 255 260
245 243 239 244
250 234
5.1.2 Over the last decade Gatwick has grown by over 14 million passengers, reaching 46.6 million in the most
recent full year of operations (2019). This 44% growth in passengers resulted in a 15% growth in
commercial air traffic movements (ATMs)2 reflecting the larger and fuller aircraft now in operation. 200
150
100
50
0
2007 2008 2009 2010 2011 2012 2013 2014 2015 2016 2017 2018 2019
Source: CAA Statistics, Commercial (Passenger) ATMs
2
Commercial air traffic movements (ATMs), or passenger ATMs, exclude non-commercial flights such as positioning flights and business aviation.
In 2019, non-commercial flights accounted for approximately 1% of Gatwick’s movements and are forecast to remain at about this level.
Preliminary Environmental Information Report: September 2021
Appendix 4.3.1: Forecast Data Book Page 3Our northern runway: making best use of Gatwick
5.1.3 During this period, domestic volumes have remained relatively flat whilst over 10 million and 4 million Figure 5.1.4: Gatwick Growth in Average Aircraft Size & Load Factor
passengers have been added in the short haul and long haul market categories respectively. The growth
in short haul markets has been driven by ongoing growth from low cost carriers (LCCs)3, which continue 250 90%
to account for a significant share of growth in the European aviation market. The long haul growth has 86%
been driven by many new intercontinental markets being added by a range of carriers (full service and 79% Load Factor 80%
LCCs) as Gatwick continues to expand its long haul connectivity.
200
70%
Figure 5.1.3: Gatwick Routes (outside Europe) 28
60%
150 36
50%
40%
100 Seats/flight
Seats/flight 192 30%
165
168
132
20%
50
10%
0 0%
2009 2019
Passengers/flight Empty Seats Load Factor
Source: CAA/GAL Statistics
Source: IATA Schedules, March 2020 5.1.7 Traffic growth has been supported by the continuing growth and diversification of airlines, including low
cost carriers. Growth over the last five years (2014-2019) has averaged 4.1% per annum compared to the
5.1.4 Gatwick has also experienced several recent shocks, notably the relatively recent collapses of Monarch
UK average of 4.5% over the same period. In 2019 Gatwick reached 46.6 million passengers and
and Thomas Cook which have had short term impacts on Gatwick’s traffic growth.
remained the second largest airport in the UK by passenger volume.
5.1.5 There have been three main drivers of growth over the past decade.
i) More passengers per flight: Average passengers per aircraft movement have grown from 132 in
2009 to 165 in 2019. This has been driven by higher load factors (the percentage of seats filled), and
an increase in the average size (and therefore number of seats) of aircraft used.
ii) Peak spreading: There has been a change in the profile of flights over the year, with a higher level of
growth in the traditionally quieter periods of the year. This ‘peak spreading’ makes use of spare
capacity on the runway outside of peak months and leads to a higher level of annual utilisation of the
existing assets on the airport. Gatwick is still busier in the summer months than the winter months
and so there is further potential for this peak spreading to continue.
iii) Growth in peak runway capacity: The maximum number of scheduled aircraft movements that can
be accommodated on the runway has grown from 53 an hour in 2012 to 55 an hour in 2019. This
increase has allowed more flights, even during the busy summer period.
5.1.6 Growth in average loading and aircraft size is summarised in the following chart.
3
LCCs = Low Cost Carriers (eg easyJet, Ryanair etc.)
Preliminary Environmental Information Report: September 2021
Appendix 4.3.1: Forecast Data Book Page 4Our northern runway: making best use of Gatwick
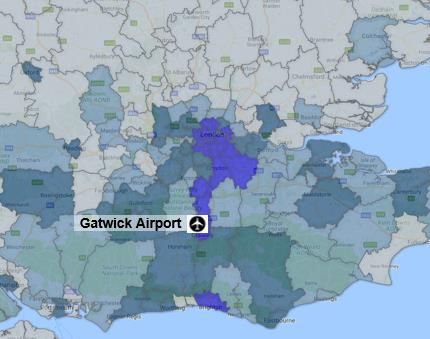
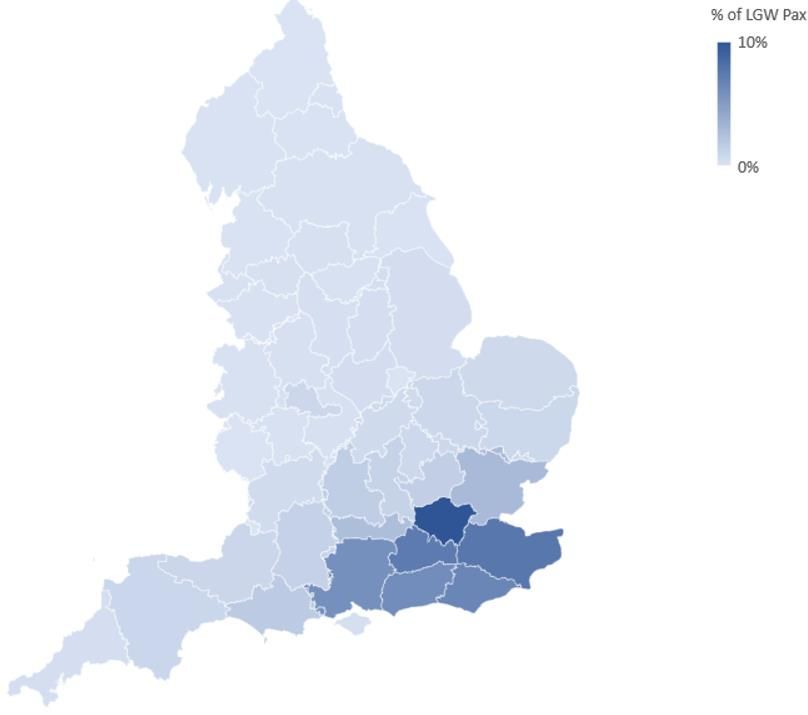
Figure 5.1.5: Passenger Growth Comparisons, UK Market (Last 5 years: 2014 – 2019) Figure 5.2.1: Gatwick Catchment
2014- 2019
15m 2.0% 4.1% 6.0% 7.1% 11.7% 7.7% 5.4% 7.2% 2.8% 9.3% 10.0%
CAGR
9.0%
8.0%
7.0%
10m
+8.5m +8.2m 6.0%
+7.5m +7.4m +7.7m
5.0%
4.0%
+4.6m
5m
3.0%
+2.9m +2.6m
+2.2m 2.0%
+1.1m
1.0%
0m 0.0%
Source: CAA Survey
Source: CAA Statistics (Top 10 UK airports chosen based on passenger ranking in 2019) 6 UK Aviation Demand and Key Assumptions
5.2. Catchment Area 6.1. Introduction
5.2.1 Gatwick’s proximity to London and surface access links to the wider South East (and beyond) provide a 6.1.1 The UK airports handled a record 300 million passengers in 20194, of which the London airports5
wide catchment area. According to CAA Survey data, 81% of Gatwick’s terminating passengers (ie accounted for 181 million or 60% of total activity. Demand in the London system continues to post strong
excluding transfer passengers) were travelling to/from destinations in London or the South East. Greater growth as over 34 million passengers have been added in just the last 5 years, representing a compound
London is the largest source market (42%), but the nearby counties Kent, Surrey and Sussex account for annual growth rate (CAGR) of 4.3%.
a further 27%. Of the 19% of passengers travelling to/from destinations outside of the South East, the
majority were travelling to the East or South West of England. 6.1.2 Some of this growth has come through up-gauging (larger) aircraft and higher load factors (seat
occupancy rates), as during the same period aircraft movements grew at a rate of 2.5%.
6.1.3 The latest demand forecasts from the UK DfT6 indicate that demand will continue to grow at around 1.7%
in the long term (2016-2050). This period will therefore see demand increase by an additional 230 million
passengers across the UK’s airports.
4 6
UK CAA Statistics for aviation activity UK DfT Forecasts October 2017
5
London Airports (LHR, LGW, STN, LTN, LCY, SEN)
Preliminary Environmental Information Report: September 2021
Appendix 4.3.1: Forecast Data Book Page 5Our northern runway: making best use of Gatwick
Figure 6.1.1: UK Aviation Passenger Demand Forecast (million) 6.2.4 As set out above, the forecasts assume a third runway is not brought forward. The reasons why this
approach has been adopted is described in Section 4.3 above.
600
6.2.5 During the next stage of its work, GAL will consider the information available and status of the potential
3rd runway at Heathrow. As GAL progresses its work and prepares its final documents, including the
500 formal Environmental Statement in support of development consent, the status and information available
regarding Heathrow R3 will be considered and taking this into account, the approach to forecasting
Low
scenarios will be kept under review.
400
Other Airports
300
6.2.6 Aside from Heathrow, other London airports have also revealed growth plans to develop beyond today’s
UK Demand
current capacity and planning limits.
200
▪ Stansted has been granted planning permission to increase its planning cap to allow growth to
43 mppa.
100 High ▪ An application for development consent is being progressed for growth at Luton. Its forecasts predict
that it could handle 32 million passengers per year by 2038 should its current planning cap of
0 18 million passengers be lifted and development consent granted to support this growth.
2000 2005 2010 2016 2020 2025 2030 2035 2040 2045 2050 ▪ London City Airport as part of their development programme is seeking to increase their current
planning cap of 6.5 million passengers or 111 k flights.
Source: CAA, DfT UK Aviation Forecasts, 2017 (Note: re-based to include all UK airports) ▪ Southend is also pursuing expansion plans. Whilst accounting for around 2.0 mppa in the London
market (in 2019), they have plans to grow this over the next five years.
6.1.4 Recent short-term performance prior to COVID-19 has already outperformed the DfT’s projection. Annual
growth rates since 2016 have been stronger than forecast (3.4% vs 2.8%7) resulting in demand already 6.2.7 With the exception of Stansted, these plans do not currently have approval, whilst the planning
being at least one year ahead of the DfT’s central case forecast. permission granted for passenger growth at Stansted is currently the subject of a legal challenge. There is
therefore little that can be concluded about these plans with any degree of certainty. Further, Gatwick
6.1.5 The DfT assumes an annual capacity limit of 200 million8 passengers for the London airports which is just
Airport is, to a large extent, isolated from the impact of these plans. This is because growth at these other
19 million above the annual throughput in 2019. Heathrow and Gatwick are already assumed ‘full’, whilst
airports would not have any material effect on forecasts at Gatwick due to their much smaller share of
Luton is now operating at its planning limit. By 2030 an additional 50 million+ passengers are forecast in
London market. In contrast, Gatwick is firmly established as one of the top two airports for serving the
the London market which will be far in excess of the current available capacity, indicating significant need
London system as demonstrated both by the over-subscription of its slot capacity and by the sizeable
for capacity development.
long haul component.
6.2. Capacity at Other London Airports
6.2.8 Geographically, Gatwick also serves a mostly distinct catchment area when compared to Stansted, Luton
6.2.1 In this section some of the other capacity developments within the London airport system are set out, that and Southend, resulting in a relatively small amount of overlap in outbound (ie UK originating) markets.
are assumed in the forecasts. Over the next 10 years a wide range of outcomes potentially exist, There is more overlap in inbound markets where a large proportion of passengers are travelling to central
reflecting the range of capacity developments being sought as well as the likelihood of their approvals. London destinations, but here Gatwick has the advantage of faster transport links to the centre than these
other airports.
Heathrow
Night Flight Regime
6.2.2 As has been noted in Sections 3 and 4 above, the effect of national policy support for the third runway at
Heathrow has recently been reinstated, but there remains significant uncertainty surrounding when, or 6.2.9 In preparing these forecasts, GAL has assumed that the existing controls on night flying, as set out in the
indeed if, a third runway will become operational. Government’s 2017 Night Flight Restrictions for Heathrow, Gatwick and Stansted, which cover the period
to 2022, will continue to be carried forward, with no changes to the current regime for Gatwick. This
6.2.3 In addition to these growth prospects, demand at Heathrow will continue to grow, reflecting larger and
fuller aircraft as demand was approaching 81 mppa in 2019, up from 73 mppa just 5 years ago9.
7 9
3.4% for period 2016-2019 HAL Statistics, 73.4m in 2014.
8
200m considered limit in 2030 (SEN added to DfT LON total)
Preliminary Environmental Information Report: September 2021
Appendix 4.3.1: Forecast Data Book Page 6Our northern runway: making best use of Gatwick
assumption aligns with proposals set out in the Government’s most recent consultation on night flying 1. Growth in Runway Utilisation in Off Peak Periods
restrictions, which will establish the controls and limits until 202410.
7.2.3 In the busy summer months (July, August and September), Gatwick is often already operating at, or close
6.3. Market Outlook to, its peak capacity. In the Baseline Case GAL is anticipating only modest growth during this period as
daily commercial ATMs are forecast to increase by 4% from an average of around 900 in 2019 to 939 in
6.3.1 Early in 2020, the COVID-19 pandemic spread worldwide. Like other industries, aviation has been 2038 and to 946 in 2047.
significantly impacted having experienced dramatic drops in traffic, activity and revenues threatening the
viability of many companies. 7.2.4 For the total summer season (Apr-Oct), daily commercial ATMs are forecast to increase 7% from an
average of 851 in 2019 to 915 in 2038 and to 927 in 2047. In contrast, the less utilised winter period is
6.3.2 Up until the impact of COVID-19 the UK had continued to witness strong growth across the aviation forecast to increase from an average of 666 in 2019 to 813 daily commercial ATMs in 2038 and to 842 by
market supported by ongoing macro-economic and supply/demand side factors. 2047. By 2038, this represents an increase of 22% versus 2019. By comparison, Gatwick’s winter
utilisation has increased by 15% in just the last 5 years as daily commercial ATMs have grown from 579
6.3.3 In the short-medium term there is expected to be significant uncertainty relating to market demand arising to 666.
through a combination of travel restrictions and the underlying market demand. In the longer term the
demand for aviation is expected to return to previous drivers of demand including a country’s economic Figure 7.2.1: Gatwick Daily Movement Growth – Base Case
performance (including gross domestic product (GDP) per capita, disposable incomes, etc.) and airline
strategy. 1,000 939 946
915 927
858
892
851 873 892
842
805 813
7 Gatwick’s Growth With and Without the Northern Runway Project 800 774
711
666
7.1. Introduction
579
600
7.1.1 Even without any further capacity developments, it is clear that Gatwick will continue to experience further
growth. Firstly, demand across Gatwick’s core and wider catchment is forecast to grow in line with wider
UK aviation projections of around 1.7% per annum in the long term. Secondly, the ongoing supply side 400
trends highlighted earlier, including larger and fuller aircraft whilst making better use of the runway, will
continue to deliver increased annual throughput.
200
7.2. Baseline Growth to 62 mppa in 2038 and 67 mppa in 2047
7.2.1 In the Baseline Case, (ie without the Northern Runway Project), it is estimated that Gatwick will be able to 0
handle approximately 318,000 commercial ATMs in 2038, reflecting an increase of around 10% compared Peak Months Summer Annual Winter
to the 2019 throughput. This increase in movements will be achieved through better year-round slot 2014 2019 2038 2047
utilisation and further capacity release, whilst up-gauging (the use of larger aircraft) and load factor growth
will also support higher passenger volumes. These trends include the impact of changes in the market Source: CAA Commercial/Passenger ATM Statistics
mix at Gatwick, for example growth in long haul markets (larger aircraft types and less seasonal 7.2.5 The increase in runway utilisation during off peak periods will result in annual traffic profiles flattening as
operations) and reductions in seasonal charter traffic. Beyond 2038 modest growth is assumed as demand spreads to the less utilised periods of the year, although some seasonality would remain. In
approximately 326,000 commercial annual ATMs are assumed in 2047, reflecting modest improvements 2038, busy month commercial ATMs are forecast to be 7% higher than the annual average compared to
in capacity utilisation. 17% in 2019 and 23% in 2014.
7.2.2 Growth in the Baseline Case from the current 46.6 mppa to the future forecast of 62.4 mppa in 2038 and
2. Up-gauging of Fleet over Time to Larger Aircraft
67.2 mppa in 2047 is anticipated to come from three main and well-established factors, set out below.
7.2.6 The second important and year-round factor that will drive passenger growth is the trend for airlines to up-
gauge their fleets with larger aircraft. Seats per ATM are expected to increase from an average of 192 in
2019 to 215 by 2038 and to 224 in 2047, as shown in the charts below.
10
https://www.gov.uk/government/consultations/night-flight-restrictions-at-heathrow-gatwick-and-stansted-airports-between-2022-and-2024-plus-
future-night-flight-policy/night-flight-restrictions
Preliminary Environmental Information Report: September 2021
Appendix 4.3.1: Forecast Data Book Page 7Our northern runway: making best use of Gatwick
Figure 7.2.2: Average Seats per ATM - Base Case 7.2.12 Over the next 20 years load factors are forecast to increase at a slower rate, with the gains seen in the
last 10 years not being repeated in the next 15-20 years. Factors such as seasonality, directional
250 imbalances and no shows would continue to present challenges for airlines to increase their seat
224 occupancy rates further. By 2038 and beyond, average load factors are forecast to increase to just over
215
203 90% which is comparable to Gatwick’s most efficient carriers operating today.
200 192
Figure 7.2.3: Average Load Factor - Base Case
168
100%
150 91% 92%
88%
90% 86%
79%
80%
100
70%
50 60%
50%
0 40%
2009 2019 2025 2038 2047
30%
Source: CAA/GAL Statistics
7.2.7 Two good examples of this can be seen in Gatwick’s two largest airlines easyJet and British Airways - 20%
which currently account for over 60% of Gatwick’s passengers.
10%
7.2.8 For example, easyJet is moving towards A320 and A321 aircraft (with 186 seats and 235 seats
0%
respectively) from current A319 (156 seats) and the A320 fleet (previously 180 seats). Similarly, British
2009 2019 2025 2038 2047
Airways is continuing to ‘densify’ its Boeing 777 fleet alongside longer term fleet replacement plans for
their short haul fleet (eg the B777 densification will result in seat configurations growing from 220/275 to Source: CAA/GAL Statistics
232/336) which will result in significant increases in average seats per aircraft11.
7.2.13 When combined, the aircraft size and load factor assumptions result in the average number of
7.2.9 New long haul markets and the usage of Boeing 787s (often replacing 757/767) and Airbus A350s passengers per flight increasing from the current 165 (in 2019) to 196 in 2038 and 206 in 2047.
entering airline fleets are other examples of airlines up-gauging.
7.3. Growth with the Northern Runway Project
7.2.10 The above changes are already underway for easyJet and British Airways and other large carriers such
as Tui and it is realistic to assume this would continue, especially as new slot capacity at UK airports 7.3.1 The introduction of the Project would allow both of Gatwick’s runways to be used concurrently. This
continues to become scarcer and the UK aviation market demand continues to grow. would release an existing capacity constraint on the airport, to allow it to receive additional aircraft
movements. The northern runway would be used for departing aircraft (mostly Code C or smaller) whilst
3. Higher Average Load Factors the main runway would be capable of handling all movements as it is today. This has the potential to add
significant levels of capacity and accommodate the ongoing growth in demand for aviation across the
7.2.11 Allied to the increase in average aircraft size is a predicted increase in average seat occupancy rates wider UK market.
across the year, also referred to as load factors. In 2019, average load factors ranged between of 78-
92% (averaging 86%) across the year and have increased from 79% to 86% over the previous 10 years. 7.3.2 With the Project, it is estimated that approximately 63,000 additional commercial ATMs will be possible in
This increase has been supported by the growth of LCCs who have been actively increasing load factors the Baseline Case in 2038, resulting in around 382,000 commercial ATMs, and that by the end of the
across their networks. forecast period in 2047 the number of commercial ATMs could increase to approximately 386,000.
11
BA’s 777 economy class seating being reconfigured from traditional 3-3-3 configuration to 3-4-3 - increasing seating from current 220/275 seats
per aircraft towards 232/336 seats. IAG announced plans to replace Gatwick fleet with larger sized short haul aircraft such as the 737Max from
the early/mid 2020s
Preliminary Environmental Information Report: September 2021
Appendix 4.3.1: Forecast Data Book Page 8Our northern runway: making best use of Gatwick
Figure 7.3.1: Gatwick Commercial Annual Air Traffic Movements ('000s)
8 Annual Passengers
450
8.1. Introduction
400
350 8.1.1 GAL has prepared detailed annual passenger and movement forecasts for the period 2019-2047. This
300 approach captures detailed market and airline assumptions reflecting Gatwick’s pipeline of demand under
various capacity scenarios. Gatwick’s assumed performance has also been validated against wider
250
London level passenger and ATM forecasts taking into account the dynamics of the wider London market
200
including airline and supply side assumptions at the other airports.
150
100 8.2. London Market
50 Base No R3 NRP No R3
8.2.1 As can be seen in the following table, Gatwick currently has a 26% share of the London aviation market
0 which is forecast to decline to under 25% in 2038 and 23% in 2047 under the Baseline Case (ie without
the Project).
Source: CAA/GAL Statistics (Total Commercial ATMs)
8.2.2 In the Northern Runway Case, Gatwick would increase its market share to nearly 30% by 2038 which is
equivalent to 75.6 million passengers. By 2038 with the Project, Gatwick is forecast to achieve an
incremental 13.2 million passengers compared to the Baseline Case. In the 2038-47 period, Gatwick’s
Figure 7.3.2: Gatwick Annual Passengers (million) market share is assumed to decline to 27%, which is comparable to 2019.
80 Table 8.2.1: Gatwick and London System Passengers 2019, 2029, 2032, 2038 and 2047 (passengers, millions)
70
60 Year / Case Gatwick London Total Gatwick as % of London Total
50
40 2019 Actual 46.6 181 26%
30 2029 (Base Case) 57.3 218 26%
20 2029 (Northern Runway Case) 61.3 218 28%
10 2032 (Base Case) 59.4 230 26%
Base No R3 NRP No R3
0
2032 (Northern Runway Case) 72.3 230 31%
2038 (Base Case) 62.4 255 25%
2038 (Northern Runway Case) 75.6 255 30%
2047 (Base Case) 67.2 294 23%
Source: CAA/GAL Statistics
2047 (Northern Runway Case) 80.2 294 27%
Note: London volumes taken by applying the DfT’s UK growth rate to a 2019 London baseline on an unconstrained basis
8.2.3 The following chart highlights the annual growth profile assumed at Gatwick for the Baseline and Northern
7.3.3 In addition to the increased commercial ATM throughput, larger and fuller aircraft will be operating from Runway cases. In both scenarios, passengers are assumed to return to 2019 levels around 2025 before
Gatwick providing a larger increment in passenger throughput. By 2038 a 20% uplift in average aircraft growing towards 57 million by 2028 making best use of the existing runway / infrastructure. Beyond 2028
loadings is forecast meaning that Gatwick will be able to achieve around 75.6 mppa with the Project. the growth path differs depending on whether additional capacity offered by the Project is released.
Further incremental growth will be possible as these trends continue resulting in the passenger forecast of
approximately 80.2 mppa by 2047. 8.2.4 Under the Northern Runway Case the northern runway offers significant additional capacity. Demand is
forecast to grow strongly when capacity is assumed to be released in 2029. Through the early 2030s
Gatwick is forecast to grow towards 70 million passengers capturing a greater share of London demand
as other airports will have relatively limited capacity to grow further. Once the majority of incremental
Preliminary Environmental Information Report: September 2021
Appendix 4.3.1: Forecast Data Book Page 9Our northern runway: making best use of Gatwick
runway slots are full, further growth is anticipated with passenger numbers predicted to grow to some Figure 8.3.1: Gatwick Annual Passengers, Base Case (million)
80 million by 2047.
80
Figure 8.2.1: Gatwick Annual Passengers by Scenario (million)
90 70
80
60
70
50
60
50 40
40
30
30
20
20
10 10
0
0
2012
2013
2014
2015
2016
2017
2018
2019
2020
2021
2022
2023
2024
2025
2026
2027
2028
2029
2030
2031
2032
2033
2034
2035
2036
2037
2038
2039
2040
2041
2042
2043
2044
2045
2046
2047
2012
2013
2014
2015
2016
2017
2018
2019
2020
2021
2022
2023
2024
2025
2026
2027
2028
2029
2030
2031
2032
2033
2034
2035
2036
2037
2038
2039
2040
2041
2042
2043
2044
2045
2046
2047
Base No R3 NRP No R3
Domestic Short Haul Long Haul
Source: CAA/GAL Statistics
8.3.2 Looking ahead, growth in long haul volume is forecast to continue taking share away from domestic and
short haul markets. Long haul demand is forecast to increase to a 23% share before the introduction of
any new capacity. In the Baseline Case, beyond 2029 the long haul share is assumed to remain
8.3. Market Mix – Haul relatively flat at around 23% as Gatwick continues to accommodate growth in this segment through
substitution. In the Northern Runway Case Gatwick’s share of the long haul market is forecast to grow to
8.3.1 In 2019, just under 20% of Gatwick’s passenger demand was long haul traffic which has grown from a
26% by 2038 and 27% by 2047.
share of 13% just 5 years before. This period has seen long haul passengers grow from under 5 m to
9 m reflecting a CAGR of 12% which is ahead of the wider London average.
Table 8.3.1: Gatwick Passengers, Market Mix (%)
2029 2032 2038 2047
2019
Northern Northern Northern Northern
Actual Base Base Base Base
Runway Runway Runway Runway
Case Case Case Case
Case Case Case Case
Domestic 7% 7% 6% 7% 5% 6% 5% 6% 5%
Short Haul 73% 70% 70% 70% 70% 69% 69% 67% 67%
Long Haul 19% 23% 23% 23% 25% 25% 26% 27% 27%
Total (m) 46.6 57.3 61.3 59.4 72.3 62.4 75.6 67.2 80.2
Preliminary Environmental Information Report: September 2021
Appendix 4.3.1: Forecast Data Book Page 10Our northern runway: making best use of Gatwick
8.4. Market Mix – Purpose/Residency 8.5. Market Mix – Transfers
8.4.1 Passenger type forecasts have been prepared for Gatwick’s local demand however the respective shares 8.5.1 In 2019, transfer passengers were estimated to account for approximately 4% of demand, equivalent to
are assumed to remain comparable to 2019. 1.8 million passengers. These volumes reflect flows via traditional connecting itineraries12.
▪ Business share: This is forecast to remain at around 15% through the forecast period reflecting a 8.5.2 No significant change is forecast in the future with Gatwick remaining predominantly a point-to-point
combination of new routes and growth on established markets. This remains the case in both airport. Therefore, the number of connecting passengers is forecast to grow in line with the total growth
scenarios. as they maintain a share of around 4% of total demand across all scenarios in future years.
▪ Foreign resident share: This share is also forecast to remain relatively static at around 25%
through the forecast period. Again, this holds for both scenarios. Table 8.5.1: Transfer Passengers (million and %)
Figure 8.4.1: Gatwick Purpose of Travel and Residency (2019) 2029 2032 2038 2047
Purpose of Travel Residency 2019
Northern Northern Northern Northern
Actual Base Base Base Base
Runway Runway Runway Runway
Case Case Case Case
14% Case Case Case Case
24%
Transfer
1.8 2.5 2.7 2.5 2.7 2.6 2.7 2.6 2.9
Passengers
% of total
3.9% 4.5% 4.7% 4.4% 3.8% 4.3% 3.7% 4.0% 3.8%
Passengers
76%
86% 8.6. Terminal Splits
8.6.1 Terminal splits have been considered reflecting airline allocation assumptions for each scenario and the
Business Leisure UK Foreign assumed growth by airline. In 2019, approximately 25 million passengers were handled in the North
Table 8.4.1: Passenger Type: UK / Foreign / Business / Leisure split (million) Terminal, with the remaining 21 million handled by the South Terminal.
8.6.2 Over the forecast horizon and respective scenarios, airlines are forecast to grow at different growth rates
2029 2032 2038 2047
and the resulting passenger volumes by terminal will change. With the Project, the North Terminal is
2019 Northern Northern Northern Northern forecast to serve some 37 million passengers in 2038 whilst the South Terminal would serve some
Base Base Base Base
Actual Runway Runway Runway Runway 38 million. By 2047 40 m passengers are assumed to be using each terminal.
Case Case Case Case
Case Case Case Case
Table 8.6.1: Passengers by Terminal (m)
UK Resident
2029 2032 2038 2047
Business 4.0 4.7 5.0 4.9 5.7 5.1 6.0 5.4 6.3
2019
Leisure 29.9 36.7 39.2 38.1 46.7 40.1 48.9 43.3 51.9 Northern Northern Northern Northern
Actual Base Base Base Base
Total 33.8 41.4 44.2 42.9 52.4 45.2 54.8 48.7 58.1 Runway Runway Runway Runway
Case Case Case Case
Case Case Case Case
Foreign Resident
North 25 31 32 32 36 33 37 36 40
Business 2.1 2.6 2.7 2.7 3.3 2.8 3.4 3.0 3.6
South 21 27 29 28 36 29 38 31 40
Leisure 8.8 10.9 11.7 11.3 14.0 11.9 14.7 12.9 15.6
Total 10.9 13.5 14.4 14.0 17.2 14.7 18.0 15.9 19.1
Note: Excludes Transfer Passengers
12
Whilst other passengers make their own connections, due to lack of available data these have not been included. This would only have a
relatively minor impact on the surface access assumptions, potentially over estimating access requirements.
Preliminary Environmental Information Report: September 2021
Appendix 4.3.1: Forecast Data Book Page 11Our northern runway: making best use of Gatwick
8.7. Surface Access Splits 9.1.4 The annual commercial ATM forecasts are compared in the following chart taking a comparable path to
that of passengers. In both cases commercial ATMs are forecast to pass 300,000 by the late 2020s and
8.7.1 Surface access estimates for local13 demand have been prepared reflecting Gatwick’s extensive by 2038 are able to grow towards 382,000 in the Northern Runway Case whilst reaching 318,000 in the
catchment which is forecast to continue drawing on demand from the surrounding area. Greater London Baseline Case. In the final period of the forecast only modest growth is assumed as by 2047 the Northern
contributes by far the largest share of demand reflecting inbound and outbound demand and accounts for Runway Case is forecast to provide 386,000 commercial ATMs compared to 326,000 in the baseline
19 million passengers, equivalent to a 42% share. Over the forecast, the splits are assumed to remain scenario.
relatively stable, reflecting similar catchment characteristics as 2019, and no major changes in surface
access to Gatwick. Figure 9.1.1: Gatwick Annual Commercial ATMs (000s)
Table 8.7.1: Passenger Surface Access Split (million, excludes transfers) 450
400
2029 2032 2038 2047 350
2019 300
Northern Northern Northern Northern
Actual Base Base Base Base 250
Runway Runway Runway Runway
Case Case Case Case
Case Case Case Case 200
150
Greater
19 23 28 24 30 25 31 27 33
London 100
South East 17 21 25 22 27 23 28 25 30 50 Base No R3 NRP No R3
East England 3 4 4 4 5 4 5 4 5 0
FY12
FY13
FY14
FY15
FY16
FY17
FY18
FY19
FY20
FY21
FY22
FY23
FY24
FY25
FY26
FY27
FY28
FY29
FY30
FY31
FY32
FY33
FY34
FY35
FY36
FY37
FY38
FY39
FY40
FY41
FY42
FY43
FY44
FY45
FY46
FY47
Other 6 7 8 7 9 7 9 8 9
Total 45 55 66 57 70 60 73 64 77
Source: CAA/GAL Statistics, excludes non-commercial ATMs
9 Annual Aircraft Movements
9.1. Introduction
9.1.1 In addition to passengers, aircraft movements have also been forecast capturing supply side trends within
the industry and of Gatwick’s major airlines. Over the last five years whilst Gatwick’s passengers have
grown over 22%, movements have grown by 11%, reflecting a trend towards larger and fuller aircraft. In
this period the average passenger loading has increased from 150 to 165, a 10% increase.
9.1.2 Looking ahead, growth in average aircraft sizes is forecast to continue recognising the aircraft order
books of some of Gatwick’s largest carriers. They are forecast to take delivery of aircraft with larger
capacities than those currently in operation, this combined with ongoing industry growth in load factors
and a growing LCC share will drive further improvement in average passenger throughput. In the next 10
years average passengers per ATM are forecast to increase by a further 12% to 184.
9.1.3 Consequently, Gatwick’s annual growth in air traffic movements is lower than its passenger growth. In
the Baseline Case annual commercial ATMs (excluding non-commercial flights such as positioning flights)
are forecast to reach approximately 311,000 by 2029 up from around 283,000 in 2019 representing a
CAGR of 0.9% compared to 2.1% for passengers.
13
Excluding transfers
Preliminary Environmental Information Report: September 2021
Appendix 4.3.1: Forecast Data Book Page 12Our northern runway: making best use of Gatwick
Table 9.1.1: Gatwick Commercial Air Traffic Movements and Non-Commercial Air Traffic Movements Figure 9.1.2: Gatwick Commercial ATMs by Haul
(rounded to nearest 000s)
2019
2029 2032 2038 2047
2019
Northern Northern Northern Northern 11% 10%
Actual Base Base Base Base
Runway Runway Runway Runway
Case Case Case Case
Case Case Case Case
283
Commercial
283k 311k 330k 313k 378k 318k 382k 326k 386k k
ATMs
Non-
79%
Commercial
2k 2k 3k 2k 3k 2k 3k 2k 3k
Air Traffic
Movements Domestic Short Haul Long Haul
Total
Annual
285k 313k 333k 316k 381k 321k 385k 328k 389k 2038 (Base Case) 2038 (Northern Runway
Aircraft
Movements
Case)
16% 9% 8%
17%
9.1.5 The above table uses the following definitions.
▪ ATMs: Commercial Air Traffic Movements: Landings or take-offs of aircraft engaged on the transport 318 382
of passengers, freight or mail on commercial terms (ie scheduled, charter and dedicated freighter k k
flights).
▪ NATMs: Non-Commercial Air Traffic Movements: Landings or take-offs of aircraft movements, 75% 75%
excluding ATMs. Includes positioning flights by commercial operators, business aviation and
recreational / military flights.
▪ TAMs: Total Aircraft Movements = ATMs and NATMs. Domestic Short Haul Long Haul Domestic Short Haul Long Haul
9.1.6 NATMs include positioners, business aviation and other categories. Their share of movements has been
falling over time whilst total movements have continued to grow. In 2019, they accounted for 2047 (Base Case) 2047 (Northern Runway
approximately 1% of total movements and this share is forecast to remain relatively stable. Case)
9% 8%
9.1.7 The commercial ATMs are broken down into the main market types namely domestic, short haul and long 18% 18%
haul.
326 386
k k
73% 74%
Domestic Short Haul Long Haul Domestic Short Haul Long Haul
Preliminary Environmental Information Report: September 2021
Appendix 4.3.1: Forecast Data Book Page 13Our northern runway: making best use of Gatwick
Table 9.2: Gatwick Commercial Air Traffic Movements by Market Mix (000s) Figure 9.2.1: Gatwick Growth in Average Aircraft Size & Load Factor (2019, 2038 & 2047 Base Case)
2029 2032 2038 2047 250 Load 91% 92% 90%
86% Factor
2019 18 80%
Northern Northern Northern Northern 200 19
Actual Base Base Base Base 70%
Runway Runway Runway Runway 28
Case Case Case Case 60%
Case Case Case Case 150
50%
Seats/flight
Seats/flight
Domestic 28k 29k 29k 29k 29k 29k 29k 29k 30k Seats/flight 22440%
100 196 215 206
Short Haul 222k 237k 252k 237k 288k 239k 288k 239k 287k 192
165 30%
Long Haul 32k 45k 49k 47k 61k 51k 64k 58k 69k 50 20%
Total 10%
Commercial 283k 311k 330k 313k 378k 318k 382k 326k 386k 0 0%
ATMs 2019 2038 2047
Passengers Empty Seats Load Factor
Non-
Commercial
2k 2k 3k 2k 3k 2k 3k 2k 3k Source: CAA/GAL Statistics
Air Traffic
Movements Table 9.2.1: Gatwick Commercial Air Traffic Movements Average Loads
Total
2029 2032 2038 2047
Annual
285k 313k 333k 316k 381k 321k 385k 328k 389k
Aircraft 2019
Northern Northern Northern Northern
Movements Actual Base Base Base Base
Runway Runway Runway Runway
Case Case Case Case
Case Case Case Case
9.2. Average Aircraft Size and Passenger Loading
Average
9.2.1 In 2019, Gatwick’s average aircraft size of 192 seats per movement reflected a wide range of aircraft
Aircraft
types (regional, narrow body and wide body) across many airline business models. This metric has been 192 206 208 210 213 215 218 224 227
Loads -
steadily increasing having grown from 180 in 2014 to the 2019 level, representing 7% growth in just 5
Seats
years. In the future, reflecting the main airlines’ order books and trends for larger and more densely
configured aircraft this is forecast to increase to 205 by 2029 representing a further 7% growth. By 2038 Average
average aircraft are forecast to have increased to between 215 and 218 seats (depending on scenario) Aircraft 86% 89% 89% 90% 90% 91% 91% 92% 92%
which would be approximately 15% above 2019. Loads - %
9.2.2 Alongside the trend for larger aircraft, the rate at which airlines fill this capacity has also been improving.
In 2019, average load factors of 86% were achieved, which is more than 3% points higher than 5 years 10 Air Cargo
ago. Looking ahead, the rate at which this will continue to grow is assumed to slow down, but some
growth will still occur. These positive trends will be achieved through better year-round capacity 10.1. Cargo Summary
management alongside the higher proportion of LCCs which operate with higher load factors. By 2038
and 2047 average load factors are assumed to pass 90%. 10.1.1 High level annual cargo forecasts have been prepared considering Gatwick’s evolving traffic mix. The
supply side dynamics of the routes and carriers play a pivotal role in the airport’s cargo performance with
9.2.3 Growth in average loading and aircraft size through the forecast is summarised in the following chart. long haul widebody movements to markets such as Asia/Middle East providing significant opportunity.
10.1.2 Gatwick’s cargo performance has been increasing in recent years reflecting the growth in the number of
long haul markets and carriers. Future growth in cargo tonnage is linked to supply side assumptions
around the carrier and market types being served.
Preliminary Environmental Information Report: September 2021
Appendix 4.3.1: Forecast Data Book Page 14Our northern runway: making best use of Gatwick
10.1.3 Published statistics for Gatwick’s cargo performance have historically been unreliable, typically
11 On Airport Employment
understating volumes as a result of many flights reporting zero when in fact they carried material volumes
of cargo. To ensure the application for development consent is based on accurate figures, GAL has
11.1. Employment Summary
undertaken a one year validation exercise to identify the magnitude of this. Adjusting for the figure in
2019/20 results in an increase from the reported 118,000 tonnes to 150,000 tonnes (ie approx. 30% 11.1.1 Future employment has been forecast by correlating each employee grouping to an appropriate traffic
higher than the published figures). metric – for example ground handling staff is most closely linked to ATMs, while cleaning staff is more
closely linked to passenger volumes.
10.1.4 Under the Northern Runway scenario cargo tonnages are forecast to increase to over 200 k tonnes as the
northern runway enters service. Beyond this they grow steadily to over 300 k tonnes by 2038 primarily 11.1.2 Around 24,000 employees worked on site in 2019 of which approximately 3,300 were employed directly
through increased long haul connectivity offered by the additional runway capacity. By 2047 cargo by Gatwick Airport Limited (GAL). In 2020 with the prevailing pandemic conditions, the number of GAL
tonnages are forecast to be approaching 350,000 tonnes per year. staff fell to approximately 1,900 although this is expected to return to previous levels in line with
recovering passenger numbers in the coming years and the total number of employees on site is forecast
Table 10.1.1: Air Cargo (tonnes, 000s)
to increase to over 27,000 by 2029 and then grow towards 28,800 under the Baseline Case, or up to
32,000 under the Northern Runway Case in 2038. Modest growth is assumed in the 2038-2047 period as
2019 2029 2032 2038 2047
a further 2-3% employees are added taking the total to 29,000 under the Baseline Case or to 32,800
under the Northern Runway Project scenario.
Northern Northern Northern Northern
Base Base Base Base
Reported Adjusted Runway Runway Runway Runway 11.1.3 This growth takes into account future efficiency gains driven by ongoing automation and new
Case Case Case Case
Case Case Case Case technologies. For example, ground handling technologies such as autonomous vehicles and terminal
robots will drive operational efficiencies on the ground. Passenger and baggage processing technologies
Cargo 118 150 228 251 235 305 254 323 290 348
will continue to make the security and customs/immigration processes for passengers and luggage
screening more efficient.
Figure 10.1.1: Gatwick Annual Cargo, Tonnes
11.1.4 Further gains are achieved through larger aircraft and higher aircraft loadings meaning that on site
employment grows at less than half the rate of passengers (1.2% vs 2.6% under the Northern Runway
400
Project scenario). Average passengers per employee increase from 1,800 to over 2,300 by 2038 and
350 around 2,450 by 2047 representing an increase in this ratio of 35%.
11.1.5 For comparison similar efficiency gains have been made since 2002 when average passengers per
300
employee was 1,300, 25% below 2019 levels.
Tonnes (thousands)
250
200
150
100
50
0
2019 2029 2032 2038 2047
Base No R3 NR No R3
Source: CAA/GAL Statistics
Preliminary Environmental Information Report: September 2021
Appendix 4.3.1: Forecast Data Book Page 15Our northern runway: making best use of Gatwick
Figure 11.1.1: On-Airport Employment Forecasts (employees)
35,000
30,000
25,000
20,000
15,000
10,000
5,000
0
2012 2016 2029 2032 2038 2047
Base 2030 R3 NR 2030 R3
Source: GAL Statistics, baseline year of 2016 was most recent year available for analysis
Table 11.1.1: On Airport Employment
2029 2032 2038 2047
2016
Employment Northern Northern Northern Northern
Base Base Base Base
Survey Runway Runway Runway Runway
Case Case Case Case
Case Case Case Case
Total 23,807 27,609 28,596 28,077 31,199 28,770 31,985 29,721 32,822
12 References
Department for Transport (2018) Airports National Policy Statement: New Runway Capacity and
Infrastructure at Airports in the South East of England. [Online] Available at:
https://assets.publishing.service.gov.uk/government/uploads/system/uploads/attachment_data/file/714106
/airports-nps-new-runway-capacity-and-infrastructure-at-airports-in-the-south-east-of-england-web-
version.pdf
Preliminary Environmental Information Report: September 2021
Appendix 4.3.1: Forecast Data Book Page 16Our northern runway: making best use of Gatwick
Data Tables
A1.1 Employment
Table A1.1.1: On Airport Employment (by type)
2029 2032 2038 2047
2016 Employment Survey
Northern Runway Northern Runway Northern Runway Northern Runway
Base Case Base Case Base Case Base Case
Case Case Case Case
Air Cabin Crew 5,791 7,066 7,378 7,227 8,225 7,464 8,481 7,791 8,775
Airline/Airport Management 671 756 777 767 834 783 851 805 871
Apron, Ramp, Cargo, Baggage 2,434 2,549 2,605 2,556 2,744 2,571 2,754 2,588 2,760
Handling and Drivers
Catering, Cleaning and 3,061 3,896 4,101 4,001 4,656 4,157 4,823 4,371 5,016
Housekeeping
Customs, Immigration, Police 1,073 1,383 1,459 1,422 1,665 1,480 1,727 1,559 1,799
and Fire Staff
Information Technology 234 260 266 263 283 268 288 274 294
Maintenance Tradesmen 1,899 2,227 2,308 2,269 2,526 2,330 2,592 2,414 2,667
Management and Professional - 1,374 1,480 1,506 1,493 1,577 1,513 1,598 1,541 1,623
General
Passenger Services/Sales and 3,915 4,158 4,218 4,189 4,380 4,234 4,429 4,297 4,485
Clerical Staff
Pilots/Air Traffic Control/Flight 1,533 1,645 1,700 1,652 1,836 1,667 1,846 1,684 1,852
Operations
Security, Passenger Search, 1,822 2,189 2,278 2,235 2,522 2,303 2,596 2,397 2,680
Security Access Control
Total 23,807 27,609 28,596 28,077 31,199 28,770 31,985 29,721 32,822
Preliminary Environmental Information Report: September 2021
Appendix 4.3.1: Forecast Data BookYou can also read