Predicting the Development Trend of the Second Wave of COVID-19 in Five European Countries
←
→
Page content transcription
If your browser does not render page correctly, please read the page content below
Predicting the Development Trend of the Second Wave of COVID-19 in Five European Countries Zuobing Chen Zhejiang University Jiali Lei China Pharmaceutical University Mengyuan Li China Pharmaceutical University Tianfang Zhang Zhejiang University Xiaosheng Wang ( xiaosheng.wang@cpu.edu.cn ) China Pharmaceutical University https://orcid.org/0000-0002-7199-7093 Research Article Keywords: COVID-19 pandemic, machine learning, prediction model Posted Date: April 5th, 2021 DOI: https://doi.org/10.21203/rs.3.rs-355509/v1 License: This work is licensed under a Creative Commons Attribution 4.0 International License. Read Full License
Predicting the development trend of the second wave of
                  COVID-19 in five European countries
Zuobing Chen 1, §, Jiali Lei 2, 3, §, Mengyuan Li 2, 3, Tianfang Zhang 1, Xiaosheng Wang
2, 3, *

1
    Department of Rehabilitation Medicine, First Affiliated Hospital, College of Medicine,
Zhejiang University, Hangzhou 310003, China
2
    Biomedical Informatics Research Lab, School of Basic Medicine and Clinical
Pharmacy, China Pharmaceutical University, Nanjing 211198, China
3
    Big Data Research Institute, China Pharmaceutical University, Nanjing 211198,
China

§
    Equal contribution
*
    Correspondence to: Xiaosheng Wang (E-mail: xiaosheng.wang@cpu.edu.cn)
Abstract
Background: Because the COVID-19 pandemic has made comprehensive and
profound impacts on the world, an accurate prediction of its development trend is
significant. In particular, the second wave of COVID-19 is rampant to cause a dramatic
increase in COVID-19 cases and deaths globally.
Methods: Using the Eureqa algorithm, we predicted the development trend of the
second wave of COVID-19 in five European countries, including France, Germany,
Italy, Spain, and UK. We first built models to predict daily numbers of COVID-19 cases
and deaths based on the data of the first wave of COVID-19 in these countries. Based
on these models, we built new models to predict the development trend of the second
wave of COVID-19.
Results: We predicted that the second wave of COVID-19 would have peaked around
on November 16, 2020, January 10, 2021, December 1, 2020, March 1, 2021, and
January 10, 2021 in France, Germany, Italy, Spain, and UK, respectively. It will be
basically under control on April 26, 2021, September 20, 2021, August 1, 2021,
September 15, 2021, August 10, 2021 in these countries, respectively. Their total
number of COVID-19 cases will reach around 4,745,000, 7,890,000, 6,852,000,
8,071,000, and 10,198,000, respectively, and total number of COVID-19 deaths will be
around 262,000, 262,000, 231,000, 253,000, and 350,000 during the second wave of
COVID-19. The COVID-19 mortality rate in the second wave of COVID-19 is
expected to be about 3.4%, 3.5%, 3.4%, 3.4%, and 3.1% in France, Spain, Germany,
France, and UK, respectively.
Conclusions: the second wave of COVID-19 is expected to cause many more cases
and deaths, last for much longer time, and have lower COVID-19 mortality rate than
the first wave.

Keywords: COVID-19 pandemic; machine learning; prediction model
Background
The spread of COVID-19 caused by the 2019 novel coronavirus (SARS-CoV-2) is still
growing rapidly across the world since its outbreak in December 2019. The COVID-19
pandemic has caused one of the most serious global public health problems in recent
years.1 It has resulted in more than 123 million cases and 2.7 million deaths worldwide
as of March 22, 2021. More seriously, it is still unclear how this epidemic will evolve.
Currently, the second wave of COVID-19 is raging and is expected to cause many more
cases and deaths than the first wave of COVID-19. Of note, the impacts of the COVID-
19 pandemic are not only limited to global public health but also affect the global
economy, geopolitics, culture, and society. Thus, an accurate prediction of its
development trend may provide valuable advice on how to effectively control its spread
and relieve its major social and economic impacts.

Although a number of studies have estimated the epidemic trend of the COVID-19
outbreak, most have used early-stage data and focused on the first wave of COVID-
19.2-5 For example, using the SEIR (susceptible, exposed, infectious, and removed)
model, Wang et al. estimated the numbers of COVID-19 cases in Wuhan, China, under
the conditions of insufficient and sufficient control measures being taken.2 Wu et al.
predicted the domestic and global spread of SARS-CoV-2 based on travel volume data
during Dec 2019 and Jan 2020.3 Chen et al. evaluated the transmissibility of SARS-
CoV-2 using the reservoir-people transmission network model.4 Yang et al. predicted
the epidemic peaks and scales of COVID-19 using the SEIR model and machine
learning to show the indispensability of the nationwide interventions starting from
January 23, 2020.5 Nevertheless, the second wave of COVID-19 showed different
characteristics compared to the first wave of COVID-19 due to different situations,
including strengthened infectivity caused by SARS-CoV-2 mutations, COVID-19
vaccination, and improved treatment strategies. Thus, prediction of the epidemic trend
of the second wave of COVID-19 is significant.
In this study, using the machine learning approach, we predicted the development trend
of the second wave of COVID-19 in five European countries, including France,
Germany, Italy, Spain, and UK, which are top five most-affected European countries.
We first built prediction models using the publicly available data for the first wave of
COVID-19 in these countries. These data included daily numbers of new confirmed
cases (NCCs), cumulative confirmed cases (CCCs), new deaths (NDs), and cumulative
deaths (CDs) of COVID-19 from the end of February, 2020 to the end of August, 2020.
Based on the prediction models for the first wave of COVID-19, we derived models for
predicting the second wave of COVID-19, including the daily numbers of NCCs, CCCs,
NDs, and CDs and the epidemic development trend. We tested the models using data
from August 14, 2020, to December 31, 2021.

Methods
Data preparation
We downloaded the statistics of confirmed COVID-19 cases in France, Germany, Italy,
Spain, and UK from the Center for Systems Science and Engineering (CSSE) at Johns
Hopkins University (https://coronavirus.jhu.edu/map.html). These statistics included
the daily numbers of NCCs, CCCs, NDs, and CDs since January 22, 2020.
Prediction models
Based on data from the end of February, 2020 to the end of August, 2020, we built
models to predict daily numbers of NCCs and NDs of the first wave of COVID-19 in
France, Germany, Italy, Spain, and UK, respectively, using Eureqa (Trial Version 1.24.0,
https://www.nutonian.com/products/eureqa-desktop). Eureqa is a machine learning
algorithm that can automatically build prediction models from data.6 We input daily
numbers of NCCs and NDs and their corresponding days to obtain a formula that
perfectly shaped the relationships between the variables. We assumed that the second
wave of COVID-19 in a country had a similar development trend to its first wave but
the epidemic of the second wave was more serious. Based on this assumption, we
derived prediction models for the second wave from the models for the first wave in a
country. The start and end dates for the first wave, the start date for the second wave,
and the dates for training sets in each of the five countries are presented in
Supplementary Table S1.
Results
Prediction of numbers of NCCs and CCCs of COVID-19 in France,
Germany, Italy, Spain, and UK
Using data from the end of February, 2020 to the middle of July, 2020, we built five
models to predict daily number of NCCs of the first wave of COVID-19 in France,
Germany, Italy, Spain, and UK, respectively. For France, we obtained the prediction
model:
Y 2292.96 79.88 cos(0.097 X ) 2 16.73 sin(0.63 0.27 X )
(1)
0.35 X 2 cos (0.097 X ) 10.70 X 2549.73 cos(0.093 X )
, where Y is the number of NCCs and X is the time (days). The goodness-of-fit (R2) of
the model was 0.998 on the training set. We found that the daily numbers of NCCs
within the 10 consecutive days starting from July 16, 2020, followed the same
distribution as within the 10 consecutive days starting from March 8, 2020, in France
(Kolmogorov−Smirnov (K−S) test, p = 1) (Fig. 1A). Thus, we supposed that the second
wave had a similar trend to the first wave with a 1-day advance in France. Accordingly,
based on the model to predict daily numbers of NCCs of the first wave, we generated a
model to predict daily numbers of NCCs of the second wave using the data of NCCs
from August 14, 2020 to October 15, 2020 as the training set in France:
Y (2292.96 79.88 cos (0.097 ( ( X 1)))2 16.73
sin(0.63 0.27 ( ( X 1))) 0.35 ( ( X 1)) 2 cos(0.097 ( ( X 1))) (2)
10.70 ( ( X 1)) 2549.73 cos (0.093 ( ( X 1))))
, where Y is the number of NCCs, X is the time (days), and α (= 0.43) and β (= 12.11)
are the tuning parameters. The α value is the ratio of the duration from the start date to
the date when NCCs reached the highest of 8,000 in the first wave (30 days, from March
1, 2020 to March 31, 2020) to that from the start date to the date when NCCs reached
8,000 in the second wave (70 days, from July 1, 2020 to September 9, 2020). The β
value is the ratio of the median number of NCCs in the training set of the second wave
(from August 14, 2020 to October 15, 2020) to that in the first wave (from March 1,
2020 to June 30, 2020).
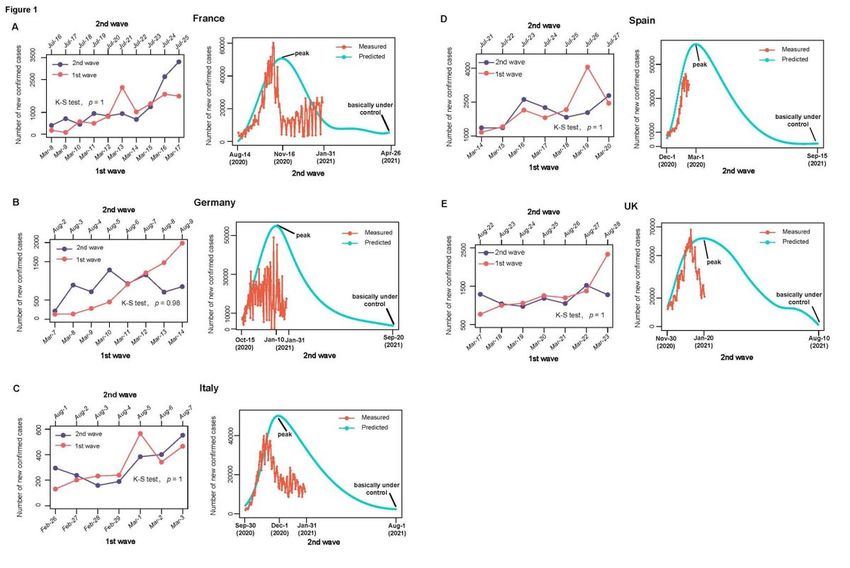
Based on the model (2), we predicted that the number of NCCs would peak on
November 16, 2020, with around 50,000 NCCs, and that the second wave of COVID-
19 epidemic curve would flatten starting from February 6, 2021 in France. Our
prediction was basically consistent with the actual development trend of the second
wave of COVID-19 in France, demonstrating that our prediction model is reasonable.
Furthermore, we predicted that starting from April 26, 2021, the daily numbers of NCCs
would drop to less than 5000, indicating that the second COVID-19 outbreak was
basically under control in France (Fig. 1A). On the basis of the predicted daily numbers
of NCCs, we estimated the daily number of CCCs on a given day as the number of
NCCs that day plus the number of CCCs on the previous day. At the predicted peak of
the COVID-19 outbreak on November 16, 2020, the number of CCCs was estimated to
be 1,862,000. The number of COVID-19 cases is expected to total around 4,745,000
when the second wave of COVID-19 was basically under control in France.
Likewise, we obtained the prediction models for predicting daily numbers of NCCs of
the first wave of COVID-19 in Germany, Italy, Spain, and UK, respectively.
Y 10603.50 1.71 X 2 4.29 X 2 atan2(8.65, X 28.82)
(3)
316.67 X 10.41 X sin(0.063 X ) 1080.42 atan2( X , X 28.82) 2
Y 10018.32 3411.43 atan2(12.23, 1.86 X 45.74)
(4)
2053150.67 / ( X 2000.54 atan2(9.14, 1.97 X 44.91))
Y 12.83 X 2 3663.56 atan(0.00020 X 3 ) 11967.45 atan(0.00020 X 3 ) 2
(5)
60.065 X 0.047 X 3 702.34 X atan(0.00020 X 3 )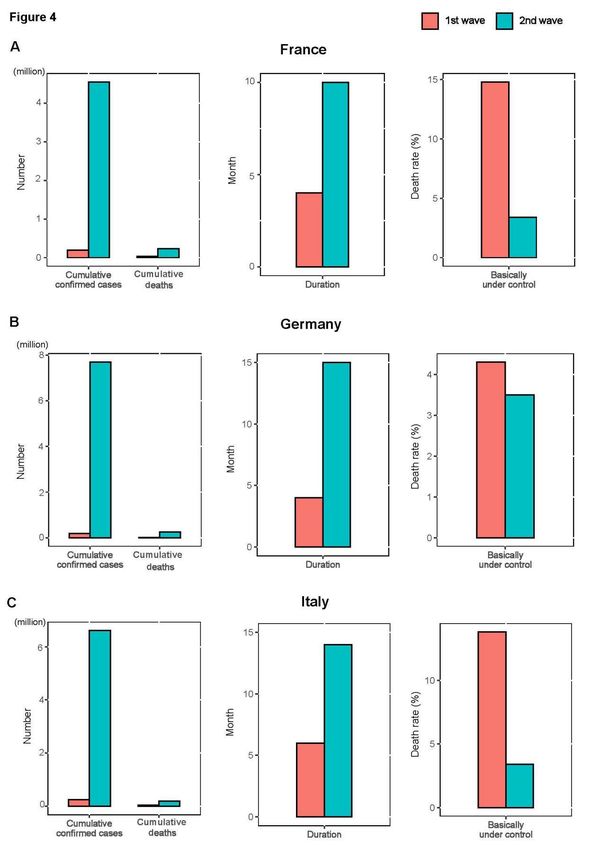
Y 3868.21 atan(2.31e 6 X 4 ) 77.77 X 2226.50 atan(0.042 X )
(6)
4.77 X atan(sin(0.091* X )) atan(2.31e 6 X 4 )
, where Y is the number of NCCs and X is the time (days). The goodness-of-fit (R2) of
these models were 0.999, 0.996, 0.983, 0.996 on the training set, respectively. We found
that the daily numbers of NCCs within the 8 consecutive days starting from August 2,
2020, followed the same distribution as within the 8 consecutive days starting from
March 7, 2020, in Germany (K−S test, p = 0.98) (Fig. 1B). The daily numbers of NCCs
within the 7 consecutive days starting from August 1, 2020, followed the same
distribution as within the 7 consecutive days starting from February 26, 2020, in Italy
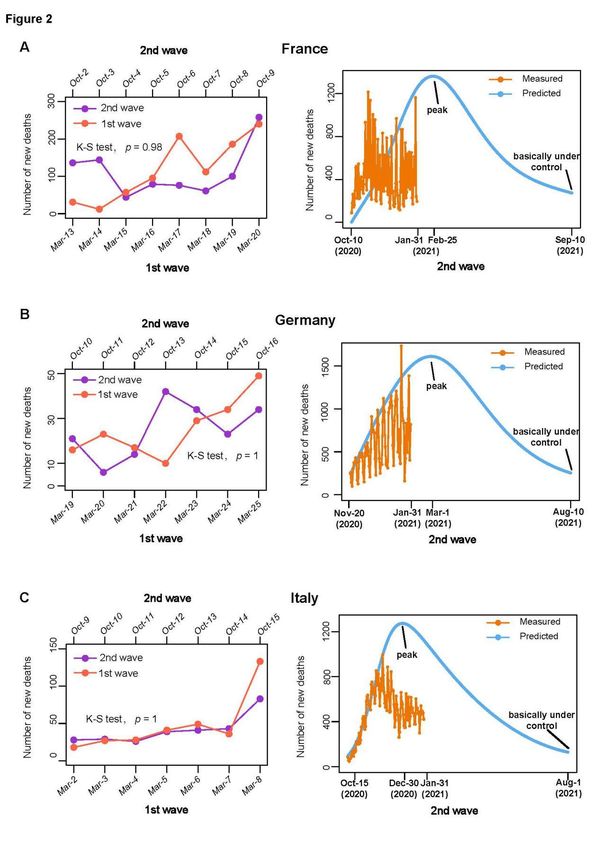
(K−S test, p = 1) (Fig. 1C). The daily numbers of NCCs within the 7 consecutive days
starting from July 21, 2020, followed the same distribution as within the 7 consecutive
days starting from March 14, 2020, in Spain (K−S test, p = 1) (Fig. 1D). The daily
numbers of NCCs within the 7 consecutive days starting from August 22, 2020,
followed the same distribution as within the 7 consecutive days starting from March 17,
2020, in UK (K−S test, p = 1) (Fig. 1E). We supposed that the second wave of COVID-
19 followed a similar pattern to the first wave with a 13-, 7-, 0-, and 22-day lag in
Germany, Italy, Spain, and UK, respectively. Accordingly, based on the models ((3)-(6))
to predict daily numbers of NCCs of the first wave, we generated models to predict
daily numbers of NCCs of the second wave in Germany, Italy, Spain, and UK,
respectively as follows.
Y (10603.50 1.71 ( ( X 13))2 4.29 ( ( X 13))2
atan2(8.65,( ( X 13)) 28.82) 316.67 ( ( X 13))
(7)
10.41 ( ( X 13)) sin(0.063 ( ( X 13)))
1080.42 atan2(( ( X 13)),( ( X 13)) 28.82)2 )
Y (10018.32 3411.43 atan 2(12.23, 1.86 ( ( X 7)) 45.74)
2053150.67 / (( ( X 7)) 2000.54 atan2(9.14, 1.97 ( ( X 7)) (8)
44.91)))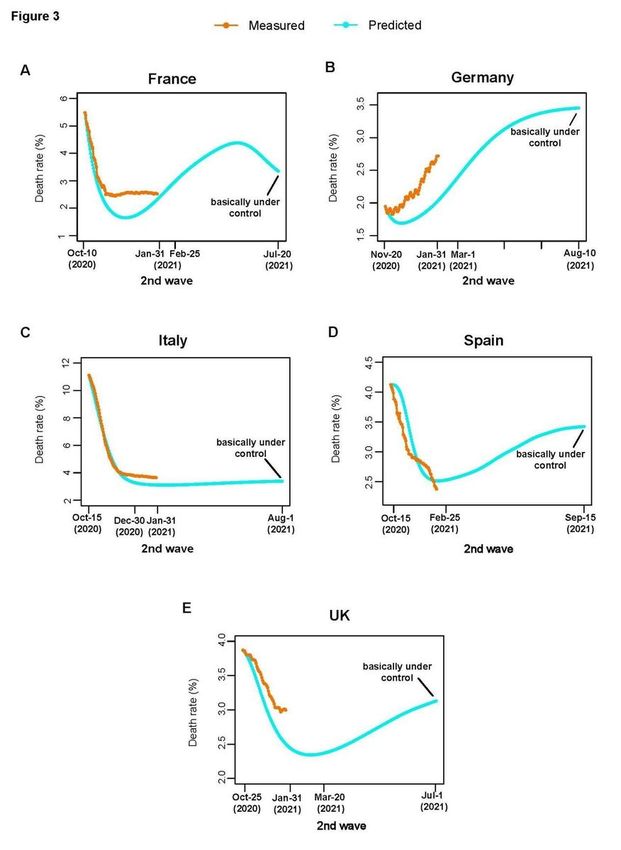
Y (12.83 ( X )2 3663.56 atan(0.00020 ( X )3 ) 11967.45
atan(0.00020 ( X )3 )2 60.065 ( X ) 0.047 ( X )3 (9)
702.34 ( X ) atan(0.00020 ( X )3 ))
Y (3868.21 atan(2.31e 6 ( ( X 22)) 4 ) 77.77 ( ( X 22))
2226.50 atan(0.042 ( ( X 22))) 4.77 ( ( X 22)) (10)
atan( sin(0.091 ( ( X 22)))) atan(2.31e 6 ( ( X 22)) ))
4
, where Y is the number of NCCs, X is the time (days), α is the ratio of the duration from
the start date to the date when NCCs reached the highest number in the first wave to
that from the start date to the date when NCCs reached the highest number in the second
wave, and β is the ratio of the median number of NCCs in the training set of the second
wave to that in the first wave. The durations from the start date to the date when NCCs
reached the highest number in the first and second waves of COVID-19 are presented
in Supplementary Table S2. For Germany, Italy, Spain and UK, the α value was 0.23,
0.33, 0.31, and 0.42, respectively, and the β value was 9.64, 9.21, 8.24, and 12.91,
respectively.
Based on these models ((7)-(10)), we predicted that the number of NCCs would peak
on January 10, 2021 (around 54,000), December 1, 2020 (around 49,000), March 1,
2021 (around 61,000), and January 10, 2021 (around 62,000) in Germany, Italy, Spain
and UK, respectively (Fig. 1B, 1C, 1D, and 1E). At the predicted peak of the second
wave of COVID-19, the number of CCCs was estimated to be around 3,381,000,
2,049,000, 4,009,000, and 4,324,000 in Germany, Italy, Spain, and UK, respectively.
Furthermore, we predicted that the second wave of COVID-19 would be basically under
control on September 20, 2021 in Germany with about 3,500 NCCs, on August 1, 2021
in Italy with about 2,000 NCCs, on September 15, 2021 in Spain with about 3,000
NCCs, and on August 10, 2021 in UK with about 1,400 NCCs. The number of COVID-
19 cases was expected to total around 7,890,000 in Germany, 6,852,000 in Italy,
8,071,000 in Spain, and 10,198,000 in UK when their second waves of COVID-19 were
basically under control.
Prediction of numbers of NDs and CDs of COVID-19 in France,
Germany, Italy, Spain, and UK
We used Eureqa to train five models to predict daily numbers of NDs of the first wave
of COVID-19 in France, Germany, Italy, Spain, and UK respectively, using data from
March 1, 2020 to August 31, 2020. The five models are as follows.
Y 1.48 X 2 6171.21 atan2(0.16 X ,3.92) 94.99 193.92 X
(11)
0.0035 X 3 135.97 sin(2.02 log ( X ) atan2(0.16 X ,3.92))
Y 13.92 X 0.014 X 2 12.28 cos(0.074 X )
(12)
43.74 9.73 X atan(2.11e 5 X 3 )
Y 1268.92 0.11 X 2 17.65 X atan2(3737.68,0.16 X 3 )
(13)
23.34 X 805.18 atan2(1564.58,0.16 X 3 )
Y 71.13 0.00063 exp(0.15 X ) 0.15 X 3 atan2(813.26,0.0063 X 4 )
(14)
0.062 X 2 27.40 cos(0.0063 X 2 ) sin(atan2(3641.85, exp(0.15 X )))
Y X 2 atan2(2747.67,0.0018 X 4 ) 0.70 X (15)
, where Y is the number of NDs and X is the time (days). The goodness-of-fit (R2) of
these models were 0.996, 0.999, 0.996, 0.998, and 0.997, respectively. We found that
the daily numbers of NDs within the 8 consecutive days starting from October 2, 2020,
followed the same distribution as within the 8 consecutive days starting from March 13,
2020, in France (K−S test, p = 0.98) (Fig. 2A). The daily numbers of NDs within the 7
consecutive days starting from October 10, 2020, followed the same distribution as
within the 7 consecutive days starting from March 19, 2020, in Germany (K−S test, p
= 1) (Fig. 2B). The daily numbers of NDs within the 7 consecutive days starting from
October 9, 2020, followed the same distribution as within the 7 consecutive days
starting from March 2, 2020, in Italy (K−S test, p = 1) (Fig. 2C). The daily numbers of
NDs within the 7 consecutive days starting from August 28, 2020, followed the same
distribution as within the 7 consecutive days starting from March 10, 2020, in Spain
(K−S test, p = 1) (Fig. 2D). The daily numbers of NDs within the 7 consecutive daysstarting from September 17, 2020, followed the same distribution as within the 7
consecutive days starting from March 14, 2020, in UK (K−S test, p = 1) (Fig. 2E). We
assumed that the second wave of COVID-19 followed a similar pattern to the first wave
with a 20-, 19-, 18-, 11-, and 15-day lag in France, Germany, Italy, Spain, and UK,
respectively. Thus, based on the models ((11)-(15)) to predict daily numbers of NDs of
the first wave, we generated the models to predict daily numbers of NDs of the second
wave in France, Germany, Italy, Spain, and UK, respectively as follows.
Y (1.48 ( ( X 20)) 2 6171.21 atan2(0.16 ( ( X 20)),3.92)
94.99 193.92 ( ( X 20)) 0.0035 ( ( X 20))3 135.97 (16)
sin(2.02 log (( ( X 20))) atan2(0.16 ( ( X 20)),3.92)))
Y (13.92 ( ( X 19)) 0.014 ( ( X 19)) 2 12.28
cos (0.074 ( ( X 19))) 43.74 9.73 ( ( X 19)) (17)
atan(2.11e 5 ( ( X 19)) ))
3
Y (1268.92 0.11 ( ( X 18))2 17.65 ( ( X 18))
atan2(3737.68, 0.16 ( ( X 18))3 ) 23.34 ( ( X 18)) (18)
805.18 atan2(1564.58, 0.16 ( ( X 18))3 ))
Y (71.13 0.00063 exp(0.15 ( ( X 11))) 0.15 ( ( X 11)) 3
atan2(813.26, 0.0063 ( ( X 11)) 4 ) 0.062 ( ( X 11)) 2 27.40 (19)
cos(0.0063 ( ( X 11)) 2 ) sin(atan2(3641.85, exp(0.15 ( ( X 11))))))
Y (( ( X 15)) 2 atan2(2747.67, 0.0018 ( ( X 15)) 4 )
(20)
0.70 ( ( X 15)))
, where Y is the number of NDs, X is the time (days), α is the ratio of the duration from
the start date to the date when NDs reached the highest number in the first wave to that
from the start date to the date when NDs reached the highest number in the second wave,
and β is the ratio of the median number of NDs in the training set of the second wave
to that in the first wave. The durations from the start date to the date when NDs reached
the highest number in the first and second waves of COVID-19 are presented in
Supplementary Table S2. For France, Germany, Italy, Spain, and UK, the α value was
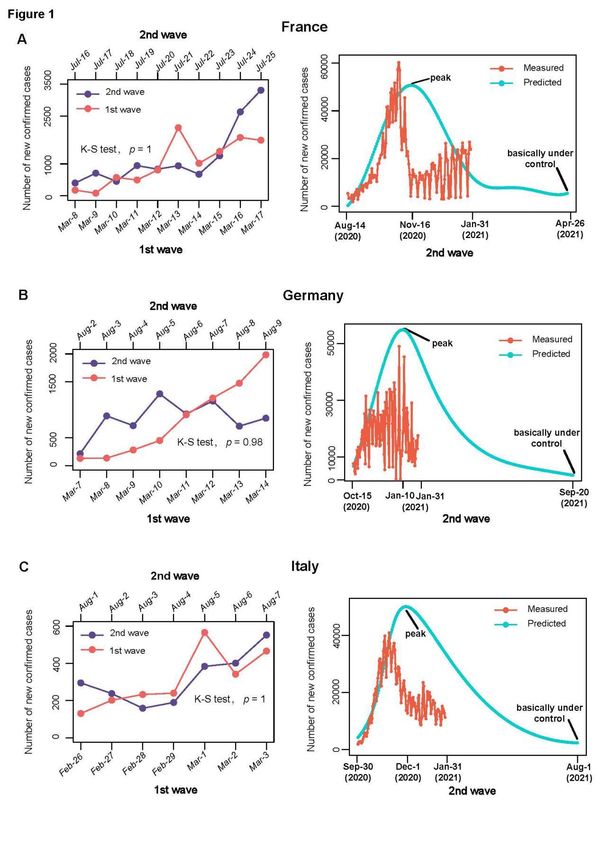
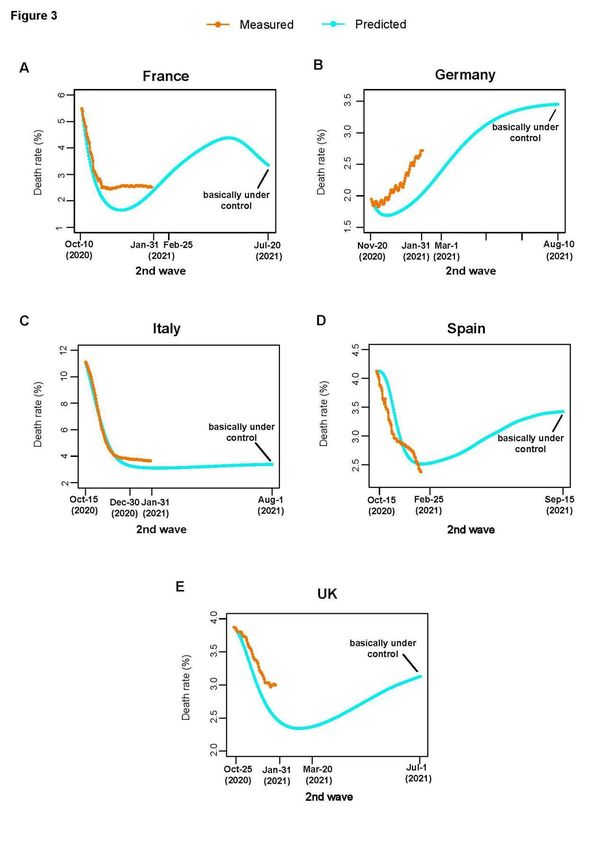
0.18, 0.23, 0.29, 0.20, and 0.18, respectively, and the β value was 1.40, 6.89, 1.66, 1.60and 1.54, respectively. Based on these models ((16)-(20)), we predicted that the number of NDs would peak on February 25, 2021 in France (around 1,300), March 1, 2021 in Germany (around 1,600), December 30, 2020 in Italy (around 1,200), February 25, 2021 in Spain (around 1,300), and March 20, 2021 in UK (around 1,500). Furthermore, we predicted that at the peak of the second wave of COVID-19, the number of CDs would be about 122,000, 126,000, 90,000, 109,000, and 159,000 in France, Germany, Italy, Spain, and UK, respectively (Fig. 2A, 2B, 2C, 2D, and 2E). There will be around 262,000, 262,000, 231,000, 253,000, and 350,000 COVID-19 deaths during the first and second waves of epidemics in France, Germany, Italy, Spain, and UK, respectively. We calculated the daily death rate of COVID-19 as the number of CDs on this day divided by the number of CCCs 10 days before.7 When the second wave of COVID-19 is basically under control, the death rate of COVID-19 was estimated to be 3.4%, 3.5%, 3.4%, 3.4%, and 3.1% in France, Germany, Italy, Spain, and UK, respectively (Fig. 3). Comparisons between the first wave and the second wave of COVID- 19 in France, Germany, Italy, Spain, and UK When the first wave of COVID-19 was basically under control in the end of June 2020, the number of CCCs was around 194,000, 187,000, 243,000, 244,000 and 283,000 in France, Germany, Italy, Spain, and UK, respectively. Strikingly, the numbers of CCCs in the second wave of COVID-19 were expected to increase by more than 20 times in these countries, as estimated to be around 4,551,000, 7,703,000, 6,609,000, 7,827,000, and 9,914,000 CCCs in France, Germany, Italy, Spain, and UK, respectively (Fig. 4). Further, the number of COVID-19 deaths was predicted to be around 232,000, 253,000, 196,000, 224,000, and 308,000 during the second wave of COVID-19 in France, Germany, Italy, Spain, and UK, respectively, compared to 30,000, 9,000, 35,000, 28,000, and 41,000 deaths caused by COVID-19 during the first wave of COVID-19 in
these countries (Fig. 4). These data demonstrate that the second wave of COVID-19
will cause much more serious devastation than the first wave. Moreover, the duration
of the second wave was expected to be much longer than that of the first wave in these
countries. We predicted that the duration of the second wave would be 10 months (from
July, 2020 to April, 2021) in France, 15 months (from July, 2020 to September, 2021)
in Germany, 14 months (from July, 2020 to August, 2021) in Italy, 15 months (from
July, 2020 to September, 2021) in Spain, and 14 months (from July, 2020 to August,
2021) in UK, compared to 4-6 month duration of the first wave in these countries (Fig.
4). Nevertheless, the death rate was expected to drop down in the second versus the first
wave in these countries (3.4% versus 14.8% in France, 3.5% versus 4.3% in Spain, 3.4%
versus 13.8% in German, 3.4% versus 10.7% in France, and 3.1% versus 13.3% in UK)
(Fig. 4).

Discussion

The COVID-19 pandemic has lasted for more than one year and has made
comprehensive and profound impacts on the world. Currently, the second wave of
COVID-19 is spreading throughout the world and is expected to result in many more
cases and deaths than the first wave. The second wave of COVID-19 started from
Europe and has seriously hit several European countries, including France, Germany,
Italy, Spain, and UK. Based on the data of the first wave and the early-stage data of the
second wave in these countries, we built models to predict the development trends of
their second waves of COVID-19. Notably, the second wave of COVID-19 is expected
to last for longer time and cause much more damage than the first wave. The main
reason could be: first, SARS-CoV-2 mutations increased its infectivity; 8-9 second, cold
temperatures in winter promoted the spread of COVID-19; third, gathering over
the holiday season increased the transmission of COVID-19. On the other hand, the
death rate of COVID-19 is expected to lower down in the second versus the first wave.
Several factors could be responsible for this. First, many more young people were
infected with SARS-CoV-2 in the second versus the first wave who often have better
outcomes than old people. Second, hospitals have accumulated more experiences in
effectively treating severe COVID-19 patients in the second versus the first wave. It
should be noted that our prediction of the characteristics of the second wave of COVID-
19 in the five European countries also applies to the other countries hard hit by this
disease, such as the United States, India, Brazil, Russia, and Mexico.

The experience of China suggests that the COVID-19 outbreak is controllable if
effective strategies are employed,5 such as city lockdowns, traffic control, and
concentrated medical support for seriously infected areas. Otherwise, the epidemic
could evolve into a more severe trend, even out of control. Actually, the second wave
of COVID-19 has shown to be much more serious than the first wave in France, Spain,
Germany, France, and UK. It indicates that the prevention and control measures for
COVID-19 were insufficient in these countries. The recent rapid spread of COVID-19
in Europe highlights the importance of implementing more stringent control measures
in the context of uncertain effectiveness of COVID-19 vaccines. Indeed, China's
experiences in containing the spread of COVID-19 could be helpful for those countries
where COVID-19 is rampant. For example, China has effectively blocked large-
scale community transmission of COVID-19 by the immediate lockdown of the regions
with the worst outbreaks, and reduced more deaths by providing nationwide medical
support for these regions. China has implemented the classification management of
hospitals with some hospitals concentrating on serving critical COVID-19 cases and
others designated for routine medical care. In addition, numerous mobile hospitals had
been built to admit suspected and mild patients in China, and strict quarantine rules
were enforced. In China, masks are widely used in public area.

We predicted that the second wave of COVID-19 would be basically under control in
summer 2021. After that, the third wave of COVID-19 could appear or not, depending
on the effectiveness of vaccines at preventing COVID-19. If the COVID-19 vaccines
are not effective or cannot provide long-term protection from SARS-CoV-2 infection,
the third wave of COVID-19 should emerge in this summer. In this situation,
comprehensive and stringent control measures must be taken for mitigating the spread
of the third wave of COVID-19.

Conclusion
The second wave of COVID-19 is expected to cause many more cases and deaths, last
for much longer time, and have lower COVID-19 mortality rate than the first wave.

Declarations

Ethics approval and consent to participate

Ethical approval was waived since we used only publicly available data and materials
in this study.

Consent for publication

Not applicable.

Availability of data and materials

The statistics of COVID-19 cases were obtained from the Center for Systems Science
and Engineering at Johns Hopkins University (https://coronavirus.jhu.edu/map.html).

Competing interests

The authors declare that they have no competing interests.

Funding

This work was supported by the China Pharmaceutical University (grant number
3150120001) and the Science and Technology Project of Traditional Chinese Medicine
in Zhejiang Province (grant number: 2017ZK1003).

Authors' contributions

Zuobing Chen: Methodology, Validation, Formal analysis, Investigation, Data
curation, Writing - review & editing, Funding acquisition. Jiali Lei: Methodology,
Software, Validation, Formal analysis, Investigation, Data curation, Visualization,
Writing - review & editing. Mengyuan Li: Methodology, Software. Tianfang Zhang:
Methodology, Funding acquisition. Xiaosheng Wang: Conceptualization,
Methodology, Resources, Investigation, Writing - original draft, Writing - review &
editing, Supervision, Project administration, Funding acquisition.

Acknowledgements

Not applicable.

References
1. Gates B. Responding to Covid-19-A Once-in-a-Century Pandemic? The
New England journal of medicine 2020; 382(18): 1677-1679.
2. Wang H, Wang Z, Dong Y, et al. Phase-adjusted estimation of the number
of Coronavirus Disease 2019 cases in Wuhan, China. Cell discovery 2020;
6: 10.
3. Wu JT, Leung K, Leung GM. Nowcasting and forecasting the potential domestic and
international spread of the 2019-nCoV outbreak originating in Wuhan, China: a
modelling study. Lancet (London, England) 2020; 395(10225): 689-97.
4. Chen TM, Rui J, Wang QP, et al. A mathematical model for simulating the phase-
based transmissibility of a novel coronavirus. Infectious diseases of poverty 2020; 9(1):
24.
5. Yang ZF, Zeng ZQ, Wang K. Modified SEIR and AI prediction of the epidemics trend
of COVID-19 in China under public health interventions. Journal of thoracic disease
2020; 12(3): 165-174.
6. Schmidt M, Lipson H. Distilling Free-Form Natural Laws from Experimental Data.
324(5923): 81-5.
7. Baud D, Qi X, Nielsen-Saines K, et al. Real estimates of mortality following
COVID-19 infection. The Lancet Infectious Diseases 2020; 20(7): 773.
8. Plante, J. A., Liu Y, Liu J, et al. Spike mutation D614G alters SARS-CoV-2 fitness.
Nature 2020. DOI: 10.1038/s41586-020-2895-3.
9. Li Q, Wu J, Nie J, et al. The Impact of Mutations in SARS-CoV-2 Spike on Viral
Infectivity and Antigenicity. Cell 2020; 182(5): 1284-1294 e1289.
Figures
Figure 1. Prediction of daily numbers of new COVID-19 cases in five European
countries. Similar pattern in daily numbers of new cases between the first wave and
the second wave of COVID-19 and comparisons between predicted and measured daily
numbers of new cases in the second wave of COVID-19 in France (A), Germany (B),
Italy (C), Spain (D), and UK (E).
Figure 2. Prediction of daily numbers of new COVID-19 deaths in five European
countries. Similar pattern in daily numbers of new deaths between the first wave and
the second wave of COVID-19 and comparisons between predicted and measured daily
numbers of new deaths in the second wave of COVID-19 in France (A), Germany (B),
Italy (C), Spain (D), and UK (E).
Figure 3. Comparisons between predicted and measured death rates in the second
wave of COVID-19. Curves showing predicted and measured daily death rates in the
second wave of COVID-19 in France (A), Germany (B), Italy (C), Spain (D), and UK
(E).
Figure 4. Comparisons between the first wave and the second wave of COVID-19.
Comparisons of the number of cumulative confirmed cases, the number of cumulative
deaths, death rate, and duration between the first wave and the second wave of COVID-
19 in France (A), Germany (B), Italy (C), Spain (D), and UK (E).
Supplementary material

     Table S1. The dates for the start and end of the first wave and the second wave of
                           COVID-19 in the five European countries.

                                                    New confirmed cases
                         1st wave                                                2nd wave

Country                                                                                                    Median
                                       Median                          End date        Dates for the
          Start date    End date       number        Start date                                           number of
                                                                      (predicted)       training set
                                    of new cases                                                          new cases

                                                                                        14-Aug-20 ̶
France    1-Mar-20     30-Jun-20         572          1-Jul-20       26-Apr-21                              6,926
                                                                                            15-Oct-20

                                                                                            15-Oct-20 ̶
          1-Mar-20     14-Jun-20        1,601         15-Jun-20      20-Sep-21                             15,434
Germany
                                                                                            30-Nov-20

                                                                                            30-Sep-20 ̶
          21-Feb-20    13-Jun-20         985          14-Jul-20      1-Aug-21                               9,070
 Italy
                                                                                             31-Oct-20
                                                                                        1-Dec-20 ̶
 Spain    1-Mar-20     15-Jun-20        1,313         16-Jun-20      15-Sep-21                             10,831
                                                                                        31-Dec-20

                                                                                        30-Nov-20 ̶
          1-Mar-20     30-Jun-20        1,814         1-Jul-20       10-Aug-21                             23,417
  UK
                                                                                            31-Dec-20
                                                        New deaths
                         1st wave                                                2nd wave

Country                                                                                                     Median
                                       Median                         End date         Dates for the
          Start date    End date       number        Start date                                            number of
                                                                     (predicted)        training set
                                    of new deaths                                                         new deaths

                                                                                            10-Oct-20 ̶
France    13-Mar-20    31-Jul-20         280          1-Aug-20       10-Sep-21                              391
                                                                                            10-Dec-20
                                                                                        20-Nov-20 ̶
Germany   20-Mar-20    19-Aug-20         63          20-Aug-20       10-Aug-21                              434
                                                                                            31-Dec-20
                                                                                            15-Oct-20 ̶
 Italy    1-Mar-20     31-Aug-20         287          1-Sep-20       1-Aug-21                               477
                                                                                            15-Dec-20
                                                                                            15-Oct-20 ̶
 Spain    6-Mar-20     31-Jul-20         145          1-Aug-20       15-Sep-21                              231
                                                                                            15-Dec-20
                                                                                            25-Oct-20 ̶
  UK      14-Mar-20    19-Aug-20         272         20-Aug-20       20-Sep-21                              419
                                                                                            31-Dec-20
Table S2. The dates for the start and when new confirmed cases or new deaths
reached the highest number of the first wave and the second wave of COVID-19
in the five European countries.
New confirmed cases (NCCs)
1st wave 2nd wave
Country The date when The date when The highest
Duration Duration
Start date NCCs reached the Start date NCCs reached the number of
(days) (days)
highest number highest number NCCs
France 1-Mar-20 31-Mar-20 30 1-Jul-20 9-Sep-20 70 8,000
Germany 1-Mar-20 27-Mar-20 27 15-Jun-20 15-Oct-20 120 7,000
Italy 21-Feb-20 21-Mar-20 30 14-Jul-20 14-Oct-20 90 7,000
Spain 1-Mar-20 25-Mar-20 25 16-Jun-20 4-Sep-20 80 10,000
UK 1-Mar-20 6-Apr-20 35 1-Jul-20 23-Sep-20 83 5,000
New deaths (NDs)
1st wave 2nd wave
Country The date when The date when NDs The highest
Duration Duration
Start date NDs reached the Start date reached the highest number of
(days) (days)
highest number number NDs
France 13-Mar-20 3-Apr-20 20 1-Aug-20 17-Nov-20 110 1,000
Germany 20-Mar-20 15-Apr-20 25 20-Aug-20 8-Dec-20 110 500
Italy 1-Mar-20 27-Mar-20 27 1-Sep-20 3-Dec-20 93 1,000
Spain 6-Mar-20 25-Mar-20 20 1-Aug-20 11-Nov-20 100 700
UK 14-Mar-20 7-Apr-20 23 20-Aug-20 30-Dec-20 130 1,000Figures Figure 1 Prediction of daily numbers of new COVID-19 cases in ve European countries. Similar pattern in daily numbers of new cases between the rst wave and the second wave of COVID-19 and comparisons between predicted and measured daily numbers of new cases in the second wave of COVID-19 in France (A), Germany (B), Italy (C), Spain (D), and UK (E).
Figure 2

Prediction of daily numbers of new COVID-19 deaths in ve European countries. Similar pattern in daily
numbers of new deaths between the rst wave and the second wave of COVID-19 and comparisons
between predicted and measured daily numbers of new deaths in the second wave of COVID-19 in France
(A), Germany (B), Italy (C), Spain (D), and UK (E).
Figure 3

Comparisons between predicted and measured death rates in the second wave of COVID-19. Curves
showing predicted and measured daily death rates in the second wave of COVID-19 in France (A),
Germany (B), Italy (C), Spain (D), and UK (E).
Figure 4

Comparisons between the rst wave and the second wave of COVID-19. Comparisons of the number of
cumulative con rmed cases, the number of cumulative deaths, death rate, and duration between the rst
wave and the second wave of COVID-19 in France (A), Germany (B), Italy (C), Spain (D), and UK (E).

Supplementary Files
This is a list of supplementary les associated with this preprint. Click to download.

    SupplementaryTables.docx
You can also read