Pre-flight qualification tests of the Mini-EUSO telescope engineering model
←
→
Page content transcription
If your browser does not render page correctly, please read the page content below
Experimental Astronomy (2022) 53:133–158
https://doi.org/10.1007/s10686-021-09805-w
ORIGINAL ARTICLE

Pre-flight qualification tests of the Mini-EUSO
telescope engineering model

F. Bisconti1,2 · H. Miyamoto1,2 · D. Barghini1,2,3 · M. Battisti1,2 · A. Belov4 ·
M. E. Bertaina1,2 · S. Blin-Bondil5,15 · G. Cambiè6,7 · F. Capel8,9 ·
M. Casolino6,7,10 · A. Cellino2,3 · L. Conti6,11 · G. Contino12 · G. Cotto1,2 ·
T. Ebisuzaki10 · F. Fenu1,2 · C. Fornaro11 · A. Franceschi13 · D. Gardiol3 ·
A. Haungs14 · P. Klimov4 · M. Manfrin1,2 · L. Marcelli6 · M. Mignone2 ·
T. Napolitano13 · E. Parizot15 · P. Picozza6,7 · L. W. Piotrowski16,10 ·
G. Prévôt15 · E. Reali6,7 · M. Ricci13 · K. Shinozaki1,17 · F. Simioli11 · G. Suino1,2 ·
J. Szabelski17

Received: 14 June 2021 / Accepted: 29 September 2021 / Published online: 20 October 2021
© The Author(s) 2021

Abstract
Mini-EUSO is part of the JEM-EUSO program and operates on board the Inter-
national Space Station (ISS). It is a UV-telescope with single-photon counting
capability looking at nighttime downwards to the Earth through a nadir-facing UV-
transparent window. As part of the pre-flight tests, the Mini-EUSO engineering
model, a telescope with 1/9 of the original focal surface and a lens of 2.5 cm diam-
eter, has been built and tested. Tests of the Mini-EUSO engineering model have
been made in laboratory and in open-sky conditions. Laboratory tests have been per-
formed at the TurLab facility, located at the Physics Department of the University
of Turin, equipped with a rotating tank containing different types of materials and
light sources. In this way, the configuration for the observation of the Earth from
space was emulated, including the Mini-EUSO trigger schemes. In addition to the
qualification and calibration tests, the Mini-EUSO engineering model has also been
used to evaluate the possibility of using a JEM-EUSO-type detector for applications
such as observation of space debris. Furthermore, observations in open-sky condi-
tions allowed the studies of natural light sources such as stars, meteors, planets, and
artificial light sources such as airplanes, satellites reflecting the sunlight, and city
lights. Most of these targets could be detected also with Mini-EUSO. In this paper,
the tests in laboratory and in open-sky conditions are reported, as well as the obtained
results. In addition, the contribution that such tests provided to foresee and improve
the performance of Mini-EUSO on board the ISS is discussed.

 F. Bisconti
    francesca.bisconti@to.infn.it

Extended author information available on the last page of the article.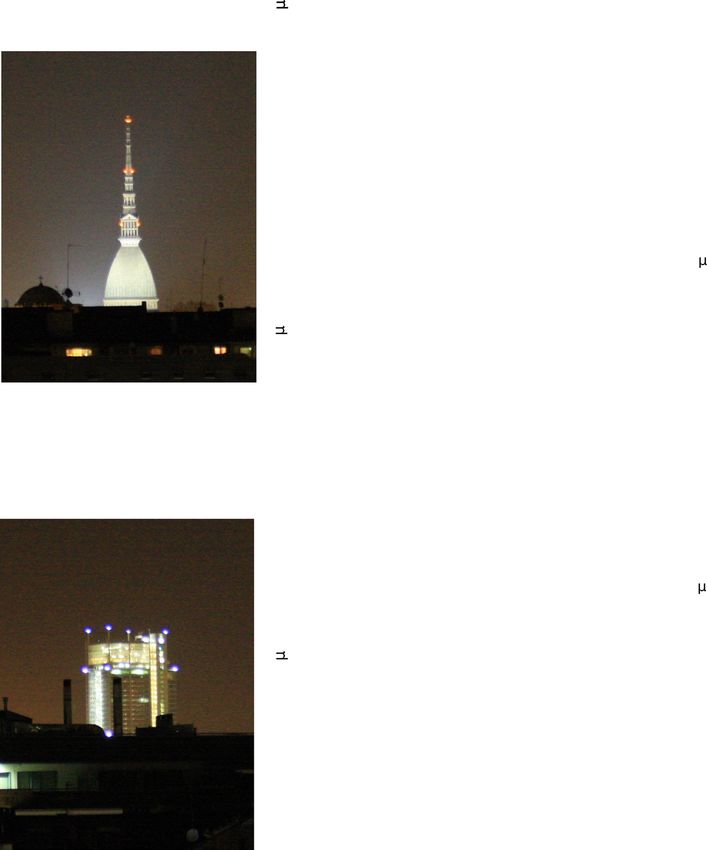
134                                                  Experimental Astronomy (2022) 53:133–158

Keywords Mini-EUSO · Fluorescence detector · Near-UV observations ·
EUSO@TurLab · Stars · Meteors

1 Introduction

Mini-EUSO [1] is the first space-based mission of the JEM-EUSO (Joint Exper-
iment Missions for Extreme Universe Space Observatory) program [2], installed
inside the International Space Station (ISS). The JEM-EUSO program is devoted to
detect Ultra-High Energy Cosmic Rays (UHECRs) from space, through the fluores-
cence detection technique. When charged particles in extensive air showers induced
by primary cosmic rays excite nitrogen molecules in the atmosphere, the molecu-
lar fluorescence transition leads to the isotropic light emission in the near-UV band
(290-430 nm), which can be detected with highly sensitive telescopes at nighttime.
Moreover, fluorescence detectors observe also the Cherenkov light emitted when
charged particles travel faster than the speed of light in that medium. The Cherenkov
emission occurs along the shower axis and can be observed directly, measuring pho-
tons coming from the characteristic Cherenkov cone (by ground-based detectors), or
after ground reflection (by high-altitude detectors).
   A detector on satellite would be able to observe the extensive air shower along
its development in the atmosphere. Moreover, orbiting around the Earth it would
have a full-sky coverage, allowing the direct study of large scale anisotropies and the
search for sources of UHECRs, as they are not significantly deflected by magnetic
fields. With a wide field of view, such a detector can increase the probability to detect
cosmic rays at the extreme energies with respect to ground-based observatories. In
addition, a space-based observatory allows to study a variety of atmospheric phenom-
ena including transient luminous events (sprites, blue jets, elves, etc.), and lightning
discharges, as well as meteors and, possibly, samples of strange quark matter (nucle-
arites) [3]. Ground-based light sources like anthropogenic lights and bioluminescence
can also be observed.
   To prove the UHECRs detection principle and study the aforementioned phe-
nomena and their possible impact on the detection of UHECRs from space, the
Mini-EUSO mission has been developed as a joint project between the Italian (ASI)
and Russian (Roscosmos) space agencies. Mini-EUSO has been installed inside the
ISS in August 2019, at an altitude of ∼400 km on the UV transparent window in the
Russian Zvezda module. It is active since October 2019, with some data acquisition
sessions being performed each month.
   Mini-EUSO and its main science objectives are depicted in Fig. 1. Among the
other objectives already described for a space-based telescope, Mini-EUSO will
provide the mapping of the Earth in the near-UV band at night, giving important
information on the emissions from the Earth’s surface, which will also represent
the background for the detection of other phenomena occurring in the atmosphere.
Although the present configuration of Mini-EUSO on the ISS is not optimal for the
detection of orbiting space debris, it is important to study the capability of the JEM-
EUSO-like telescopes [4] to detect and track them. For their high temporal sampling
rates, this type of telescopes are under consideration for the development of a system
Experimental Astronomy (2022) 53:133–158                                                        135

Fig. 1 The Mini-EUSO mission with several of its target light sources: emissions from the Earth (for
example cities), from the sea (bioluminescence), meteors, candidate events of strange quark matter
(nuclearites), atmospheric events, UHECRs, and scattered light from laser emissions

on a free-flyer satellite for space debris detection, tracking and, in combination with a
high-energy laser, possible remediation [5]. To calibrate Mini-EUSO in its final stage
on board the ISS, ground-based lasers shooting in the field of view of the telescope
will be used [6–8].
    A Mini-EUSO engineering model (Mini-EUSO EM) was built and tested. It
was used in the qualification tests (vibration, electric and electromagnetic interfer-
ence and compatibility, and thermal-vacuum/environmental tests), with lens mock-up
(without the Fresnel structure). The flight model underwent electric and vibration
tests at a reduced level [1]. The performance of the Mini-EUSO EM have been ver-
ified at the Physics Department of the University of Turin and at the Astrophysical
Observatory of Turin, in Italy, in February and March 2018. At the Physics Depart-
ment, laboratory tests have been made at the TurLab facility [9] that hosts a rotating
tank used to perform analysis with moving light sources. Outdoor observations have
been made from the roof of the building, pointing the telescope to flashers and lit
buildings. Stars, a few meteor candidates, and a large-scale space debris (a rocket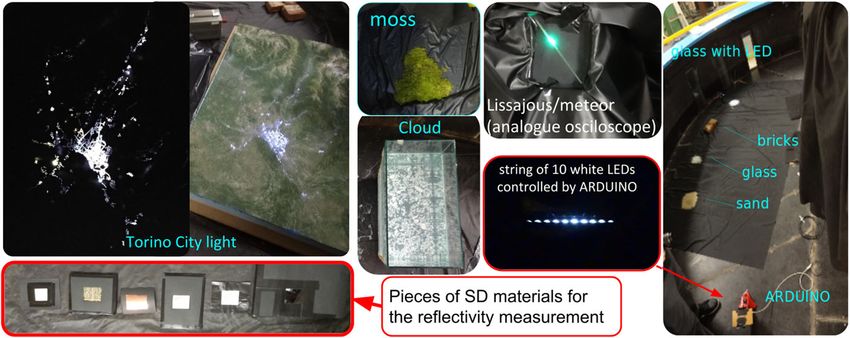
136                                                 Experimental Astronomy (2022) 53:133–158

body) have been observed from the Astrophysical Observatory, where the sky con-
ditions allowed observation of faint sources, as well as artificial lights from nearby
cities. These measurements and related results are presented and discussed in this
paper.

2 Detector setup and data acquisitions

2.1 Mini-EUSO

The Mini-EUSO detector [1] has an optical system composed of two Fresnel lenses
of 25 cm diameter and 20.5 cm focal length, made of Poly(methyl methacrylate)
- PMMA. Photons are focused on a focal surface with 6 × 6 Multi-Anode Photo-
Multiplier Tubes (MAPMTs) [10], with 8 × 8 pixels of 2.88 mm side, for a total of
2304 pixels. The MAPMTs are grouped in 9 Elementary Cells (ECs), made of 2 ×
2 MAPMTs and the front-end electronics. The system of 9 ECs represents the Photo-
Detector Module (PDM). The sensitivity band is the near-UV, thanks to a 2 mm
thick UV band-pass filter made of BG3 material and with anti-reflective coating.
Filters are glued on each single MAPMT, and allow photons in the wavelength range
∼290-430 nm to reach the sensors. Pictures in Fig. 2 show the Mini-EUSO detector
components, with the external Fresnel lens in the panel (a) and the complete focal
surface with 9 ECs, i.e. 36 MAPMTs, in the panel (b). The focal surface and the
optical system let the detector have a square field of view of ∼ 44◦ ×44◦ , allowing for
observations of the Earth with a spatial resolution of ∼6 km projected on the ground.
Each EC consists of 4 MAPMTs with independent EC-Anode board and a common
single high voltage power supply with EC-Dynode distribution board. Signals are
pre-amplified and digitized by one 64-channel ASIC chip (SPACIROC3) [11] per
MAPMT. Gaps present between MAPMTs of the same EC and between different
ECs are required by mechanical fixations and electric insulation.
   The telescope has single-photon counting capability. The data are sampled in Gate
Time Units (GTUs) 2.5 μs long, and saved with three time resolutions, to cover
the different timescales typical for the various phenomena that Mini-EUSO aims to
observe. Namely, D1 GTU refers to the aforementioned GTU (2.5 μs), D2 GTU
refers to 128 × 2.5 μs (320 μs), and D3 GTU corresponds to 128 × 128 × 2.5 μs
(40.96 ms). For each pixel, the counts collected in each single D2 and D3 GTU cor-
respond to the sum of counts collected over the corresponding number of D1 GTUs
(128 for D2 GTUs and 128×128 for D3 GTUs). The D1 and D2 timescale events
have dedicated trigger logic devoted to their detection, L1 and L2 trigger respectively
[12, 13], while a continuous acquisition of the signal integrated over D3 GTUs is
performed. The L1 trigger analyzes data with a time resolution of 1 D1 GTU and
looks for signal excess on a timescale of 20 μs (8 D1 GTUs). This is the typical
timescale of cosmic-ray-like events, also well suitable for the detection of elves and
flashers with timescales of ∼0.01-1 ms [1]. Data integrated over 128 D1 GTUs are
used to determine the background level and, at the same time, they are passed to the
L2 trigger logic, well-suited to capturing atmospheric events such as lightning with
timescales of ∼1-100 ms [1]. Packets of 128 D1 GTUs are stored as D2 data in case
Experimental Astronomy (2022) 53:133–158                                                             137

                             (a)                                          (b)

                             (c)                                          (d)
Fig. 2 (a) Mini-EUSO exterior view, with the front Fresnel lens of 25 cm diameter; (b) its internal focal
surface made of 6 × 6 MAPMTs. (c) Mini-EUSO EM exterior view, with the lens of 2.5 cm diameter; (d)
its internal focal surface made of 2 × 2 MAPMTs. Photos of Mini-EUSO taken from [1]

of L2 triggers. A continuous acquisition over 128 × 128 D1 GTUs is also stored as
D3 data. During the further accumulation of 128 D3 GTUs (5.24 s in total) up to
four events detected with the L1 and L2 triggers can be stored and transferred to the
CPU together with the D3 data, for formatting and storage on the disk. In this way,
a continuous readout is achieved with a resolution of 40.96 ms whilst also recording
interesting events at shorter timescales. Data frames integrated over D3 GTUs are
used to search for meteors, space debris and strange quark matter, as well as for the
mapping of the Earth in the near-UV.

2.2 The Mini-EUSO EM

The Mini-EUSO EM is a detector similar to the Mini-EUSO flight model but with
a plano-convex lens of 2.5 cm diameter and 30 cm focal length as optical system,
and a focal surface corresponding to the central EC of the Mini-EUSO focal surface.
The decision of using a different lens system with respect to Mini-EUSO was made
to avoid the risk of damaging the original Fresnel lenses. Since the main goal of the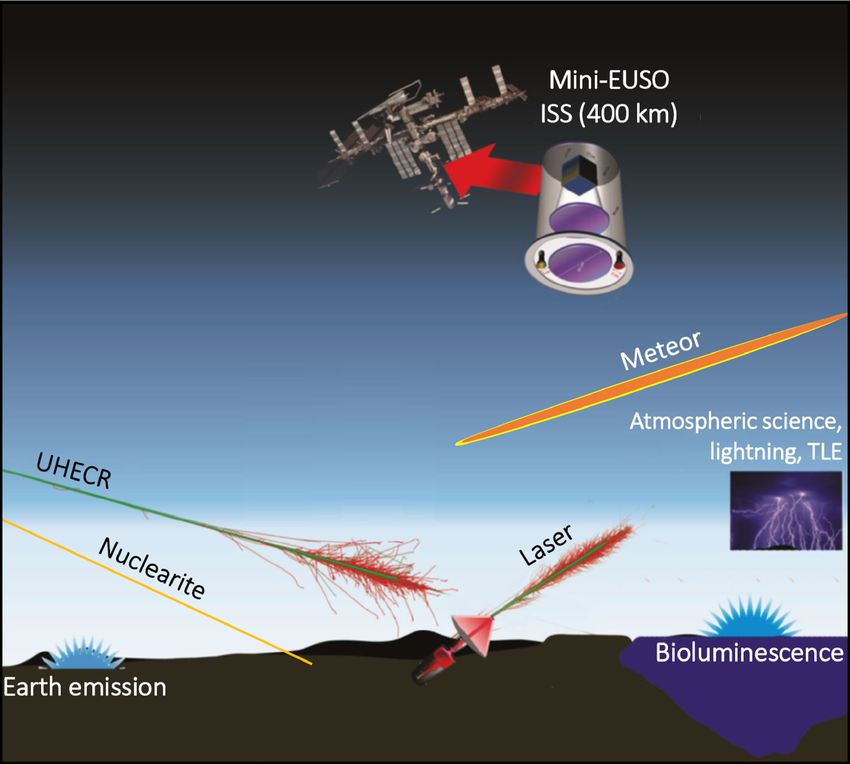
138                                                        Experimental Astronomy (2022) 53:133–158

data acquisitions was to test the performance of the electronics, the loss in terms
of light collection caused negligible consequences. Also the Mini-EUSO EM has a
square field of view but it is ∼ 10◦ × 10◦ , due to the reduced focal surface and the
different optics. In Fig. 2 the exterior of the Mini-EUSO EM is shown in the panel
(c), including the lens at the center of the front side, while its focal surface is shown
in the panel (d), composed only of the central EC.
   The read-out system and the trigger logic used for the Mini-EUSO EM are the
same as those for the flight model. Therefore, data are sampled on three timescales
with resolution of 2.5 μs, 320 μs and 40.96 ms.

2.3 Flight model vs. engineering model of Mini-EUSO

In the previous subsections, technical information on the Mini-EUSO EM and Mini-
EUSO has been reported. Here, a comparison of their performance is provided, based
on the difference between the two setups. Table 1 summarizes the comparison of key
specifications of the engineering and flight models.
   As the lens size of the Mini-EUSO EM is 1/10 of that of Mini-EUSO, the former
is 1/100 times as efficient as the latter (to collect the light). The table contains also
the focal ratio, defined as the ratio of the focal length to the diameter of the aperture,
a parameter usually adopted for optical systems to define their sensitivity.
   The field of view of the Mini-EUSO EM (∼ 10◦ × 10◦ ) was estimated from the
position of stars detected during outdoor measurements. Instead, that of Mini-EUSO
(∼ 44◦ × 44◦ ) was formerly estimated with simulations during the designing phase,
then confirmed with measurements from space using cities as reference. These values
include the gaps between the MAPMTs. The field of view of one pixel is ∼0.6◦
×0.6◦ for the Mini-EUSO EM and ∼ 0.8◦ × 0.8◦ for Mini-EUSO. As the solid angle
seen by one pixel of the Mini-EUSO EM is approximately half that of Mini-EUSO
(0.62 /0.82  0.6), the amount of background light collected by one pixel of the
former detector is about 1/200 the background collected by the latter (considering
both the contribution of the optics and the pixel field of view).

Table 1 Comparison of the key specifications of Mini-EUSO EM and Mini-EUSO

                                    Mini-EUSO EM                           Mini-EUSO

Focal Surface                       2 × 2 MAPMTs                           6 × 6 MAPMTs
                                    16 × 16 = 256 pixels                   48 × 48 = 2304 pixels
Optical system                      1 plano-convex lens                    2 Fresnel lenses
 Lens(-es) diameter                 2.5 cm                                 25 cm
 Focal length                       30 cm                                  20.5 cm
 Focal ratio                        f /12                                  f /0.82
Field of view                       square                                 square
 Total (including gaps)             ∼ 10◦ × 10◦                            ∼ 44◦ × 44◦
 Pixel                              ∼ 0.6◦ × 0.6◦                          ∼ 0.8◦ × 0.8◦
Experimental Astronomy (2022) 53:133–158 139
The signal-to-noise ratio for the sensitivity to point-like sources is proportional
to the amount of signal from the source reaching a pixel and inversely proportional
to the square root of the amount of background, which is determined by the solid
angle seen
√ by a pixel. Therefore, the signal-to-noise ratio of the Mini-EUSO EM is
∼ 0.01/ (0.01/2) 1/7 times that of Mini-EUSO. This estimation is made by
taking into account the same background intensity and the same light source apparent
intensity.
3 Tests at TurLab
3.1 TurLab and the EUSO@TurLab project
TurLab is a facility designed for geo-fluid-dynamics studies. It hosts a tank of 5 m
diameter that has the capability of rotating at speeds ranging from 3 s to 600 s
per rotation. Moreover, as it is located in a very dark environment, the intensity of
background light can be adjusted in a controlled condition.
A series of measurement campaigns devoted to test several prototypes and
pathfinders of the JEM-EUSO program have been performed at TurLab [14, 15].
These telescopes are designed to observe the Earth’s atmosphere from the strato-
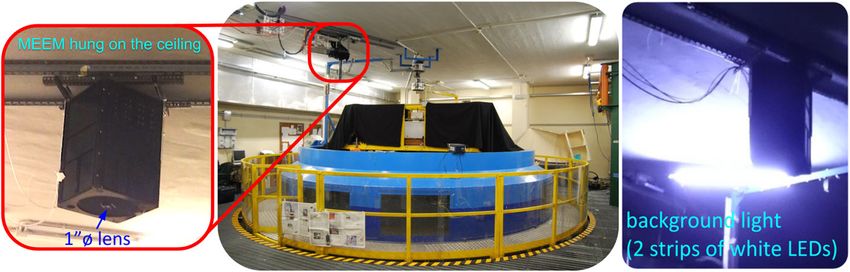
sphere or from space. By hanging the telescope on the ceiling above the rotating tank
(see Fig. 3), a detector in orbit observing the Earth was mimicked. In this environ-
ment, the performance of the electronics and the L1 and L2 trigger logic was tested,
as well as the response to atmospheric phenomena such as meteors and lightning
reproduced in the laboratory.
3.2 The Mini-EUSO EM at TurLab
In February and March 2018, the Mini-EUSO EM was tested at TurLab. After pre-
liminary operation tests at its arrival, it was hung on the ceiling above the TurLab
tank to be tested for its general performance as well as for the data acquisition and
control software [12] and the trigger system [13].
Fig. 3 The TurLab tank setup with the Mini-EUSO EM installed on the ceiling and enlarged inside the
red frame (left). The diffused airglow in the atmosphere was reproduced by two strips of cold-white LEDs
reflected by the ceiling above the tank (right)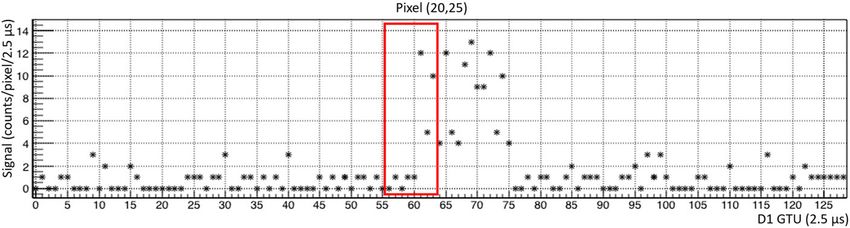
140                                                          Experimental Astronomy (2022) 53:133–158

Fig. 4 Light sources and materials to reproduce phenomena that Mini-EUSO can observe. Reflections of
materials that are often present in space debris (SD) have also been tested

   The setup for the TurLab measurements is shown in Fig. 3. In the central panel
the TurLab tank is shown, and on top of it, the detector to be tested is installed on the
ceiling as shown in the area surrounded by a red frame in the left panel. The pictures
in Fig. 4 show the light sources and materials placed on the floor of the tank to repro-
duce various phenomena that Mini-EUSO is able to observe from space. In Table 2
materials and phenomena reproduced in the laboratory are listed with the correspond-
ing means of emulation. All materials were illuminated by diffused light, emitted by
two strips of cold-white LEDs and reflected by the ceiling above the tank (see Fig. 3
on the right), to reproduce the diffused airglow in the atmosphere at the level of
expected photon counts that Mini-EUSO would observe (∼1 count/pixel/D1 GTU).
   By rotating the tank, it was possible to emulate the Mini-EUSO observation of
the Earth from the ISS orbit. In Fig. 5 the light curve measured by Mini-EUSO EM
during one TurLab tank rotation is shown, with a time resolution of 1 D3 GTU. In

Table 2 List of materials and phenomena reproduced at TurLab with the corresponding means of
emulation

Materials and phenomena                      Means of emulation

Rocks                                        Bricks
Deserts                                      Sand
Glacier ice                                  Smashed glass
Clouds                                       Clusters of particles floating in the water
Forests                                      Moss
Lightning                                    Smashed glass illuminated by blinking LED
City lights                                  LED light through the holes on the map of Turin city
Meteors                                      Lissajous figures generated by an analogue oscilloscope
Cosmic rays                                  Arduino-driven LED strip
Space debris                                 Aluminum foil, copper foil, mirror, white paper,
                                             Kevlar® , electronics board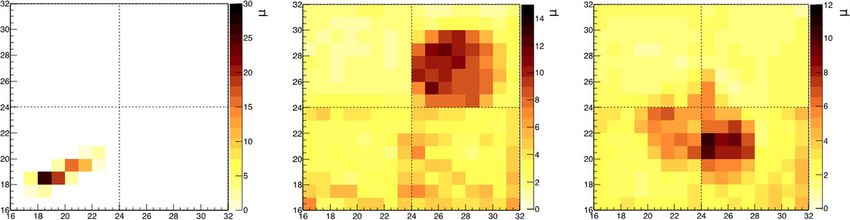
Experimental Astronomy (2022) 53:133–158                                                                  141

Fig. 5 Light curve of D3 data for a whole tank rotation. All the materials in the field of view are recorded
as a continuous “movie”. The “Bridge” signature is due to light reflected by a mechanical structure of the
tank, partially seen although it was covered by black fabrics to hide it, as not of interest in the context of
the measurements. Figure adapted from [16]

the D3 timescale, the light from all the materials in the field of view is recorded
as a continuous “movie”, so the light curve represents the counts collected in each
D3 GTU by the detector while the TurLab tank was rotating below it. The signal is
rescaled to 1 D1 GTU (2.5 μs) as well as in all the plots in this paper.

3.2.1 Tests on the L1 trigger

The L1 trigger allows for the detection of cosmic-ray-like events, reproduced at
TurLab with a strip of LEDs driven by Arduino. The L1 trigger algorithm looks for
signal excess on 8 consecutive D1 GTUs (20 μs). For each pixel, the signal inte-
grated over 128 D1 GTUs (320 μs) is used to determine the average background
level per D1 GTU n̄, and therefore the average background counts integrated over
8 consecutive D1 √GTUs is n̄8 = n̄ ×√8. The trigger threshold is calculated as
Ttrig = n̄8 + m · n̄8 , where the term n̄8 is the standard deviation of the counts
integrated over 8 D1 GTUs, assuming they follow a Poisson distribution, and m
is an integer number that can be used as parameter to define the trigger perfor-
mance, initially set to m = 8. In order to have a trigger, an event has to generate
counts integrated over 8 consecutive D1 GTUs greater than the rounded up thresh-
old. In such a case, a packet of 128 D1 GTUs around the triggered event is saved:
as 64 D1 GTUs are saved before and after the trigger, the D1 GTU at which the
trigger condition is satisfied is the 64th of the packet. The minimum value for the
threshold is set to 15 counts, which corresponds to the threshold of a pixel with
a background of 0.3 counts/pixel/D1 GTU. Some pixels with low efficiency, and
142                                                           Experimental Astronomy (2022) 53:133–158

Fig. 6 Light curve over 128 D1 GTUs of a pixel with very low background,
Experimental Astronomy (2022) 53:133–158                                                               143

3.2.2 Tests on the L2 trigger and D3 continuous data acquisition

At TurLab, also the L2 trigger was tested. Bright events lasting relatively long
such as Lissajous figures produced by an analogue oscilloscope, which can give
similar time profiles to those of transient luminous events, were detected using
the L2 trigger. It also triggered on the mimicked city light, as the light increased
rapidly when it entered the field of view of the detector from inside the tank,
but any other material or light source such as glass dust or the Arduino-driven
LED strip did not generate any trigger, i.e., no fake triggers occurred during this
test.
   Also, as shown in Fig. 5 for the D3 data, a continuous data acquisition was
stored during the measurements, and each illuminated material and light source
can be clearly recognized in the light curve. In Fig. 8 samples of observations
made in the D3 timescale are shown. The panel (a) shows the signal from Lis-
sajous figures of an analogue oscilloscope reproducing a meteor, integrated over
10 D3 GTUs in order to see the whole track in one frame. The panels (b)
and (c) show smashed glass reproducing glacier ice and sand reproducing desert,
respectively.

3.2.3 Measurements for space debris studies

Space debris do not emit light themselves but can be detected if illuminated by sun-
light. Measurements of the reflectivity of materials which usually compose space
debris (shown in the bottom-left of Fig. 4) were performed at TurLab [17]. For these
tests, the Mini-EUSO EM was hung on the ceiling above the tank pointing down-
ward. Different materials such as polished and unpolished aluminum foil, canned
aluminum foil, balled aluminum foil, copper foil, mirror, white paper, a sample of
Kevlar® , and electronics board (all materials that often space debris are composed
of), were placed on the bottom of the tank and illuminated by diffused light with
different intensities. In this way, the relative reflectance of the materials as seen by
the detector was measured. As a preliminary estimation, assuming that the reflec-

Fig. 8 Examples of D3 frames for: (a) Lissajous figures of an analogue oscilloscope (meteor), (b) smashed
glass (glacier ice), and c sand (desert). In panel (a) the signal from Lissajous figures is integrated over
10 D3 GTUs to visualize the moving track in one data frame. Panels (b) and (c) refer to single D3 frames
and include background
144 Experimental Astronomy (2022) 53:133–158
tivity of polished aluminum is about 0.92, the reflectance of the different materials
varying from 0.17 (electronics board) to 0.92 (fixed reference value for the polished
aluminum foil) was measured.
Simulation studies applying a dedicated trigger algorithm indicated the capabil-
ity of a Mini-EUSO-like detector to observe and track space debris. Such detectors
need a shade to prevent direct sunlight reaching the lens without hindering the field
of view, otherwise stray light brings protection-mode to not damage the device. By
using ESAF (EUSO Simulation and Analysis Framework) [18] an estimation of
the minimum sizes and maximum distances of detectable space debris was made
[17]. Furthermore, the number of expected space debris detections was estimated
by using an ESA software called MASTER (Meteoroid and Space debris Terres-
trial Environment Reference) [19], which provides the density of space debris with
parameters such as altitude and inclination. Such a detector was evaluated to have
a potential detection rate of hundreds of space debris per year [17]. An impor-
tant contribution was provided by the detection of a real space debris with the
Mini-EUSO EM during a data acquisition session at the Astrophysical Observa-
tory, discussed in Section 4.3.2. Size and distance of this rocket body have been
rescaled in order to reproduce the detection of space debris with Mini-EUSO-
like detectors. These studies are important to verify the working principle of a
space-based system under development for the detection and remediation of space
debris [5].
4 Measurements in open sky conditions
4.1 Mini-EUSO EM at the Astrophysical Observatory of Turin
The Astrophysical Observatory of Turin, located on a hill at Pino Torinese, about
7 km east of Turin, offers good conditions for the observation of the sky, as city lights
are relatively far away and at lower altitude with respect to the observatory site. More-
over, it hosts one all-sky camera of the Italian network for systematic surveillance of
meteors and atmosphere, PRISMA [20].
The PRISMA network is devoted to the observation of fireballs in the sky, with
the goal of recovering the meteorites surviving the ablation in the atmosphere. On
1 January 2020 at 18:26:53 UTC, eight cameras of the network observed a bolide that
allowed precise estimation of the area where to search for fragments (strewn-field).
On 4 January, the meteorite was recovered in the estimated area. This was the first
meteorite recovered thanks to a fireball network in Italy, and the 20th in the world so
far [21].
The PRISMA cameras observe the sky with a wide wavelength bandwidth peaked
in the visible band and with an angular resolution of ∼ 0.2◦ × 0.2◦ /pixel [22].
They operate with a high frequency of 30 Hz (with 1/30 s exposure time) to fol-
low the development of fireballs properly. Slow events such as planes or satellites
are not recorded, as they are rejected by the trigger algorithm specifically designed
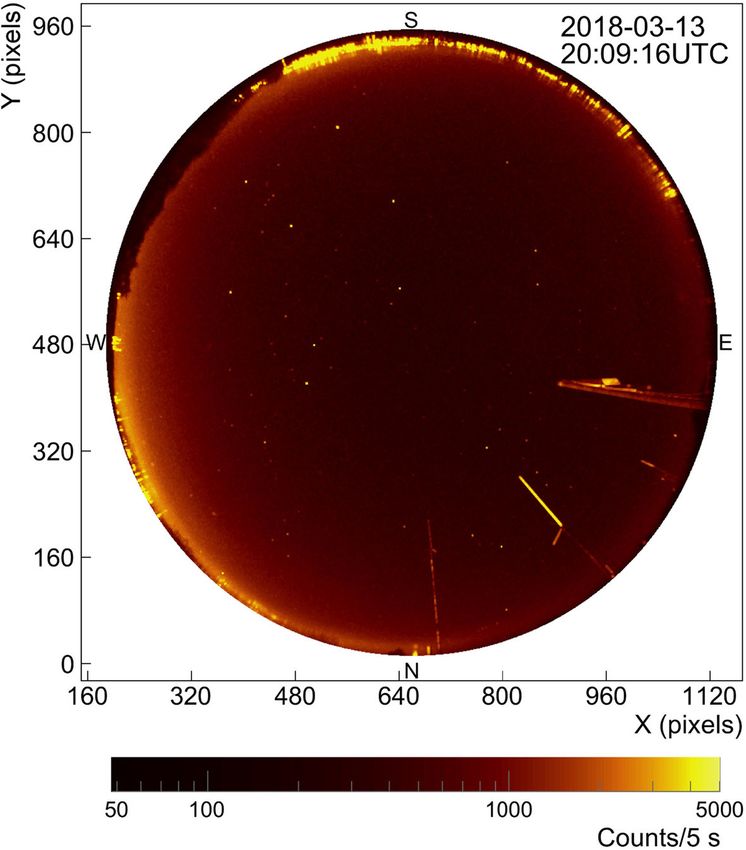
for meteor detection. At this exposure time, stars are not recognizable. Therefore,Experimental Astronomy (2022) 53:133–158 145 additional ancillary images integrated over 5 s are saved every 10 minutes, in order to use star images to derive astrometric and photometric calibration of the instrument [23]. In Fig. 9 one of such all-sky images for the observation of stars is shown. On the edge of the image, bright spots correspond to the nearby urban areas. A comparison of the stars observation with the PRISMA camera and the Mini- EUSO EM was made to understand the relative performance of the two detectors, also in view of possible future simultaneous observations of meteors with the PRISMA cameras from the ground and Mini-EUSO from the ISS. A comparison of the rising signal at dawn time was also performed. In addition, from the same site faint meteors and the rocket body of a telecommunication satellite were observed by the Mini- EUSO EM, but not by the PRISMA camera. Fig. 9 An image taken by the PRISMA camera during the Mini-EUSO EM data acquisition campaign of 13 March 2018. The image is integrated over 5 s for the observation of stars. Near the horizon, bright spots correspond to the nearby urban areas. A flag and antennas present at the PRISMA camera site are seen on the north-east part of the field of view. The scale of this image is modified from the output values to visualize brightnesses of both the night sky and stars
146                                                  Experimental Astronomy (2022) 53:133–158

4.2 Natural sources

4.2.1 Stars and planets

Several stars and the planet Jupiter have been identified in the data taken with the
Mini-EUSO EM from the Astrophysical Observatory by pointing at different zenith
angles during the nights of the data acquisition. By comparing the cataloged posi-
tions of the stars with the observations, the total field of view of the instrument was
estimated as ∼ 10◦ × 10◦ , or ∼ 0.6◦ × 0.6◦ /pixel.
    The simultaneous observations of stars, i.e., with the same atmospheric condition,
allow to compare the observations made with the two detectors. In Fig. 10 the panel
(a) shows the count rates from Jupiter and the stars observed by the Mini-EUSO EM
(red y-axis on the left) and by the PRISMA camera (blue y-axis on the right). The
count rates are shown as a function of the observed U-band and V-band apparent
magnitudes, respectively, with the atmospheric attenuation correction depending on
the zenith angle of the stars. In the panels (b) and (c) some stars of the Orion con-
stellation are shown in a data frame of the Mini-EUSO EM, integrated over 40.96 ms
(1 D3 GTU), and one of the PRISMA camera, integrated over 5 s, respectively. The
former has been mirrored to have the same orientation of the latter. Jupiter, Sirius
and the stars of the Orion constellation were detected at zenith angles > 60◦ , while
Alkaid and the Hercules’ stars were detected close to the zenith. In general the count
rates in logarithmic scale decrease linearly with the apparent magnitude, particularly
for the stars at the zenith. Taking as example the star α Ori (apparent magnitudes in
the catalog: U = +4.38, V= +0.42), the observed magnitudes in the U-band and V-
band have very different values, as it is a red-giant star of the Orion constellation. The
corresponding measured counts are consistent with the expectations. Very bright and
very dim stars represent some outliers. Jupiter and Sirius seen by PRISMA present
fewer counts than what is expected from the linear trend due to saturation of the
sensor. 30 Her (U = +7.70, V = +5.01) was not detected by the Mini-EUSO EM
because of its low emission in the U-band, while it is brighter than expected from the
observed V-magnitude. 32 Ori (U = +3.51, V = +4.2) was invisible to PRISMA at
the time of the Mini-EUSO EM observation due to its high zenith angle and therefore
its high observed V-magnitude due to the atmospheric absorption. υ Her (U = +4.33,
V = +4.71) was not recognizable in the PRISMA frame even if the star was close
to the zenith, because of its sensitivity limit. Indeed, as PRISMA is optimized for the
detection of bright meteors, the limit for the apparent magnitude for the 5 s integra-
tion frames is about +4.5. In both the Mini-EUSO EM and the PRISMA camera the
stellar signal can be shared by adjacent pixels, and as a consequence the signal per
pixel can be reduced (or partially lost in the case of the Mini-EUSO EM, where the
pixels are less sensitive close to their edges) and stars might not be distinguishable
from the night sky background, particularly for dim stars. Moreover, in the analysis
the U-band and the V-band apparent magnitudes were considered for the comparison,
but both the devices are sensitive to a wider range of wavelengths than the band-
widths for which the apparent magnitudes are defined. In general, and limited to the
Experimental Astronomy (2022) 53:133–158 147 Fig. 10 (a) Count rates from stars and Jupiter for the Mini-EUSO EM and for the PRISMA camera, with respect to the observed U and V apparent magnitudes, respectively. (b) Some of the stars of the Orion constellation in a D3 frame of the Mini-EUSO EM integrated over 40.96 ms and (c) the same stars in a frame of the PRISMA camera integrated over 5 s, where the 32-Ori star is not recognizable. Image (b) has been mirrored to have the same orientation of image (c) sample of observed stars, the Mini-EUSO EM was sensitive to apparent magnitudes from astronomical catalog up to about +4.4 and observed apparent magnitudes up to about +5.6. The limiting magnitude would increase using exposures longer than 1 D3 GTU.
148                                               Experimental Astronomy (2022) 53:133–158

4.2.2 Meteors

The analysis of stars measured by both the Mini-EUSO EM and the PRISMA cam-
era was useful in the case of simultaneous observation of meteors by Mini-EUSO
from space and by the PRISMA cameras or other meteor observatories on ground
that might operate in a similar manner. Indeed, usually meteors are observed in the
visible band, and the observation in the UV band gives additional information about
the development of meteors in the atmosphere. Moreover, observations from very
different viewing angles during their development could improve the understanding
of these phenomena. More details on the observation of meteors with Mini-EUSO
are available in [24].
    Four meteor candidate events have been detected while the Mini-EUSO EM was
pointing in the zenith direction at the Astrophysical Observatory. From the com-
parison with the brightness of stars, they had apparent magnitudes of about +4.
There is no counterpart of these events in the data of the PRISMA camera, as
it is not sensitive to such faint meteors. Indeed, its limit for the apparent magni-
tude is about −1, or even about 0 with the best sky conditions. As the meteor
candidates developed near the zenith, the horizontal component of their speed was
estimated by supposing that the development of meteors starts at ∼100 km altitude.
It was estimated as tens of kilometers per second, consistent with the typical meteor
speeds.
    In Fig. 11 one of the meteor candidates is shown, moving through four consecu-
tive D3 frames in the top MAPMTs along 8 pixels, from right to left. The duration
of this event was ∼160 ms (∼20 ms/pixel) and the estimated horizontal speed was
∼50 km/s.

4.2.3 Night sky brightness

A measurement of the night sky brightness was performed over until dawn on
14 March 2018. The increase of the brightness was clearly detected by both the Mini-
EUSO EM, while it was pointing to the zenith, and the PRISMA camera. In Fig. 12
the count rates of the four MAPMTs of the Mini-EUSO EM are shown. The back-
ground brightness obtained from the PRISMA data with an aperture of 15◦ around
the zenith is compared by normalizing 19 mag/arcsec2 to 0.05 counts/pixel/2.5 μs of
the Mini-EUSO EM.
   At the Astrophysical Observatory, the night sky is polluted by the urban light
in the Turin area. This brightness is consistent with the zenith sky brightness of
19.3 mag/arcsec2 provided in [25] that showed the contribution of artificial light
sources being ∼11 times of the intrinsic sky brightness. The corresponding values in
the middle of the ocean are greater than 22 mag/arcsec2 , namely more than 10 times
darker than that observed by this work. In general, the areas dominated by artifi-
cial light sources are not suitable for the observation of EASs from space and the
range of the observable energy of UHECRs is limited to be high. The fraction of
such areas below the ISS was estimated to ∼10% [2] based on the DMSP satellite
data [26].
Experimental Astronomy (2022) 53:133–158 149
(a) (b)
(c) (d)
Fig. 11 Example of a meteor candidate shown in four consecutive D3 frames, each integrated over
40.96 ms. Figure adapted from [27]
The astronomical twilight started at 04:05 UTC prior to the sunrise at 05:45 UTC.
The count rate of Mini-EUSO EM in the UV band increased first, followed by
the count rate of the PRISMA camera in the visible band. This can be explained
by taking into account that UV photons in the atmosphere are more scattered
than the visible ones. Therefore, with the Sun approaching the horizon before sun-
rise, a higher flux of scattered light is observed at the zenith in the UV band
rather than in the visible band. The Moon with 11% illumination rose above the
horizon at 04:20 UTC, but its effect on the scattered light near the zenith was
marginal.
On the light curve of MAPMT 3, higher count rates are seen between 01:31 and
02:02 UTC when the star Alkaid, with the U-band apparent magnitude of about +1,
crossed the field of view of this MAPMT over an angle of ∼ 5◦ , equivalent to ∼9 pix-
els length. This corresponds to a ∼ 0.2◦ /min angular speed, which is consistent with
the diurnal motion for stars culminating near the zenith at the latitude of the Astro-
physical Observatory. In the count rate due to Alkaid, peaks correspond to the star
signal hitting the center of the pixels and the valleys correspond to the edges between
adjacent pixels, where the sensors are less sensitive.150 Experimental Astronomy (2022) 53:133–158
Fig. 12 Night sky count rate over time of the four MAPMTs of the Mini-EUSO EM (scale on the left)
and of the PRISMA camera (scale on the right). The measurement made with the PRISMA camera is
normalized at 19 mag/arcsec2 to 0.05 counts/pixel/2.5 μs of the Mini-EUSO EM
4.3 Artificial sources
4.3.1 Lit signs, flashes and city light
Artificial lights from the nearby urban area were also used to test the detector. From
the roof of the Physics Department, lit signs and warning lights on skyscrapers and
towers located in the Turin area (at 2-4 km distance) were detected, as well as lights
from Trofarello and Chieri towns from the Astrophysical Observatory.
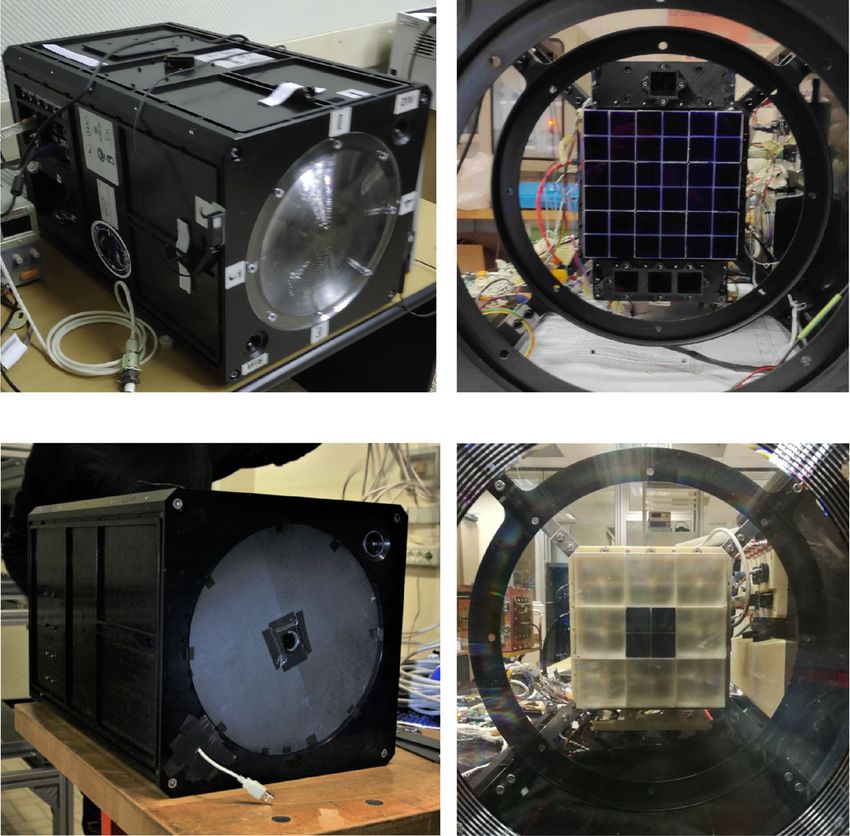
In Fig. 13 a picture of the “Mole Antonelliana” tower is shown in the panel (a),
together with the light curve of one pixel with time bins of 320 μs (D2 timescale)
with the signal from the tower in the panel (b). The light curve shows an alternating
signal with a period of ∼35 time bins, corresponding to a frequency of ∼100 Hz. The
frequency of the electrical grid is 50 Hz in Italy. Artificial light sources connected
to an alternating current fluctuate in different manners depending on the lighting
technology. Incandescent bulbs fluctuate at the frequency of the electrical supply
(50 Hz), while fluorescent lighting fluctuate twice over each voltage cycle (100 Hz).
Therefore, the measured modulation is consistent with the frequency of fluorescent
lighting connected to the electrical grid. In the panel (c) a picture of the “Intesa
Sanpaolo” skyscraper with constant emission and white/blue blinking warning lights
is shown, together with light curves on two timescales. The light curve with time bins
of 320 μs in the panel (d) shows an alternating trend with a frequency of ∼100 Hz,
like in the panel (b). The light curve with time bins of 40.96 ms in the panel (e) shows
high peaks due to flashes that are well above the baseline, pulsating with a frequencyExperimental Astronomy (2022) 53:133–158 151 Fig. 13 (a) Picture of the “Mole Antonelliana” tower; (b) light curve with the signal from the tower, with time bins of 320 μs (D2 GTUs), showing the alternating signal with frequency of ∼100 Hz. (c) Picture of the “Intesa Sanpaolo” skyscraper; (d) light curve with the signal from the skyscraper as same as panel (b), and (e) with time bins of 40.96 ms (D3 GTUs), showing flashes from the warning lights with frequency of ∼0.7 Hz. The signals with a frequency of ∼100 Hz are consistent with the 50 Hz frequency of the electrical grid. The measurements pointing the detector to the “Mole Antonelliana” tower and the “Intesa Sanpaolo” skyscraper were made at different times. Figure adapted from [27]
152                                                 Experimental Astronomy (2022) 53:133–158

of ∼0.7 Hz. The ∼100 Hz frequency pattern is present on the baseline and on the
peaks as well. Other buildings with flashers have similar pulsating light curves, and
also generic light from cities have light curves with such an alternating profile.
   The alternating pattern in light curves for the D2 timescale is an important feature
of the signal that allows to discriminate between natural and anthropogenic sources.
Indeed, with the first observations of the Earth with Mini-EUSO from space, the
modulation of the light current of 50 Hz or 60 Hz was recognized, depending on the
observed area of the globe. It also detected flashes. These observations are described
in more details in Section 5.

4.3.2 Rocket of a telecommunication satellite and airplane

During the observations at the Astrophysical Observatory, while pointing to the
zenith, the orbiting rocket body “Meteor 1-31 Rocket” (NORAD-ID 12586) was
detected on 14 March 2018 at 04:10:58 UTC. This device was used for the launch of
a telecommunication satellite in 1981 and was left in orbit as a 2.6 m×2.8 m large-
size debris orbiting at an average height of ∼550 km and a velocity of ∼7.5 km/s.
The satellite was identified with the Systems Tool Kit (STK) platform [28]. The sig-
nal from the satellite is shown in Fig. 14 as a bright pixel moving from top-left to
bottom-right in the EC, in four D3 frames integrated over 40.96 ms and sampled
every ∼4 s. The event lasted for 400 D3 GTUs (∼16 s). The satellite crossed a length
equivalent to ∼22 pixels in the inclined direction, including also the gaps between
the MAPMTs (∼1.4 pixels/s). By considering these parameters, the field of view of
one pixel of the Mini-EUSO EM, and the average height of the rocket body, a speed
of ∼7.7 km/s was estimated, consistent with the cataloged one.
   This measurement can be translated to an equivalent observation performed by a
Mini-EUSO-like detector from the ISS. In the case such a detector, with the field
of view of one pixel of ∼ 0.8◦ × 0.8◦ , would observe an event with a speed of
∼1.4 pixels/s, the observation could correspond to a space debris with an apparent
speed of ∼1 km/s at the distance of 50 km. The apparent speed should be corrected by
the ISS speed. More detailed simulation studies and rescaling of the size and distance
of this satellite have been done in order to reproduce the detection of space debris
with a Mini-EUSO-like detector on board the ISS [17].
   In addition, flashes of the airplane operating the flight LH1902 from Munich
to Turin was detected, from the same site, on 12 March 2018 at around 21:54-
21:55 UTC (about 6 minutes before landing). In such time interval, it passed ∼4-6 km
away at an altitude of ∼800-700 m above the observation site at 610 m a.s.l., with a
speed of ∼430 km/h. The flight was identified via the Flightradar24 tracking service
[29] that provides real-time information about aircrafts around the world. The air-
plane observation is detailed in Fig. 15 as the average count rates of four MAPMTs
on the top and that of the whole EC taking into account the different efficiencies
of the MAPMTs, according to rates measured on 14 March at ∼02:30 UTC, as in
Fig. 12. The frequency of the apparent blinking flashes recorded by the EC changed
over the time from ∼1.3 to ∼2.6 flashes per second due to the turning of the airplane
while approaching the runway. The Mini-EUSO EM was manually pointed towards
Experimental Astronomy (2022) 53:133–158                                                                153

                      (a)                                                     (b)

                      (c)                                                     (d)
Fig. 14 Signal from the rocket “Meteor 1-31 Rocket” in four D3 frames integrated over 40.96 ms and
sampled every ∼4 s. The rocket is recognizable as a bright pixel crossing the field of view from top-left to
bottom-right

the airplane. Thus, transition of significant signals among MAPMTs does not rep-
resent the motion of the airplane. All MAPMTs show synchronous increased count
rates due to the airplane flashers. This is considered due to the light from the flasher
scattered in the hazy sky.

5 Comparing Mini-EUSO EM tests with preliminary Mini-EUSO data

As discussed in Section 4.3.1, data acquisitions of artificial light from lit buildings
and warning flashers with the Mini-EUSO EM demonstrated the capability of this
type of system to detect flashes with frequency ∼0.7 Hz (seen in the D3 data, i.e.,
with frames integrated over 40.96 ms) and even the modulation of the alternating
current, which is 50 Hz in Italy (seen in the D2 data, i.e., with frames integrated over
320 μs) - see Fig. 13. Mini-EUSO from space detected the electrical grid modulation
of 50 Hz or 60 Hz, depending on the observed area of the globe. Such a modulation
is clearer in small towns and villages that are all connected to the same transformer
and therefore emit light in phase. However, it is more difficult to see the modulation
154 Experimental Astronomy (2022) 53:133–158
Fig. 15 Light curve of the airplane of the flight LH1902 detected on 12 March 2018 at around ∼21:54-
21:55 UTC. In the top panel, average count rates of four separate MAPMTs are shown. In the bottom
panel, the average of the whole EC is shown, taking into account different efficiencies of the MAPMTs
in larger cities, where different areas are connected to different transformers, varying
phase. Mini-EUSO also observed flashes from several places on the Earth. Their
origin is still under investigation, but they seem to be compatible with warning lights
mounted on buildings or towers (usually with xenon, with portion of the emission
spectrum in the near-UV band). They can have different brightness and duration [6],
usually lasting a few hundred microseconds and being observed several times as they
cross the field of view of the detector.
Meteors were also observed by both detectors. The observation of meteors made
with the Mini-EUSO EM was discussed in Section 4.2.2. A definitive confirmation
that the observed objects were meteors cannot be obtained because there was no
counterpart in the PRISMA camera data, being too faint for the PRISMA detectabil-
ity. However, their estimated horizontal speed was consistent with the typical speeds
of meteors. Moreover, the spatial and temporal development of the meteors observed
by Mini-EUSO in orbit, after the necessary rescaling for the distance between detec-
tor and source, seem to be compatible with the properties of the objects observed
from the ground by the Mini-EUSO EM. However, while the apparent magnitude of
the meteors observed with the prototype could be estimated thanks to the comparison
with the U-band apparent magnitude of field stars, several methods are under study
for the estimation of the apparent magnitude of meteors detected by Mini-EUSO
from the ISS. Taking as an example the meteor in Fig. 11, it is possible to evalu-
ate how Mini-EUSO would have detected the same event from the ISS. AssumingExperimental Astronomy (2022) 53:133–158 155 that meteors start their development at 100 km altitude, the area observed by a pixel of the Mini-EUSO EM at this altitude is ∼1.0 km×1.0 km. A pixel of Mini-EUSO on the ISS would observe an area of 4.2 km×4.2 km at the same altitude (300 km below it). As the meteor track observed by the Mini-EUSO EM appears on 8 pixels for ∼160 ms (∼20 ms/pixel), its projection on the horizontal plane at 100 km alti- tude is ∼8 km long. Therefore, Mini-EUSO would have seen the same meteor event in 2 pixels for ∼80 ms/pixel. If an event with the same observed characteristics of that in Fig. 11, i.e., crossing 8 pixels in ∼160 ms, would be observed by Mini-EUSO from the ISS, the horizon- tal speed would be translated to ∼210 km/s for a source at ∼100 km altitude. Such a high speed would be compatible with the speed of interstellar meteors, with ori- gin outside the Solar System, that well exceed the escape velocity from the Sun. Such an event could be also interpreted as a nuclearite having a horizontal speed of ∼280 km/s near the sea level, i.e., ∼400 km away from the ISS. For the Mini-EUSO- like detectors in the future, this could also be a space debris passing ∼10 km away at the apparent speed of ∼7 km/s. The angular speed and the light intensity would help to discriminate between possible object types. 6 Conclusions The observations made with the Mini-EUSO EM offered an opportunity to test the prototype of the Mini-EUSO detector before it was launched and installed on the ISS in 2019. The tests described in this paper provided a large variety of data on different timescales, by which the detector performance was studied. Tests at TurLab demonstrated that some improvements for the L1 trigger had to be performed, while the L2 trigger algorithm and the continuous D3 data acquisi- tion were proved to work as expected. With a new system, which is basically a copy of the Mini-EUSO EM detector regarding the data acquisition and the processing, further studies were performed afterwards. A new threshold has been applied to the L1 trigger, that made it more robust and stronger against the non-standard back- ground conditions (much lower or higher than ∼1 count/pixel/D1 GTU) and was applied to the firmware of Mini-EUSO. Moreover, tests to estimate the reflectance of materials that compose space debris were performed, together with simulation anal- yses to study the capability of Mini-EUSO-like instruments to detect and track space debris from space. Outdoor data acquisitions allowed to detect several natural and artificial light sources. Stars with observed apparent magnitude up to about +5.6, already corrected for the atmospheric absorption, permitted a comparison between the performance of the Mini-EUSO EM and the PRISMA camera of the Astrophysical Observa- tory of Turin. The possible detection of meteors showed that the telescope is able to detect faint meteors with speeds of the order of tens of kilometers per sec- ond. The analysis of the night sky brightness at the zenith before sunrise showed that the signal in the UV band increased earlier than in the visible band, consis- tent with the fact that the UV photons are more scattered than the visible ones. Observations of artificial light from buildings showed the capability of detecting
156                                                              Experimental Astronomy (2022) 53:133–158

flashes from warning lights with frequencies of ∼0.7 Hz and the modulation of the
electrical grid at 50 Hz. Finally, the detection of a known space debris gave infor-
mation to rescale the size and the distance to emulate the detection of space debris
from space.
   Observations of similar sources have been made by both the Mini-EUSO EM dur-
ing the outdoor tests and Mini-EUSO from the ISS. This is the case for meteors,
flashes, and the modulation of the alternating signal from the electrical grid.
   The experience acquired with the engineering model before the Mini-EUSO
launch allowed to predict some of the observations that can be made from space and
to understand how to interpret them, for example using the modulation of the cur-
rent to distinguish between artificial and natural light (such as bioluminescence). The
results and studies discussed in this paper are important for the analysis and the oper-
ation of the Mini-EUSO telescope. Mini-EUSO already confirmed some expectations
raised during the tests of the engineering model.

Acknowledgements The authors acknowledge all members of the JEM-EUSO Collaboration, especially
the Mini-EUSO team. This work was supported by State Space Corporation ROSCOSMOS, by the
Italian Space Agency through the ASI INFN agreement n. 2017-8-H.0 and contract n. 2016-1-U.0, by
Basic Science Interdisciplinary Research Projects of RIKEN and JSPS KAKENHI grant (JP17H02905,
JP16H02426 and JP16H16737), by the Italian Ministry of Foreign Affairs and International Cooperation,
by the French space agency CNES, by the National Science Centre in Poland, grant 2017/27/B/ST9/02162
and grant 2020/37/B/ST9/01821. PRISMA was funded by 2016/0476 and 2019/0672 Research and Educa-
tion grants from Fondazione Cassa di Risparmio di Torino and by a 2016 grant from Fondazione Agostino
De Mari (Savona). The authors from the University of Turin acknowledge support from Compagnia di San
Paolo within the project “ex-post-2018”.

Funding Open access funding provided by Università degli Studi di Torino within the CRUI-CARE
Agreement.

Open Access This article is licensed under a Creative Commons Attribution 4.0 International License,
which permits use, sharing, adaptation, distribution and reproduction in any medium or format, as long as
you give appropriate credit to the original author(s) and the source, provide a link to the Creative Commons
licence, and indicate if changes were made. The images or other third party material in this article are
included in the article’s Creative Commons licence, unless indicated otherwise in a credit line to the
material. If material is not included in the article’s Creative Commons licence and your intended use is not
permitted by statutory regulation or exceeds the permitted use, you will need to obtain permission directly
from the copyright holder. To view a copy of this licence, visit http://creativecommons.org/licenses/by/4.0/.

References

 1. Bacholle, S. et al.: Mini-EUSO mission to study Earth UV emissions on board the ISS. Astrophys. J.
    Suppl. S. 2, v.253 (2021)
 2. Adams, J.H. Jr. et al., (JEM-EUSO Coll.): JEM-EUSO observational technique and exposure. Exp.
    Astron. 40, 117–134 (2015)
 3. Adams, J.H.Jr. et al.: JEM-EUSO: Meteor And nuclearite observations. Exp. Astron. 40, 253–279
    (2015)
 4. Adams, J.H. et al.: The Jem-Euso instrument. Exp. Astron. 40, 19–44 (2015)
 5. Ebisuzaki, T. et al.: Demonstration designs for the remediation of space debris from the International
    Space Station. Acta Astronaut. 112, 102–113 (2015)
 6. Adams, J.H. et al.: Calibration for extensive air showers observed during the JEM-EUSO mission.
    Adv. Space Res. 53, 1506–1514 (2014)
Experimental Astronomy (2022) 53:133–158 157
7. Abdellaoui, G. et al.: First observations of speed of light tracks by a fluorescence detector looking
down on the atmosphere. J. Instrum. 13, P05023 (2018)
8. Kungel, V. et al., (JEM-EUSO Coll.): Laser test with Mini-EUSO. Proceedings of 36th International
Cosmic Ray Conference PoS(ICRC2019)325 (2019)
9. TurLab. http://www.turlab.ph.unito.it/
10. Prieto-Alfonso, H. et al., (JEM-EUSO Coll.): Multi anode photomultiplier tube reliability assessment
for the JEM-EUSO space mission. Proceedings of 33rd International Cosmic Ray Conference (2013)
11. Blin-Bondil, S. et al.: SPACIROC3: A Front-End Readout ASIC For JEM-EUSO cosmic ray obser-
vatory. Proceedings of Technology and Instrumentation in Particle Physics 2014 PoS(TIPP2014)172
(2014)
12. Capel, F., et al.: Mini-EUSO (Extreme Universe Space Observatory) data acquisition and control
software. JATIS, v.5(4), 044009 (2019)
13. Belov, A. et al.: The integration and testing of the Mini-EUSO multi-level trigger system. Adv. Space
Res. 62, 2966–2976 (2018)
14. Miyamoto, H. et al., (JEM-EUSO Coll.): The EUSO@Turlab Project. Proceedings of the XXV
European Cosmic Ray Symposium (2016); arXiv:1701.07708
15. Suino, G. et al., (JEM-EUSO Coll.): The EUSO@Turlab Project: Results from Phase II. Proceedings
of 35th International Cosmic Ray Conference PoS(ICRC2017)422 (2017)
16. Miyamoto, H. et al., (JEM-EUSO Coll.): The EUSO@Turlab: Test of Mini-EUSO Engineering
Model, Proceedings of 36th International Cosmic Ray Conference PoS(ICRC2019)194 (2019)
17. Miyamoto, H. et al., (JEM-EUSO Coll.): Space debris detection and tracking with the techniques of
cosmic ray physics. Proceedings of 36th International Cosmic Ray Conference PoS(ICRC2019)253
(2019)
18. Fenu, F. et al., (JEM-EUSO Coll.): Simulations for the JEM-EUSO program with ESAF. Proceedings
of 36th International Cosmic Ray Conference PoS(ICRC2019)252 (2019)
19. MASTER ESA’s software to assess the debris or meteoroid flux imparted on a spacecraft on an
arbitrary Earth’s orbit. https://sdup.esoc.esa.int/
20. Gardiol, D. et al.: News from the Italian PRISMA fireball network. Proceedings of the 37th
International Meteor Conference, pp. 81–86 (2019)
21. Gardiol, D. et al.: Cavezzo, the first Italian meteorite recovered by the PRISMA fireball network.
Orbit, trajectory, and strewn-field. Submitted to Mon. Not. R. Astron. Soc. 501, 1215–1227 (2021)
22. Barghini, D. et al.: Improving astrometry and photometry reduction for PRISMA all-sky cameras.
Proceedings of the 37th International Meteor Conference, pp. 41–45 (2019)
23. Barghini, D. et al.: Astrometric calibration for all-sky cameras revisited. Astron. Astrophys. 626, A105
(2019)
24. Abdellaoui, G. et al.: Meteor studies in the framework of the JEM-EUSO program. Planet. Space Sci.
143, 245–255 (2017)
25. Falchie, F., et al.: Supplement to: The New World Atlas of Artificial Night Sky Brightness. V. 1.1. GFZ
Data Services. The quoted value was given through the interface on https://www.lightpollutionmap.
info/ (2016)
26. NOAA National Center for Environmental Information, Defense Meteorological Satellite Pro-
gram (DMSP). https://ngdc.noaa.gov/eog/dmsp.html
27. Bisconti, F. et al., (JEM-EUSO Coll.): Mini-EUSO engineering model: tests in open-sky condition.
Proceedings of 36th International Cosmic Ray Conference PoS(ICRC2019)198 (2019)
28. Analytical Graphics, Inc. Systems Tool Kit (STK). https://www.agi.com/products/stk
29. Flightradar24. https://www.flightradar24.com/
Publisher’s note Springer Nature remains neutral with regard to jurisdictional claims in published
maps and institutional affiliations.158 Experimental Astronomy (2022) 53:133–158
Affiliations
F. Bisconti1,2 · H. Miyamoto1,2 · D. Barghini1,2,3 · M. Battisti1,2 · A. Belov4 ·
M. E. Bertaina1,2 · S. Blin-Bondil5,15 · G. Cambiè6,7 · F. Capel8,9 ·
M. Casolino6,7,10 · A. Cellino2,3 · L. Conti6,11 · G. Contino12 · G. Cotto1,2 ·
T. Ebisuzaki10 · F. Fenu1,2 · C. Fornaro11 · A. Franceschi13 · D. Gardiol3 ·
A. Haungs14 · P. Klimov4 · M. Manfrin1,2 · L. Marcelli6 · M. Mignone2 ·
T. Napolitano13 · E. Parizot15 · P. Picozza6,7 · L. W. Piotrowski16,10 ·
G. Prévôt15 · E. Reali6,7 · M. Ricci13 · K. Shinozaki1,17 · F. Simioli11 · G. Suino1,2 ·
J. Szabelski17
H. Miyamoto
hiroko.miyamoto@to.infn.it
1 Department of Physics, University of Turin, Turin, Italy
2 Section of Turin, National Institute for Nuclear Physics, Turin, Italy
3 Astrophysical Observatory of Turin, National Institute for Astrophysics, Turin, Italy
4 Skobeltsyn Institute of Nuclear Physics, Lomonosov Moscow State University, Moscow, Russia
5 OMEGA, Ecole Polytechnique, Palaiseau, France
6 Section of Roma Tor Vergata, National Institute for Nuclear Physics, Rome, Italy
7 Department of Physics, University of Roma Tor Vergata, Rome, Italy
8 Technical University of Munich, Munich, Germany
9 KTH Royal Institute of Technology, Stockholm, Sweden
10 RIKEN, Wako, Japan
11 International Telematic University Uninettuno, Rome, Italy
12 Institute of Space Astrophysics and Cosmic Physics, National Institute for Astrophysics,
Palermo, Italy
13 Frascati National Laboratory, National Institute for Nuclear Physics, Rome, Italy
14 Institute for Astroparticle Physics, Karlsruhe Institute of Technology, Karlsruhe, Germany
15 Université de Paris, CNRS, Astroparticule et Cosmologie, F-75013 Paris, France
16 University of Warsaw, Warsaw, Poland
17 National Centre for Nuclear Research, Lodz, PolandYou can also read