Pre-deliquescent water uptake in deposited nanoparticles observed with in situ ambient pressure X-ray photoelectron spectroscopy - Recent
←
→
Page content transcription
If your browser does not render page correctly, please read the page content below

Atmos. Chem. Phys., 21, 4709–4727, 2021
https://doi.org/10.5194/acp-21-4709-2021
© Author(s) 2021. This work is distributed under
the Creative Commons Attribution 4.0 License.

Pre-deliquescent water uptake in deposited nanoparticles observed
with in situ ambient pressure X-ray photoelectron spectroscopy
Jack J. Lin1 , Kamal Raj R1,4 , Stella Wang2 , Esko Kokkonen3 , Mikko-Heikki Mikkelä3 , Samuli Urpelainen1 , and
Nønne L. Prisle1,4
1 Nano and Molecular Systems Research Unit, University of Oulu, P.O. Box 3000, 90014 Oulu, Finland
2 Division of Physics, Mathematics, and Astronomy, California Institute of Technology, Pasadena, California, 91125, USA
3 MAX IV Laboratory, Lund University, Box 118, 22100 Lund, Sweden
4 Center for Atmospheric Research, University of Oulu, P.O. Box 4500, 90014 Oulu, Finland

Correspondence: Nønne L. Prisle (nonne.prisle@oulu.fi) and Samuli Urpelainen (samuli.urpelainen@oulu.fi)

Received: 6 April 2020 – Discussion started: 29 April 2020
Revised: 1 February 2021 – Accepted: 3 February 2021 – Published: 26 March 2021

Abstract. We study the adsorption of water onto deposited       ticle is a function of its intrinsic hygroscopicity and the am-
inorganic sodium chloride and organic malonic acid and su-      bient relative humidity (RH). Liquid water comprises a sig-
crose nanoparticles at ambient water pressures correspond-      nificant fraction of the global aerosol mass, with field mea-
ing to relative humidities (RH) from 0 % to 16 %. To obtain     surements documenting the global presence of the metastable
information about water adsorption at conditions which are      aerosol phase state (Rood et al., 1989; Nguyen et al., 2016).
not accessible with typical aerosol instrumentation, we use     Condensed water in the atmosphere critically influences both
surface-sensitive ambient pressure X-ray photoelectron spec-    direct and indirect climate effects of aerosols, governed by
troscopy (APXPS), which has a detection sensitivity starting    aerosol growth and light scattering and via the activation of
at parts per thousand. Our results show that water is already   aerosol particles into cloud droplets (Kreidenweis and Asa-
adsorbed on sodium chloride particles at RH well below del-     Awuku, 2014).
iquescence and that the chemical environment on the particle       The surfaces of aerosol particles and droplets are dis-
surface is changing with increasing humidity. While the su-     tinct physical and chemical environments compared to their
crose particles exhibit only very modest changes on the sur-    associated bulk phases. Reaction rates in micrometer-scale
face at these relative humidities, the chemical composition     droplets have been measured (Jacobs et al., 2017; Marsh
and environment of malonic acid particle surfaces is clearly    et al., 2019; Zhang et al., 2021) and modeled (Benjamin,
affected. Our observations indicate that water uptake by in-    2019; Mallick and Kumar, 2020) to be higher than those
organic and organic aerosol particles could already have an     in bulk water, with some reactions even proceeding sponta-
impact on atmospheric chemistry at low relative humidities.     neously (Lee et al., 2019). For cloud and fog systems where
We also establish the APXPS technique as a viable tool for      the interfacial region makes up a significant fraction of the
studying chemical changes on the surfaces of atmospheri-        condensed aqueous phase, the reaction rate at the surface
cally relevant aerosol particles which are not detected with    can be the rate-limiting step in multi-phase OH oxidation in-
typical online mass- and volume-based methods.                  volving surface-active organic species such as pinonic acid
                                                                (Huang et al., 2018). Interfacial water molecules can promote
                                                                reactions between organic acids and SO3 , which are distinct
                                                                from those that occur in the gas phase and important for het-
1   Introduction                                                erogeneous formation of H2 SO4 and subsequent new parti-
                                                                cle formation (Zhong et al., 2019; Lv and Sun, 2020). The
The interaction between atmospheric particulate matter and      bulk–surface partitioning of saccharide molecules in aque-
water is one of the most important processes in Earth’s atmo-   ous solution affects their ability to be oxidized by OH (Fan
sphere. The amount of water associated with an aerosol par-

Published by Copernicus Publications on behalf of the European Geosciences Union.
4710                                                                                  J. J. Lin et al.: Deposited particles XPS

et al., 2019). The presence of surface-enriched nonanoic acid      Tang et al., 2019). A drawback of many of the otherwise
also increases the surface concentration of Fe(III) in aqueous     highly valuable traditional aerosol techniques, such as the
mixtures which mediates enhanced photochemical release of          H-TDMA or optical methods, is that they are based on de-
volatile organic compounds (Huang et al., 2020).                   tection of growth in mass or volume. When applied alone,
   The composition of the droplet surface can influence the        these methods are not sensitive enough for detecting minute
mass transport and chemical reactions that occur at the sur-       amounts of water adsorbed onto the aerosols at low humid-
face (e.g., Cosman et al., 2008; Park et al., 2009; Roy et al.,    ity or below the deliquescence relative humidity (DRH). Fur-
2020). The acidity of organic acids on water surfaces has          thermore, most of these methods do not provide molecular-
been measured to be much lower than predicted for the              level information about the system and are insensitive to
bulk aqueous phase (Enami et al., 2010; Prisle et al., 2012;       surface-specific chemistry and the phase state of adsorbed
Öhrwall et al., 2015; Werner et al., 2018). Uptake of gly-         water. This can lead to underestimating the amount and im-
oxal has been shown to be enhanced at acidic interfaces (Shi       pact of water adsorption at lower RH. The equilibrium be-
et al., 2020). Changes in droplet size via evaporation or con-     tween water and the particle phase has been shown experi-
densation can affect the chemical reactions that take place        mentally to depend on the particle phase state and humidity
at the surface via changes in the relative dimensions and          history, with important implications for particle hygroscopic
chemical environments of the interface and associated bulk         growth and cloud droplet activation (Bilde and Svennings-
phases (Prisle et al., 2012; Djikaev and Ruckenstein, 2019;        son, 2004).
Petters et al., 2020). The presence of surface-active organic         A number of spectroscopic techniques have been applied
molecules on droplet surfaces can also affect droplet surface      to systems of environmental and atmospheric relevance (see,
tension (Shulman et al., 1996; Prisle et al., 2010b; Bzdek         e.g., the reviews of Ault and Axson, 2016; Tang et al., 2019).
et al., 2020) and morphology (Kwamena et al., 2010) that af-       Surface-sensitive techniques such as X-ray photoelectron
fect both warm (Sareen et al., 2013; Ovadnevaite et al., 2017)     spectroscopy (XPS) provide molecular-level information on
and ice cloud nucleation (Knopf and Forrester, 2011; Perkins       the chemical composition and properties of surfaces. So far,
et al., 2020) as well as droplet coalescence (Pak et al., 2020).   most of these studies, in particular those employing XPS,
   The formation of an aqueous aerosol phase can lead to the       have adopted a surface science approach using single crys-
partitioning of water-soluble gases to the condensed phase         tal surfaces as simplified model systems (Tang et al., 2019).
(Prisle et al., 2010a), including many reactive oxidants (Don-     For example, XPS has been used to study the photochemistry
aldson and Valsaraj, 2010), that can initiate a wide range of      of TiO2 (110) (Lampimäki et al., 2015), ionic mobility on
aqueous phase chemistry (McNeill, 2015). The mobilization          NaCl (001) surfaces induced by water adsorption (Verdaguer
of ions in aqueous solution has the ability to influence atmo-     et al., 2008) and reaction of water vapor with MgO (001) sur-
spheric chemistry (Cwiertny et al., 2008). In particular, the      faces (Kaya et al., 2011). XPS on a liquid micro-jet (Winter,
mobilization of chloride ion from sea salt aerosol is a signifi-   2009) has also been used to study surface-specific chemistry
cant source of chlorine gas in the troposphere, with the subse-    of aqueous solutions comprising atmospherically relevant or-
quent formation of chlorine radicals affecting the budgets of      ganic surfactants (Prisle et al., 2012; Werner et al., 2014;
important atmospheric species such as volatile organic com-        Öhrwall et al., 2015; Walz et al., 2015, 2016; Toribio et al.,
pounds, ozone, OH and nitrogen oxides (Wang et al., 2019).         2018; Werner et al., 2018; Ammann et al., 2018) as macro-
Recent field studies have detected the depletion of chloride       scopic model systems for atmospheric microscopic water
and bromide from marine aerosol particles under the influ-         droplets.
ence of acidic species from wildfire emissions (Braun et al.,         Experiments on single aerosol particles are, on the other
2017). A number of aqueous phase reactions occur between           hand, scarce (Antonsson et al., 2015; Shakya et al., 2016; Ouf
inorganic salt species and organic compounds. The hygro-           et al., 2016). As some of the few examples of atmospheric
scopic properties of sodium halide particles coated with fatty     relevance, XPS has been employed to study the surface com-
acids depend on both the salt anion and the carboxylic acid,       position of size-segregated ambient aerosol collected from an
with some mixtures showing barriers to water uptake while          urban environment (Cheng et al., 2013). We have previously
others do not (Miñambres et al., 2014). Enhanced production        studied solvation of RbBr in free-flying water clusters (Hau-
of sulfate aerosol via nitrate photolysis was observed to be fa-   tala et al., 2017b), as well as size-dependent structural phase
cilitated by the presence of surface-active halide ions (Zhang     changes in CsBr (Hautala et al., 2017a), as model systems
et al., 2020).                                                     for salt clusters of higher environmental relevance. Surface-
   A wide range of experimental techniques are available to        enhanced Raman spectroscopy (SERS) has also been em-
study the hygroscopic properties of particles in sub-saturated     ployed to study the surface composition of atmospherically
(< 100 % RH) conditions, including humidity-tandem differ-         relevant particles generated via electrospray (Gen and Chan,
ential mobility analyzers (H-TDMAs), various optical ex-           2017; Gen et al., 2019). Using environmental transmission
tinction and scattering methods, physisorption analyzers,          electron microscopy, Wise et al. (2008) observed significant
quartz crystal microbalances and various microscopic and           amounts of water uptake onto NaCl particles at humidities
spectroscopic methods (Kreidenweis and Asa-Awuku, 2014;            as low as 70 % RH, well below the deliquescence RH. With

Atmos. Chem. Phys., 21, 4709–4727, 2021                                             https://doi.org/10.5194/acp-21-4709-2021
J. J. Lin et al.: Deposited particles XPS                                                                                      4711

the advent of high-brilliance synchrotron radiation and recent      composition and environment of the sampled region. XPS
developments in electron analyzer technology, previous bar-         is furthermore a highly surface-sensitive technique, because
riers of too low sample density can be overcome, enabling           the resulting kinetic energies of the photoelectrons yield very
XPS studies under realistic conditions, in situ and operando,       short characteristic attenuation lengths, and the detected pho-
using the so-called ambient pressure XPS (APXPS) tech-              toelectron signal therefore originates mainly from the top-
nique (Salmeron and Schlögl, 2008; Ogletree et al., 2009;           most few nanometers of the sample. An XPS measurement
Starr et al., 2013; Kong et al., 2020).                             consists of measuring the intensity of photoelectrons emit-
   In this work, we study the pre-deliquescent water ad-            ted from the sample as a function of the characterized elec-
sorption to laboratory-generated, deposited sodium chloride         tron kinetic energy. Typically, an XPS spectrum presents the
(NaCl), malonic acid and sucrose particles. NaCl is a major         photoelectron signal intensity as function of the orbital bind-
component of sea salt, which is the most abundant aerosol           ing energy and consists of a collection of peaks, each cor-
species by mass in the atmosphere (Murphy et al., 2019).            responding to a different chemical species or specific envi-
Salt aerosols, apart from being important light scatterers, also    ronment, which is identified by the spectral position in terms
take part in atmospheric chemistry by interacting with atmo-        of the binding energy. Here, we quantify the spectral peaks in
spheric trace gases as a source of halogens (Rossi, 2003),          terms of their areas, which are directly proportional to the rel-
especially in the presence of water in the aerosols. The water      ative abundances of each species or environment on the sur-
uptake and deliquescence of salt aerosol particles can be af-       face of the sample. Spectral fitting techniques are employed
fected by the presence of other inorganic or organic matter.        to obtain accurate results for both binding energies and peak
For example, the presence of malonic acid in NaCl aerosol           areas.
will not only lower the DRH of the aerosol, but also facili-           Experiments were carried out at the APXPS end station
tate the depletion of chlorine (Laskin et al., 2012). Organic       (Schnadt et al., 2012; Knudsen et al., 2016) of the SPECIES
material comprises a large fraction of the ambient aerosol          beamline (Urpelainen et al., 2017) at the MAX IV Labora-
mass (Kanakidou et al., 2005), and malonic acid and su-             tory in Lund, Sweden. The end station is equipped with a
crose represent hygroscopic organic compounds with differ-          hemispherical SPECS Phoibos NAP-150 electron energy an-
ent chemical functionalities. Dicarboxylic acids such as mal-       alyzer and allows for measurements at both ultra-high vac-
onic acid have been identified in ambient aerosol samples           uum (UHV) conditions and up to 25 mbar in an ambient pres-
where they can dominate the water-soluble organic fraction          sure (AP) cell. During the experiments, the SPECIES beam-
(Khwaja, 1995; Yu et al., 2005; Decesari et al., 2000, 2001)        line was still under construction, and we used a double-anode
and are hygroscopic in both sub- and supersaturated condi-          (SPECS XR-50) X-ray source with Al (1486.6 eV) and Mg
tions (Prenni et al., 2001; Hori et al., 2003; Rissman et al.,      (1253.6 eV) anodes for exciting the samples instead of syn-
2007; Pope et al., 2010). Sucrose is studied as a model car-        chrotron radiation.
bohydrate that can form a glassy state in response to chang-           Samples were prepared at the Lund University Aerosol
ing relative humidity with effects on its ability to act as ei-     Lab and deposited on either silicon or gold substrates. De-
ther cloud or ice nuclei (Zobrist et al., 2011; Estillore et al.,   posited samples were kept and transferred to the SPECIES
2017). Utilizing APXPS, interaction with water vapor at the         end station in a desiccator in order not to expose them to
particle surface was studied at relative humidities between         ambient humidity for extended periods of time prior to the
0 % and 16 %. To the best of our knowledge, this is the first       experiments. For the XPS measurements, the substrates were
time XPS has been used on sampled nanoscale particles of            mounted onto stainless-steel sample holders using an adhe-
immediate atmospherically relevant composition at ambient           sive Cu tape in a clean tent environment and loaded into the
pressure conditions.                                                end station. The experiments consisted of recording C 1s,
                                                                    O 1s (sucrose and malonic acid), Na 1s and Cl 2p (NaCl)
                                                                    core-level XPS spectra of the deposited aerosol particles at
2   Experimental                                                    UHV and in situ at varying RH conditions. The Al anode was
                                                                    used to measure spectra from NaCl while the Mg anode was
We employed the APXPS technique to obtain chemically                used to measure spectra from the malonic acid and sucrose
specific information about the composition of the nanopar-          samples.
ticle surfaces. Photoelectron spectroscopy utilizes the photo-         A detailed account of the sample preparation process and
electric effect, by which the sample is ionized from inelas-        experimental conditions is given in the following sections.
tic collisions with photons, and the emitted electrons are de-
tected and characterized in terms of their kinetic energy (Ek ).
                                                                    2.1   Sample preparation
When the ionizing photon energy (hν) is known, the binding
energy (Eb ) of electrons within the sample can be determined
simply as Eb = hν − Ek . By using X-ray photons, core-level         Aerosol samples were generated by nebulizing aqueous so-
atomic-like orbitals can be ionized, and the electron bind-         lutions of sodium chloride (NaCl), sucrose (C12 H22 O11 ), or
ing energy gives a very sensitive fingerprint of the chemical       malonic acid (CH2 (COOH)2 ). Solutions were prepared using

https://doi.org/10.5194/acp-21-4709-2021                                             Atmos. Chem. Phys., 21, 4709–4727, 2021
4712                                                                                  J. J. Lin et al.: Deposited particles XPS

ultra-pure Milli-Q water. All chemicals were obtained from         order to remove any excess water after the experiment. In the
Sigma-Aldrich and used without further treatment.                  case of NaCl particles, the sample was heated up to 125 ◦ C
   The air flow containing solution droplets (3 L min−1 ) was      using a button heater placed behind the sample holder. This
mixed with dry, particle-free air (3 L min−1 ) in a 3 L aerosol    was done after the sample was dosed up to 10 mbar to see
mixing chamber. From the mixing chamber, 1–1.5 L min−1             whether the changes incurred on exposure to water vapor
was sent through a diffusion dryer followed by a 63 Ni             were reversible. Spectra obtained at 10 mbar, however, are
bipolar charger. The dried and charge neutralized aerosol          not included in the analysis below due to very low signal-to-
flow was divided between a scanning mobility particle sizer        noise ratios.
(SMPS, TSI 3936) for size distribution characterization and           The electron count rates inside the AP cell are reduced
a nanometer aerosol sampler (NAS, TSI 3089) for sample             when compared to measurements in UHV conditions due to
collection of the entire dry aerosol particle size distribution.   the attenuation of X-ray intensity by the SiN3 / Al window,
Sodium chloride particles were collected onto silicon (with        the limited aperture of the differential pumping of the elec-
native oxide) wafers, while sucrose and malonic acid parti-        tron analyzer, and scattering of the photoelectrons from the
cles were deposited onto a gold film substrate.                    vapor (Knudsen et al., 2016). In order to increase the count
   The surface coverage on the substrate in the NAS is a           rates, spectra recorded inside the cell were acquired at a pass
function of the particle concentration in the gas flow, the        energy of 100 eV instead of 50 eV as used in UHV condi-
drift velocity of the particles in the electric field, and the     tions in order to compensate for the reduced intensity. The
total sampling time (Preger et al., 2020). Particles are as-       analyzer broadening when using 100 eV pass energy was ap-
sumed to be spherical across the entire size distribution with     proximately 1 eV. Each spectrum was recorded 50–100 times
a charge distribution described by Boltzmann statistics. We        in static conditions for increased statistics. To check the re-
further assume uniform 100 % deposition efficiency of the          producibility of the measurements, we first verified that the
positively charged fraction, with values above 100 % indicat-      individual spectra had not drifted in energy with time, after
ing the presence of more than one monolayer of deposited           which all spectra recorded for a given sample and humidity
particles. Details of the sample generation are given in Table     condition were averaged for the final representation.
1.
                                                                   2.3   Data analysis
2.2    XPS measurements
                                                                   Recorded XPS spectra were fitted in order to accurately de-
UHV XPS spectra were recorded using a pass energy of               termine the binding energies of the core electrons and the
50 eV and an entrance slit of 3 mm × 20 mm. This con-              relative amounts of the probed elements under different con-
tributes to an experimental broadening of approximately            ditions. Chemical identities and environments were identified
500 meV in addition to the natural broadening from the exci-       from binding energies obtained from the XPS peak positions
tation source (850 meV for Al Kα and 680 meV for Mg Kα             and their relative amounts by determining the correspond-
radiation).                                                        ing peak areas. Data analysis was performed using the Igor
   For measurements at humid conditions, samples were              Pro software (WaveMetrics, Inc., Lake Oswego, OR, USA).
transferred from the UHV manipulator to the AP cell.               A Shirley-type background was removed from the data be-
Milli-Q water vapor was let into the AP cell through a high-       fore fitting the peaks using the SPANCF curve-fitting macro
precision leak valve. The pressure inside the cell was kept        package (Kukk et al., 2001, 2005). All spectra were fitted us-
constant using a valve connected to a pump in a feedback           ing symmetric Voigt line shapes. A linear background was
loop with an absolute capacitance manometer. All measure-          included in all the fits to remove any residual background af-
ments were made at 25 ◦ C at which the saturation vapor pres-      ter the Shirley-type background removal. The energy scales
sure of water is Psat = 31.73 mbar. The relative humidity was      of the spectra were calibrated using the well-known binding
calculated using the (water) vapor pressure inside the AP cell     energies of Si 2p and Au 4f recorded for the silicon and gold
so that RH = Pcell /Psat . While samples were inside the cell,     substrates, respectively, as the low aerosol particle coverage
spectra were recorded at different water vapor pressure con-       allowed simultaneous measurement of the substrate.
ditions (NaCl: 0, 2, 5 and again at 0 mbar; sucrose 0.2, 1 and        The position of a given spectral peak gives the binding en-
5 mbar; malonic acid 0.2 and 1 mbar). The water vapor pres-        ergy of the core electron for each probed element. Changes
sures of 0, 0.2, 1, 2 and 5 mbar correspond to relative hu-        in the binding energy as well as the width of the fitted peaks
midities of 0 %, 0.63 %, 3.2 %, 6.3 % and 16 %, respectively.      – or peak broadening – can indicate changes in the chemical
These relative humidities are well below the DRH for NaCl          environment or physical state of the sampled surface. The
(75.3 %; Tang and Munkelwitz, 1993), malonic acid (72.1 %;         area of the peak is directly proportional to the amount of the
Parsons et al., 2004) and sucrose (85.7 %; Yao et al., 2011).      element being measured. For the analysis here, we determine
Any remaining air was removed from the water by several            the elemental composition of particle surfaces as the relative
freeze–pump–thaw cycles before introducing the vapor into          ratios of the core-level peak areas. The peak area of the XPS
the AP cell. The cell was also purged with dry nitrogen gas in     signal depends on a number of factors, including experimen-

Atmos. Chem. Phys., 21, 4709–4727, 2021                                             https://doi.org/10.5194/acp-21-4709-2021
J. J. Lin et al.: Deposited particles XPS                                                                                           4713

Table 1. Aerosol sampling data including generated size distribution information (geometric mean number µN , geometric number standard
deviation σg , total number N and geometric mean surface area µSA ) and sample collection parameters (sampler flow rate Q, collection time
t, substrate and coverage).

                                            Mean size distribution                           Sample collection
                 Compound
                                      µN      σg           N           µSA             Q         t   Substrate   Coverage
                                     (nm)              (cm−1 )       (nm2 )     (L min−1 )   (min)                    (%)
                 Sodium chloride       72    2.0    3.94 × 10⁵         195            1.1       42   Si              232
                 Sucrose               79    2.2    3.59 × 10⁴         202            1.1       90   Au               56
                 Malonic acid          52    2.1    1.02 × 10⁵         193            1.2      275   Au              245

tal parameters of the incident radiation and electron spec-               3.1    NaCl
trometer as well as physical and environmental properties af-
fecting the orbital from which the photoelectron originated.              Figures 1 and 2 show the recorded Na 1s and Cl 2p spectra
If all of these parameters are known, the XPS signal can be               of NaCl aerosol particles deposited on a Si substrate mea-
used to quantify the amount of species i. While these pa-                 sured at 0, 2, 5 and again at 0 mbar (0 % RH, 6.3 % RH, 16 %
rameters are not always known, comparison of XPS signals                  RH and 0 % RH, respectively) water vapor pressure. Spec-
is still possible to quantify relative differences in elemental           tra recorded at UHV are shown in Figs. S2 and S3 of the
abundances and chemical states between experimental condi-                Supplement, since they provide the same information as the
tions. Before extracting relative ratios of the peaks, all spec-          measurements made in the AP chamber at 0 mbar water va-
tra were normalized to the photoionization cross section (Yeh             por pressure. The Na 1s spectra were fitted using a single,
and Lindau, 1985) of the given core electron. The attenuation             symmetric Voigt peak, except for the 0 mbar spectrum after
of photoelectron intensity due to scattering of the photoelec-            water exposure, where two peaks were required in order to
trons from the water vapor was estimated by using the kinetic             obtain a fit that represents the measured spectrum. The Cl 2p
theory formulation (Ogletree et al., 2009) and measured elec-             spectra were fitted with two peaks representing the 1/2 and
tron scattering cross-section data (Muñoz et al., 2007). The              3/2 spin–orbit components. The O 1s region for the NaCl
attenuation must be taken into account, because the fixed ex-             sample was also monitored during the experiments, but the
citation energy from the X-ray source leads to significantly              spectra are dominated by the signals from the native oxide of
different kinetic energies of the emitted photoelectrons and              the Si wafer and the vapor phase water, and no direct signs
consequently different mean free paths in the vapor environ-              of adsorbed or liquid water could therefore be observed from
ment.                                                                     these spectra at low RH. These spectra are therefore omitted
                                                                          from the discussion below.
                                                                             After calibrating the energy scale using the substrate Si 2p
3   Results and discussion
                                                                          peaks, the binding energy of the Na 1s core level at UHV
Below we present experimental XPS spectra together with                   conditions was determined to be 1073.48 eV and is indicated
details and results of curve fitting for deposited NaCl, su-              by the dashed vertical line in Fig. 1. The signal-to-noise ra-
crose and malonic acid aerosol nanoparticles. Binding en-                 tio in the spectra recorded at 5 mbar (16 % RH) is very low,
ergy shifts of varying degrees from the dry conditions are ob-            and the fitted line should be regarded more as guiding the
served with increasing relative humidity, indicating changes              eye than an accurate fit to the peak. The binding energy
in the chemical environment of the target element. In addi-               of the Cl 2p 3 / 2 component at UHV conditions was de-
tion, changes in the stoichiometry of molecules on the par-               termined to be 200.3 eV shown by the dashed vertical line
ticle surface can be seen from the intensity ratios between               in Fig. 2. The Na 1s and Cl 2p binding energies measured
different core-level XPS peaks. This is a sign of changes in              here for deposited NaCl nanoparticles at UHV conditions
the chemical composition on the surface of the deposited par-             are higher than the values typically reported in the litera-
ticles. These observations are clear indications that water is            ture (e.g., Beard, 1993). Due to the insulating effect of the
already being adsorbed onto the particles and interacting with            semiconducting silicon substrate, the loss of electrons from
molecules on their surfaces at these low-relative-humidity                photoionization by the X-ray beam leads to positive charg-
conditions. The implications and possible interpretations of              ing of the sample surface, which causes an apparent increase
these observations are discussed below.                                   in the observed binding energies. The addition of ambient
                                                                          gas during APXPS measurements can offset the effect of sur-
                                                                          face charging since photoelectrons from the photoionization
                                                                          of the gas can travel to the sample surface and compensate
                                                                          for the positive charge. When binding energy shifts are de-

https://doi.org/10.5194/acp-21-4709-2021                                                     Atmos. Chem. Phys., 21, 4709–4727, 2021
4714                                                                                         J. J. Lin et al.: Deposited particles XPS

Figure 1. Na 1s XPS spectra of NaCl aerosol particles recorded at
different water vapor pressures (relative humidities, RH). The point
markers show the recorded data and the solid lines the fit envelope
curve. The spectra are fit using a single symmetric Voigt peak shown
in red with an additional peak in blue necessary to explain the spec-
trum at 0 mbar after water exposure. The dashed vertical line shows     Figure 2. Cl 2p XPS spectra of NaCl aerosol particles recorded at
the binding energy of Na 1s at 0 mbar pressure (0 % RH) at the          different water vapor pressures (relative humidities, RH). The dots
beginning of the experiments. Error bars show the estimated un-         show the recorded data, the solid lines the fit envelope curve, and
certainty in the peak position from Monte Carlo analysis. Photon        the red and blue peaks the fitted 3/2 and 1/2 spin-orbit components,
energy was 1486.6 eV from the Al anode.                                 respectively. The dashed vertical line shows the binding energy of
                                                                        the Cl 2p 3/2 component at 0 mbar pressure (0 % RH) at the begin-
                                                                        ning of the experiments. Error bars show the estimated uncertainty
                                                                        in the peak position from Monte Carlo analysis. Photon energy was
termined here for humidified conditions, they are therefore
                                                                        1486.6 eV from the Al anode.
calculated relative to the respective binding energies mea-
sured for our nanoparticle samples at 0 mbar and not relative
to the literature value.
                                                                        certainty. After this first rapid decrease, the Cl 2p binding
3.1.1   Binding energy shifts: changes in chemical                      energies reach a plateau, when the relative humidity is in-
        environment                                                     creased to 16 %. The binding energy shifts for Na 1s and Cl
                                                                        2p between 0 % RH and 6.3 % RH are nearly identical, but
Figure 3 shows the binding energy shifts relative to dry con-           the subsequent shift for Na 1s between 6.3 % and 16 % RH is
ditions of the Na 1s and Cl 2p core-level peaks (red diamonds           towards larger binding energies by 0.17 eV, while Cl 2p shifts
and dots, respectively) as a function of water vapor pres-              towards lower binding energies by −0.26 eV.
sure at 25 ◦ C. We observe a significant shift of approximately            Some of the shift in binding energy can be attributed to
1.1 eV in both Na 1s and Cl 2p binding energies already when            the introduction of water vapor lessening the effect of charg-
water vapor is introduced into the system at very low relative          ing of the sample compared to the measurements at 0 mbar,
humidities. The observed shifts are greater than the error es-          but since the amount of ambient gas changes between the
timates in the peak positions shown in Fig. 3 and therefore             measurements, we cannot deconvolute the individual effects
cannot be entirely explained by measurement or fitting un-              of condensed water and gas-phase water on the binding en-

Atmos. Chem. Phys., 21, 4709–4727, 2021                                                    https://doi.org/10.5194/acp-21-4709-2021
J. J. Lin et al.: Deposited particles XPS                                                                                      4715

ergy shift. However, the binding energy shifts observed here
are in good agreement with those reported for Na 2s and Cl
2p in NaCl (001) single crystal surfaces by Verdaguer et al.
(2008), even showing a similar plateau at intermediate pres-
sures. The measurements by Verdaguer et al. (2008) were
done at constant water vapor pressure and the similarities in
the observed binding energy shifts with relative humidity be-
tween their work and ours therefore suggest that condensed
water also plays a role in the binding energy shift observed
in the present measurements. As Verdaguer et al. (2008) did
not report the magnitude of the binding energy shift from
0 % RH to 5 % RH, we have shifted their 5 % RH data point
to coincide with our data in Fig. 3 for easier qualitative com-
parison of the two data sets. The shift of the Na 1s peak for
deposited aerosol in the present work towards larger bind-
ing energies at 16 % RH is not entirely in line with the ob-
servations on NaCl (001), which show monotonic shifts to-
wards lower binding energies for both Na 2s and Cl 2p peaks.
However, the poorer quality of the experimental spectrum for      Figure 3. Binding energy shifts relative to dry conditions of the
aerosol Na 1s at 16 % RH in the present work, compared to         core-level peaks for NaCl, sucrose and malonic acid particles, as
spectra recorded at lower RH, leads to larger uncertainty in      functions of water vapor pressure (relative humidity). The orange
the peak-fitting procedure. Furthermore, the shifts observed      traces extending above 60 % RH show the data from Verdaguer et al.
for NaCl nanoparticles in the present work are larger for Cl      (2008) for a single NaCl (001) crystal that has been aligned to the
2p than for Na 1s, as opposed to larger shifts (by approxi-       shifts obtained in this study.
mately 50 meV) for Na 2s than Cl 2p in the NaCl (001) single
crystal.
   In our experiments, the water vapor was removed from the       itatively following the behavior of their observed core-level
AP cell after the measurements at 16 % RH, and another set        binding energy shifts.
of spectra was recorded at 0 % RH. We see that when RH               The difference between deposited aerosols and single
decreases from 16 % to 0 %, the binding energies of the Na        crystal spectra may, at least partially, be explained by the
1s and Cl 2p do not shift back to their original values, but a    experimental resolution, which is lower in the present study
memory effect of approximately 0.2 eV for both Na 1s and Cl       with peak widths dominated by experimental factors. In the
2p is observed. Since this observed memory effect is greater      NaCl (001) case, the observed binding energy shifts are at-
than the energy step size of 0.1 eV used in the acquisition       tributed to the discharging of the surface, where increas-
of the spectra, which is in turn greater than the energy accu-    ing relative humidity causes the surface to be gradually dis-
racy of the electron analyzer when operating at 50 or 100 eV      charged due to ionized water vapor and secondary electrons.
pass energy, we consider it to be a real effect that cannot be    As water is adsorbed onto the surface, it leads to solvation of
explained solely by experimental uncertainty. This is in line     surface ions and increased mobility of these charge carriers.
with the observations by Verdaguer et al. (2008), who also        This ion mobility makes discharging more efficient, leading
report a memory effect of less than 0.5 eV for single-crystal     to further shifts in observed binding energies. According to
NaCl (001).                                                       Verdaguer et al. (2008) these solvation effects become more
                                                                  significant above approximately 35 % RH.
3.1.2   Changes in spectral peak width                               This interpretation is further supported by scanning force
                                                                  microscopy studies and infrared studies that show modifi-
In addition to the shifts in binding energies, we also investi-   cations in the surface structure and a sudden increase in
gated possible changes in the width of the XPS peaks due          water coverage at around 40 % RH (Dai et al., 1997; Pe-
to the effects of water adsorption to the particle surfaces.      ters and Ewing, 1997b; Foster and Ewing, 2000). Kelvin
Changes in the spectral peak widths can indicate changes in       probe microscopy (KPM) experiments by Cabrera-Sanfelix
the chemical environment or charge carrier mobility on the        et al. (2007), Verdaguer et al. (2005) and Verdaguer et al.
aerosol surfaces. While we found clear binding energy shifts      (2008) show how water vapor affects the surface potential of
(Fig. 3), we did not observe any significant changes in the       the NaCl (001) surface. They found variations on the order
peak width of either the Na 1s or the Cl 2p peaks. In con-        of 0.1 to 0.25 V across the RH range of their experiments,
trast, the data obtained by Verdaguer et al. (2008) show de-      which clearly is not sufficient to explain the energy shifts
creasing total widths of Na 2s and Cl 2p peaks for a NaCl         they observed. The variations in surface potential also cause
(001) single crystal with increasing relative humidity, qual-     peak broadening due to slight differences to the kinetic ener-

https://doi.org/10.5194/acp-21-4709-2021                                            Atmos. Chem. Phys., 21, 4709–4727, 2021
4716                                                                                      J. J. Lin et al.: Deposited particles XPS

gies of photoelectrons from different regions of the surface.      cross section and attenuation due to scattering in the water
The decrease in peak broadening observed for single crys-          vapor into account. This change as a function of increasing
tals is ultimately attributed to adsorbed water reducing inho-     RH is presented in Fig. 4. The extracted Na-to-Cl ratio of
mogeneities in the surface potential. These inhomogeneities        0.68 % RH at 0 % RH decreases slightly to 0.51 and 0.58
originate from potential differences between and within the        when the RH is increased to 6.3 % and 16 %, respectively.
step and terrace sites of the crystal. The KPM experiments         The ratio measured at 0 % RH after dosing was determined to
show that the inhomogeneities are removed as water adsorbs         be 0.62, which is close to the value before exposure to water
at very low surface coverage below that of one monolayer. In       vapor. As the spectra for all RH are recorded with a constant
the present work, the deposited NaCl aerosol particle sam-         excitation energy from the Al Kα anode, different transmis-
ples are most likely very far from being perfect crystals, pos-    sion through the electron analyzer at different electron ki-
sibly containing a large number of steps, terraces and kinks,      netic energies cannot explain the difference between the Na-
leading to larger variations in the surface potential and thus     to-Cl peak area ratio and the NaCl stoichiometric ratio. Due
increased broadening of the peaks in any humidity condi-           to the constant relative transmission, this could lead only to
tion compared to a NaCl (001) crystal. This could, together        a constant ratio differing from the stoichiometric ratio. Fur-
with the moderate experimental resolution, explain why no          thermore, the reported transmission of the analyzer is very
decrease in the broadening of the peaks is observed for the        nearly the same for the Cl 2p and Na 1s regions (SPECS Sur-
aerosol particles at low RH.                                       face Nano Analysis GmbH, 2020). This correlation between
   Results of our study show, not surprisingly, that the aerosol   changes in the chemical composition of the surface layer and
particle samples investigated have more complex morphol-           RH is therefore a clear indication of water being adsorbed
ogy than the simple single crystal surfaces previously stud-       to the NaCl particle surfaces. Assuming that the thickness
ied by XPS. Several previous studies have observed that the        of the layer of water molecules adsorbed on the NaCl sur-
process of drying an aerosol can indeed affect its crystalline     faces is approximately 2.4 Å (Cabrera-Sanfelix et al., 2007),
form. For example, studies of NaCl aerosol particles gener-        photoelectrons emitted from the NaCl particles need to pass
ated from drying of aqueous droplets have inferred a non-          through this distance to escape from the sample and would
crystalline structure with pores or pockets that trap liquid       be attenuated by collisions with the water molecules in the
water (Weis and Ewing, 1999; Darr et al., 2014; Braun and          process. In our experimental conditions, the photoelectrons
Krieger, 2001). This explains the presence of liquid water         have kinetic energies (rounded to the nearest 10) of approx-
detected below the deliquescence relative humidity but still       imately 410 and 1290 eV for Na 1s and Cl 2p, respectively.
at much higher RH than in our study. Furthermore, the mor-         The two core-level signals will therefore be attenuated dif-
phology of NaCl particles expressed via the shape factor has       ferently due to the different inelastic mean free paths of the
been shown to be controlled by the drying rate (Wang et al.,       electrons, approximately 2 nm at 410 eV and 5 nm at 1290 eV
2010). A recent study (Archer et al., 2020) has explained the      (Emfietzoglou and Moscovitch, 2002).
morphology of particles formed from drying of a colloid as            To quantify the attenuation of the photoelectron signal, we
a competition between diffusion of solute in solution versus       use an exponential decay function In = In0 e−x/λn , where In
loss of solvent, with higher solvent loss rate compared to so-     is the attenuated intensity of peak n, In0 is the corresponding
lute diffusivity leading to more complex morphologies. For         unattenuated intensity, x is depth into the sample from where
atmospheric samples, microscopy studies on sea salt particles      the signal originates and λn is the energy-dependent inelas-
have shown them to have complex morphologies (e.g., Cheng          tic mean free path of photoelectrons contributing to peak n.
et al., 1988), similarly to what was found for the laboratory-     The depth of origin can be expressed as x = λλ11−λλ2
                                                                                                                       2
                                                                                                                         ln R, where
generated aerosol samples in the present study.                         I1 I20
                                                                   R=            is the relative ratio of attenuated and unattenuated
   Atmospheric aerosols are likely to undergo multiple dry-             I2 I10
ing and humidification cycles under a wide range of condi-         signals from two separate peaks n = 1, 2. We here use the to-
tions and thus to exhibit a range of morphologies related to       tal integrated peak areas to represent signal intensities. In our
drying. Our measurements on aerosol particle samples gener-        experiments, the unattenuated signal ratio (measured without
                                                                   water vapor) for Na 1s and Cl 2p is INa0 /I 0 = 0.9. With this,
ated from nebulization and subsequent desiccation are there-                                                  Cl
fore expected to much more closely represent the morpholo-         from the corresponding signal ratios at elevated humidities,
gies of atmospheric aerosols, compared to the simple uni-          the simple attenuation model gives depths of photoelectron
form morphologies of single-crystal samples.                       origin (or water layer thickness) of approximately 14 and
                                                                   4 Å for 6.3 and 16 % RH, respectively. This is much more
3.1.3   Changes in peak area ratios: chemical changes in           than the previous observations of 2.4 Å by Cabrera-Sanfelix
        surface composition                                        et al. (2007) and also counterintuitive as it would mean de-
                                                                   creasing layer thickness with increasing RH. Furthermore,
Considering the relative amounts of Na and Cl on the particle      this simple attenuation model implicitly assumes at least a
surfaces, we observe a decrease in the Na 1s to Cl 2p peak         full monolayer coverage so that all signal is uniformly atten-
area ratio, even after taking differences in photoionization       uated by the adsorbed water layer. Previous studies on NaCl

Atmos. Chem. Phys., 21, 4709–4727, 2021                                                 https://doi.org/10.5194/acp-21-4709-2021
J. J. Lin et al.: Deposited particles XPS 4717
(100) crystals (Peters and Ewing, 1997b, a; Foster and Ew-
ing, 2000) have shown that a full water monolayer does not
develop until approximately 35 % RH. On the other hand,
it has been shown that NaCl (100) does not adsorb water
strongly whereas small particles (1–10 µm) have a propen-
sity for adsorbing large amounts of water (Ghosal and Hem-
minger, 2004). This strong adsorption has also been con-
nected to observations of water remaining on the particle sur-
face, even at elevated temperatures in vacuum. Indeed, this is
also observed in the present work in the form of a memory
effect in the Na 1s and Cl 2p peak shifts as the humidity
is decreased to 0 % RH: the peak shift does not completely
disappear, even after heating the sample to 125 ◦ C (Fig. S1).
The signs of stronger water adsorption in the present work
could therefore be attributed to the small size of our sampled
NaCl particles, contributing to larger surface area (as well as
more crystal imperfections) and therefore to a larger number
of possible surface adsorption sites.
While attenuation observed due to the adsorbed water
layer is one possible explanation for the decreasing Na-to-Cl Figure 4. Relative peak areas for NaCl (Na : Cl, red), sucrose (O : C,
ratio observed in this work, another, complementary, expla- black), and carbon to oxygen in the malonic acid carboxyl group
nation could be the preferential dissolution of Cl− ions into (COOH (O 1s) : COOH (C 1s), blue). The dashed horizontal red,
the water film. Spatial segregation of the Na+ and Cl− ions black and blue lines show the expected stoichiometric ratio for
could further enhance the difference in the attenuation be- NaCl, sucrose and malonic acid, respectively. Relative ratios differ-
tween Na 1s and Cl 2p XPS signals and is likely to be even ing from the stoichiometric ratio indicate changes in the chemical
composition of the surface of the aerosol particles.
more pronounced as a more complete water layer forms on
the particle surfaces. In this case, the Cl 2p photoelectrons
only need to pass through part of the water layer while the Na
1s electrons will be attenuated by both a layer of water and more prone to the effect of irradiation, and in the course of
the dissolved Cl− ions. This interpretation is supported by the experiments this could mean an accumulating loss of Cl
density functional theory (DFT) calculations and contact po- due to desorption or diffusion (Verdaguer et al., 2008). Our
tential measurements (Cabrera-Sanfelix et al., 2007), which present results, however, show exactly the opposite: the Cl is
showed that Cl− can indeed be lifted out of a NaCl (100) enhanced with respect to Na. Furthermore, the radiation from
crystal surface already at one monolayer water coverage. Us- the X-ray anode is far less intense than that produced by a
ing XPS on free-flying sub-2 nm CsBr water clusters, Hau- synchrotron, making beam damage less likely. This leads us
tala et al. (2017b) found that Br− ions were closer to the sur- to conclude that the observed effect cannot be due to beam
face than their counter cations. These experimental results damage. Finally, it is also possible that the photoelectron sig-
further support the interpretation of our present observations nal is attenuated by so-called adventitious carbon, a thin layer
that pre-deliquescent water adsorption enhances chloride rel- of carbon-containing material that may form on the samples
ative to sodium in the aerosol surface layer. when exposed to ambient air (Barr and Seal, 1995), in addi-
The presence of halide ions, especially Cl− and Br− , at tion to adsorbed water. During our experiments, we unfortu-
the air–water interface has been connected to increased pho- nately did not measure C 1s spectra for the NaCl particles,
tochemical activity (e.g., George and Abbatt, 2010, and ref- and we are therefore not able to quantify the potential influ-
erences therein). The mobilization of ions can lead to re- ence of adventitious carbon on the Na 1s and Cl 2p peak area
lease of gaseous halogen compounds from sea salt aerosol ratios. Effects of adventitious carbon are discussed in more
due to reactions in the aqueous phase (Mozurkewich, 1995; detail for the sucrose and malonic acid samples where C 1s
Vogt et al., 1996; Kerminen et al., 1998; Keene et al., 1999). spectra were measured.
In the atmosphere, formation of solvated halogen ions even
at very dry conditions via similar pre-deliquescent adsorp- 3.2 Sucrose
tion of water onto the surfaces of sea salt aerosol as seen
for laboratory-generated aerosol in this work could therefore Figure 5 shows the C 1s XPS spectra of deposited sucrose
have significant implications for the halogen cycle, including aerosol particles at 0, 0.2, 1 and 5 mbar water vapor pres-
ozone chemistry in the polar regions (Simpson et al., 2007). sure. Measurements were repeated at 0 mbar water vapor
Another possible explanation for the difference in the Na- pressure after dosing but are not shown here since no sig-
to-Cl ratio could be beam damage. Cl has been shown to be nificant changes were observed. The C 1s spectra were fitted
https://doi.org/10.5194/acp-21-4709-2021 Atmos. Chem. Phys., 21, 4709–4727, 20214718 J. J. Lin et al.: Deposited particles XPS
with three peaks corresponding to distinct carbon atoms in
C–C / C–H, C–O and O–C–O bonds at 285.20, 286.66 and
288.06 eV, respectively, at 0 % RH. Sucrose molecules con-
tain only C–O and O–C–O carbon, and the largest peak cor-
responding to C–C / C–H carbon is therefore attributed to ad-
ventitious carbon on the substrate. The obtained peak ener-
gies at 0 % RH for C–O and O–C–O carbons are in good
agreement with values reported by Stevens and Schroeder
(2009), 286.7 and 288.1 eV, respectively. Since the gold sub-
strate is highly conductive, we do not expect any charging
effect as for the NaCl samples deposited on Si. Differences
between the binding energies measured here and those of
Stevens and Schroeder (2009) may instead arise from the
choice of reference for calibrating the energy scale. Whereas
we here calibrated the energy scale using the well-known Au
4f peak, Stevens and Schroeder (2009) used the adventitious
carbon peak, which may have a wide range of binding ener-
gies (Greczynski and Hultman, 2018). Additional details on
the peak fitting can be found in the Supplement.
Figure 6 shows the O 1s XPS spectra of the deposited su-
crose aerosol particles. The O 1s spectra were fitted with
two peaks for sucrose corresponding to C–O and O–C–O
oxygen. With the introduction of water vapor into the high-
pressure cell, a third peak from the water vapor (Patel et al.,
2019) appears in the XPS spectra, as evidenced by the in-
crease in signal with increasing humidity. The binding en-
ergies of the C–O and O–C–O peaks at 0 % RH were deter-
mined to be 532.32 eV and 533.02, respectively. These values
differ slightly from those reported by Stevens and Schroeder
(2009) (533.0 and 533.7 eV, respectively). Additional peak
fitting details can be found in the Supplement.
Figure 5. C 1s XPS spectra of sucrose aerosol particles. The dots
The binding energy shifts of sucrose C 1s and O 1s peaks
show the recorded data, the solid lines the fit envelope curve, and
with respect to 0 % RH are shown in the black traces in the red, blue and green peaks the C–C / C–H, C–O and O–C–O car-
Fig. 3. Because the peak separation in each case is fixed, bon components, respectively. The dashed vertical line shows the
only a single shift is reported for spectra of each element. binding energy of the C–O component at 0 mbar pressure (0 % RH)
Unlike with NaCl, the binding energy shifts in the sucrose at the beginning of the experiments. Error bars show the estimated
spectra do not suggest adsorption of water to the sucrose uncertainty in the peak position from Monte Carlo analysis. Photon
particles at the investigated humidities. The C 1s initially energy was 1253.6 eV from the Mg anode.
shows a small shift and then returns to 0 % RH at 16 % RH.
The O 1s peaks on the other hand seem to shift slightly to-
wards lower binding energies (580 meV at 16 % RH). Fig- water adsorbed onto the particles at RH below 16 % or that if
ure 4 shows the O : C ratio of sucrose as a function of RH. water is adsorbed, there is no significant chemical interaction
The ratio in all conditions is very close to the stoichiomet- between the water and the sucrose nanoparticle.
ric value of O : C = 11/12 ≈ 0.92. Looking specifically at the The high surface sensitivity of the XPS spectra enables us
relative ratios of C–O and O–C–O carbon C 1s and oxygen to confirm previous measurement results that rely on detect-
O 1s peaks, we see only minor changes with RH. The C–O ing changes in volume (Zobrist et al., 2011) or mass (Yao
C 1s signal seems to increase slightly from 0 % RH to 3.2 % et al., 2011). Zobrist et al. (2011) used optical techniques
RH but is again lower at 16 % RH. The same is seen for the to determine the size of single sucrose microparticles levi-
O 1s O–C–O signal, which increases slightly from dry con- tated in an electrodynamic balance (EDB) under varying RH
ditions towards 16 % RH. Taken together, the observations conditions. Their results show that crystalline sucrose barely
that both the O 1s and C 1s peaks only show a small bind- adsorbs any water before the deliquescence point of 85.6 %.
ing energy shift with increasing RH, the O : C ratio remains They also show that sucrose does not exhibit any efflores-
nearly constant and the changes in relative ratios between cence upon drying but instead assumes an amorphous glassy
C–O and O–C–O carbon C 1s and oxygen O 1s signals are state. On subsequent humidification cycles the amorphous
small, suggest that either there is no significant amount of sucrose particle did not show any significant water uptake be-
Atmos. Chem. Phys., 21, 4709–4727, 2021 https://doi.org/10.5194/acp-21-4709-2021J. J. Lin et al.: Deposited particles XPS 4719
3.3 Malonic acid
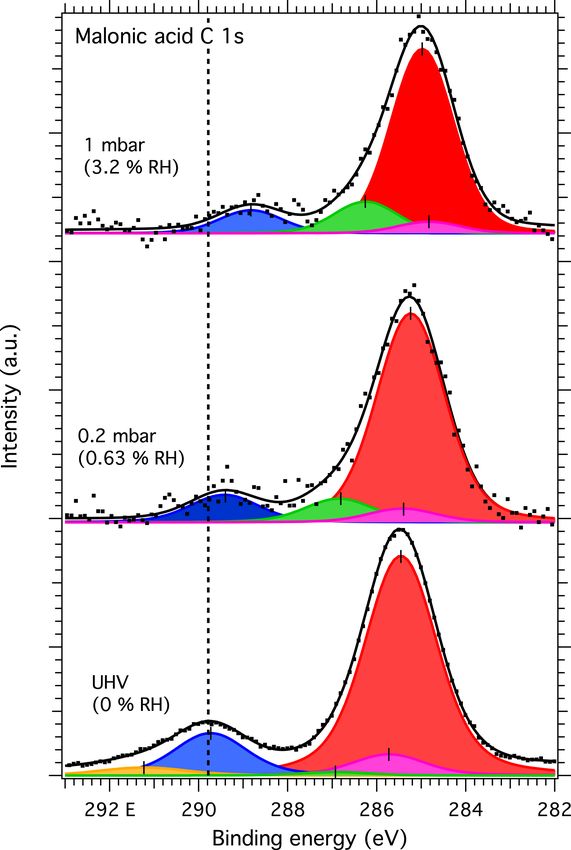
Figures 7 and 8 show the recorded C 1s and O 1s XPS spec-
tra, respectively, of deposited malonic acid aerosol particles
at 0, 0.2 and 1 mbar water vapor. Due to measurement time
constraints, spectra were not recorded for 5 mbar or again at
0 mbar water vapor after dosing. The C 1s spectra were fit-
ted with three main peaks corresponding to C–C / C–H car-
bon originating from adventitious carbon and COOH and C–
C carbon from malonic acid particles at 285.49, 289.77 and
285.77 eV, respectively, in UHV conditions. As for sucrose,
we also do not expect any charging effects for the malonic
acid samples due to the high conductivity of the gold sub-
strate. Malonic acid has been shown to be prone to beam
damage when exposed to radiation from laboratory X-ray
sources. This can give rise to additional peaks in the XPS
spectra arising from malonic acid molecules damaged by
the X-ray beam (Ferreira et al., 2017a, b). The decomposi-
tion peaks DP1 and DP2 observed by Ferreira et al. (2017b)
were included in the fit for 0 % RH (UHV), where a good
fit could not be produced without their inclusion. In UHV
conditions, the DP1 and DP2 peaks were observed at 291.27
and 286.87 eV, respectively. The spectra recorded with wa-
ter vapor did not show clear indication of the DP2 feature,
but an additional peak needs to be fitted close to the DP1
feature in both 0.6 % RH and 3.2 % RH spectra. The best fit
was acquired with the feature at 286.70 and 286.14 eV for
0.6 % and 3.2 % RH, respectively. This is 1.4 eV higher than
the C–C carbon peak of malonic acid in both cases, in good
agreement with the position of the DP1 peak of Ferreira et al.
(2017b). Additional details of the fitting procedure may be
Figure 6. O 1s XPS spectra of sucrose aerosol particles. The dots found in the Supplement.
show the recorded data, the solid lines the fit envelope curve, and the The malonic acid O 1s spectra were fitted with two main
red, blue and green peaks the water vapor and sucrose O–C–O and
peaks for the C=O and C–OH oxygen of the two carboxyl
C–O components, respectively. The dashed vertical line shows the
groups. For UHV conditions, the best fit was acquired with
binding energy of the C–O component at 0 mbar pressure (0 % RH)
at the beginning of the experiments. Error bars show the estimated a splitting of approximately 1.0 eV between the C=O and
uncertainty in the peak position from Monte Carlo analysis. Photon C–OH peaks (at 532.07 and 533.02 eV, respectively). This
energy was 1253.6 eV from the Mg anode. splitting is smaller than the previously reported values of 1.1
and 1.3 eV by Ferreira et al. (2017b). For our measurements
with water vapor, the best fits were obtained with a split-
fore RH of 35 %–40 %. Our present work also supports this ting of 1.2 eV between the C=O and C–OH oxygen peaks
observation on the molecular level. In contrast to NaCl par- (at 531.48 and 532.68 eV at 3.2 % RH, respectively), now in
ticles, the absence of changes in the sucrose C 1s and O 1s good agreement with the work of Ferreira et al. (2017b). The
binding energies and O-to-C ratio with increasing RH, to- peak at the highest binding energy in the spectra recorded at
gether with this high surface sensitivity of the XPS measure- humid conditions is the O 1s peak from water vapor. While
ments, indicates insignificant water adsorption by sucrose peaks due to possible beam damage were observed in the C
aerosol particles at humidities up to 16 % RH. 1s spectra of malonic acid (DP1 and DP2 in Fig. 7), fitting
In the atmosphere, these results could mean that corresponding peaks in the O 1s spectrum did not yield a
pre-deliquescent water adsorption and resulting chemical better representation of the measured XPS spectra. However,
changes in very dry conditions could be much less likely to this is also in line with the previous works of Ferreira et al.
occur for aerosol comprised of significant amounts of sugar (2017a), showing that the signal due to beam damage is much
functionalities, such as those produced in biomass burning less pronounced in the O 1s spectra than in the C 1s spectra.
(Scaramboni et al., 2015; Bhattarai et al., 2019), compared The binding energy shifts of malonic acid particle C 1s
to sea salt aerosol. and O 1s peaks with respect to 0 % RH are shown in the blue
traces in Fig. 3. When RH is increased, the COOH (and thus
https://doi.org/10.5194/acp-21-4709-2021 Atmos. Chem. Phys., 21, 4709–4727, 20214720 J. J. Lin et al.: Deposited particles XPS
Figure 7. C 1s spectra of malonic acid aerosol particles. The dots
show the recorded data and the solid lines the fit to the data. The
blue and purple peaks correspond to COOH and C–C of malonic Figure 8. O 1s spectra of malonic acid aerosol particles. The dots
acid, respectively, while the yellow and green peaks correspond to show the recorded data, the solid lines the fit envelope curve and the
DP1 and DP2 components, respectively, attributed to beam damage. red, blue and green peaks the water vapor, C–OH and C=O com-
The red peak corresponds to C–C / C–H of adventitious carbon. The ponents, respectively. The dashed vertical line shows the binding
dashed vertical line shows the binding energy of the COOH com- energy of the C=O component at 0 mbar pressure (0 % RH) at the
ponent at 0 mbar pressure (0 % RH) at the beginning of the experi- beginning of the experiments. Error bars show the estimated un-
ments. Error bars show the estimated uncertainty in the peak posi- certainty in the peak position from Monte Carlo analysis. Photon
tion from Monte Carlo analysis. Photon energy was 1253.6 eV from energy was 1253.6 eV from the Mg anode.
the Mg anode.
boxyl group is 2. Interestingly, already at 0 % RH (UHV),
also C–C) peaks of malonic acid are seen to shift towards the extracted ratio COOH (O 1s) : COOH (C 1s) = 0.94 is
lower binding energies. While the shift for malonic acid O 1s far from this stoichiometric value. When introducing wa-
is not as dramatic as for NaCl particles, the malonic acid C ter vapor into the system at 0.6 % RH, the ratio changes to
1s binding energies’ shift is even more pronounced than that 2.15. At 3 % RH, it increases even further to 2.95. While we
of Na 1s or Cl 2p, indicating that water is being adsorbed cannot offer a clear explanation for this observation at the
onto the surface of the malonic acid particles and changing present, based on the observed binding energy shifts and the
the chemical environment of the surface molecules. In addi- changes in the COOH (O 1s) : COOH (C 1s) ratio, it is safe
tion to the peaks shifts, the O 1s-to-C 1s signal ratio within to conclude that water is adsorbed on nanoscale malonic acid
the malonic acid carboxyl group, COOH (O 1s) : COOH (C aerosol particles already at the lowest RH measured and that
1s), changes with increasing RH. We focus on the carboxyl it has an effect on the chemical composition of the particle
groups as the C–C / C–H contribution is under the strong C– surface.
C / C–H signal from adventitious carbon and therefore can- On closer inspection of the malonic acid spectra, it is
not be fitted reliably. The stoichiometric O : C ratio of a car- clear that the C 1s spectrum at 0 % RH (UHV) resembles
Atmos. Chem. Phys., 21, 4709–4727, 2021 https://doi.org/10.5194/acp-21-4709-2021You can also read