Polar Front around the Kerguelen Islands: An up-to-date determination and associated circulation of surface/subsurface waters - Archive ouverte HAL
←
→
Page content transcription
If your browser does not render page correctly, please read the page content below

Polar Front around the Kerguelen Islands: An
     up-to-date determination and associated circulation of
                   surface/subsurface waters
   Young-Hyang Park, Isabelle Durand, Élodie Kestenare, Gilles Rougier, Meng
                   Zhou, Francesco d’Ovidio, Cédric Cotté, Jae-Hak Lee

     To cite this version:
    Young-Hyang Park, Isabelle Durand, Élodie Kestenare, Gilles Rougier, Meng Zhou, et al.. Polar
    Front around the Kerguelen Islands: An up-to-date determination and associated circulation of sur-
    face/subsurface waters. Journal of Geophysical Research. Oceans, Wiley-Blackwell, 2014, 119 (10),
    pp.6575-6592. �10.1002/2014JC010061�. �hal-01135890�

                                 HAL Id: hal-01135890
                https://hal.archives-ouvertes.fr/hal-01135890
                                     Submitted on 4 Jan 2022

    HAL is a multi-disciplinary open access            L’archive ouverte pluridisciplinaire HAL, est
archive for the deposit and dissemination of sci- destinée au dépôt et à la diffusion de documents
entific research documents, whether they are pub- scientifiques de niveau recherche, publiés ou non,
lished or not. The documents may come from émanant des établissements d’enseignement et de
teaching and research institutions in France or recherche français ou étrangers, des laboratoires
abroad, or from public or private research centers. publics ou privés.
                                              Copyright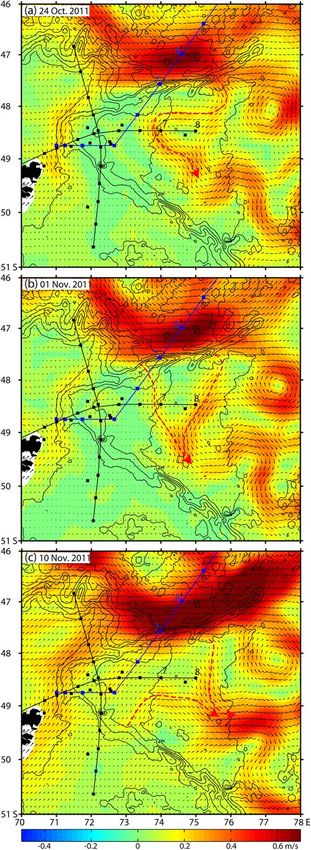
PUBLICATIONS
Journal of Geophysical Research: Oceans
RESEARCH ARTICLE                              Polar Front around the Kerguelen Islands: An up-to-date
10.1002/2014JC010061
                                              determination and associated circulation of surface/subsurface
Key Points:                                   waters
 We give here an up-to-date location
  of the PF around the Kerguelen              Young-Hyang Park1, Isabelle Durand1, Elodie Kestenare2, Gilles Rougier3, Meng Zhou4,
  Islands                                                           dric Cotte
                                              Francesco d’Ovidio5, Ce         1, and Jae-Hak Lee6
 Results are self-consistent with all
  data sets (historical, in situ, and         1
                                                MNHN-Sorbonne Universit  es (UPMC, Univ Paris 06)-CNRS-IRD, LOCEAN Laboratory, Mus     eum National d’Histoire Naturelle,
  satellite)
 Our results may erase the
                                              Paris, France, 2LEGOS (IRD/CNES/CNRS/Universit  e Toulouse III), Observatoire Midi-Pyr ees, Toulouse, France, 3LOPB,
                                                                                                                                     en
  long-lasting confusion about the            Centre d’Oceanologie de Marseille, Marseille, France, 4University of Massachusetts, Boston, Massachusetts, USA,
                                              5
  regional PF location                                            es (UPMC, Univ Paris 06)-CNRS-IRD-MNHN, LOCEAN Laboratory, Paris, France, 6Korea Institute of
                                                Sorbonne Universit
                                              Ocean Science and Technology, Ansan, South Korea
Correspondence to:
Y.-H. Park,
yhpark@mnhn.fr                                Abstract The circulation of iron-rich shelf waters around the Kerguelen Islands plays a crucial role for a cli-
                                              matically important, annually recurrent phytoplankton spring bloom over the sluggish shelf region and its
Citation:                                     downstream plume area along the Antarctic circumpolar flow. However, there is a long-standing confusion
Park, Y.-H., I. Durand, E. Kestenare, G.      about the Polar Front (PF) in the Kerguelen region due to diverse suggestions in the literature for its geo-
Rougier, M. Zhou, F. d’Ovidio, C. Cott  e,
and J.-H. Lee (2014), Polar Front             graphical location with an extreme difference over 10 of latitude. Based on abundant historical hydro-
around the Kerguelen Islands: An up-          graphic data, the in situ hydrographic and current measurements during the 2011 KEOPS2 cruise, satellite
to-date determination and associated          chlorophyll images, and altimetry-derived surface velocity fields, we determine and validate an up-to-date
circulation of surface/subsurface
waters, J. Geophys. Res. Oceans, 119,         location of the PF around the Kerguelen Islands. Artificial Lagrangian particle trajectories computed from alti-
6575–6592, doi:10.1002/                       metric velocity time series are analyzed for the possible pathways and sources of different surface/subsurface
2014JC010061.                                 waters advected into the chlorophyll bloom area east off the islands studied during the KEOPS2 cruise. The
                                              PF location determined as the northernmost boundary of the Winter Water colder than 2 C, which is also
Received 15 APR 2014
                                              associated with a band of strong currents, appears to be primarily controlled by topography. The PF rounds
Accepted 24 AUG 2014
Accepted article online 30 AUG 2014
                                              the Kerguelen Islands from the south to deflect northward along the eastern escarpment up to the north-
Published online 2 OCT 2014                   eastern corner of the Kerguelen Plateau before making its southward retroflection. It is shown that the major
                                              surface/subsurface waters found within the deep basin east of the Kerguelen Islands originate from the shelf
                                              around the Heard Island, rather than from the shallow shelf north of the Kerguelen Islands.

                                              1. Introduction
                                              The Kerguelen Plateau forms a major topographic barrier to the deep-reaching Antarctic Circumpolar Cur-
                                              rent (ACC), except for three deep passages such as the Kerguelen-Amsterdam passage north of the Kergue-
                                              len Plateau, the Fawn Trough dividing the Kerguelen Plateau at about 56 S into the northern and southern
                                              plateaux, and the Princess Elizabeth Trough between the southern tip of the southern plateau and Antarc-
                                              tica. According to direct observations of transport across the Fawn Trough during the 2009 TRACK (TRans-
                                              port ACross the Kerguelen plateau) cruise [Park et al., 2009] together with previous geostrophic transport
                                              estimates in the Kerguelen-Amsterdam passage [Park et al., 1993], about 60% of the total ACC transport
                                              (150 Sv; 1 Sv 5 106 m3 s21) transiting through the Kerguelen region passes north of the Kerguelen Plateau,
                                              mostly associated with the Subantarctic Front (SAF). The rest 40% passes across the vast plateau between
                                              the Kerguelen Islands and Antarctica, most of which (43 Sv) is concentrated in the Fawn Trough in associa-
                                              tion with the Southern ACC front (SACCF). There are two secondary branches of transport over the northern
This is an open access article under the
terms of the Creative Commons                 plateau identified [Park et al., 2009]; one carries a transport of 6 Sv, passing south of the Heard Island before
Attribution-NonCommercial-                    curling anticyclonically to flow northwestward along the eastern side of the plateau, and partly peeling off
NoDerivatives License, which permits          from the plateau into the deep Australian-Antarctic Basin, and the other carries a smaller transport (2 Sv),
use and distribution in any medium,           hugging the Kerguelen Islands from the south and attaching tightly to the eastern slope of the plateau
provided the original work is properly
                                              where it joins the transport coming from the south. Consequently, at the Polar Front (PF) immediately east
cited, the use is non-commercial and
no modifications or adaptations are            of the Kerguelen Islands, a combined transport of the above two confluent branches has been estimated
made.                                         approximately 6 Sv [Park et al., 2009].

PARK ET AL.                                                                   C 2014. The Authors.
                                                                              V                                                                                      6575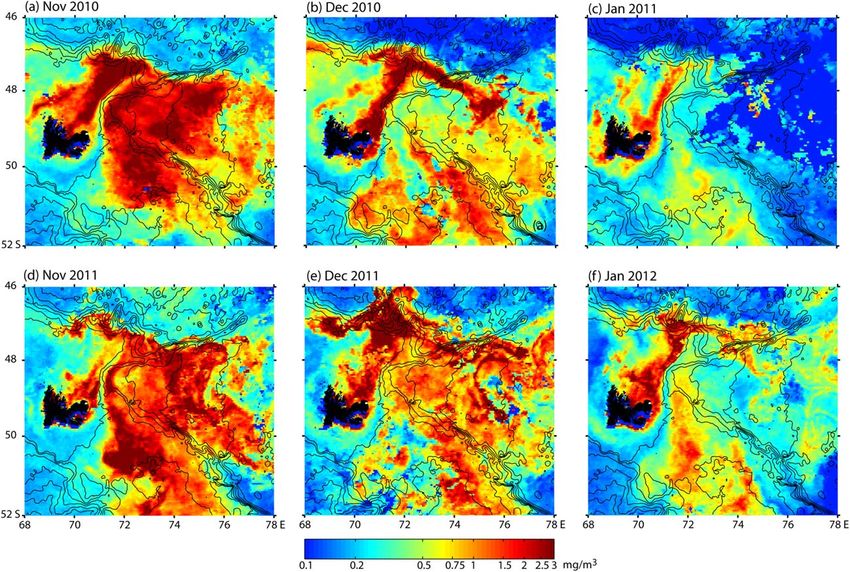
Journal of Geophysical Research: Oceans                                                          10.1002/2014JC010061

                                                                                                    The northern Kerguelen Plateau espe-
                                                                                                    cially the central to eastern part of the
                                                                                                    shelf between the Kerguelen and
                                                                                                    Heard Islands (where a maximum sill
                                                                                                    depth is about 650 m) had been the
                                                                                                    subject of extensive hydrographic and
                                                                                                    velocity observations during the 2005
                                                                                                    KEOPS1 (KErguelen Ocean Plateau
                                                                                                    compared Study 1) cruise [Park et al.,
                                                                                                    2008c]. The circulation in this shelf
                                                                                                    region is relatively stagnant (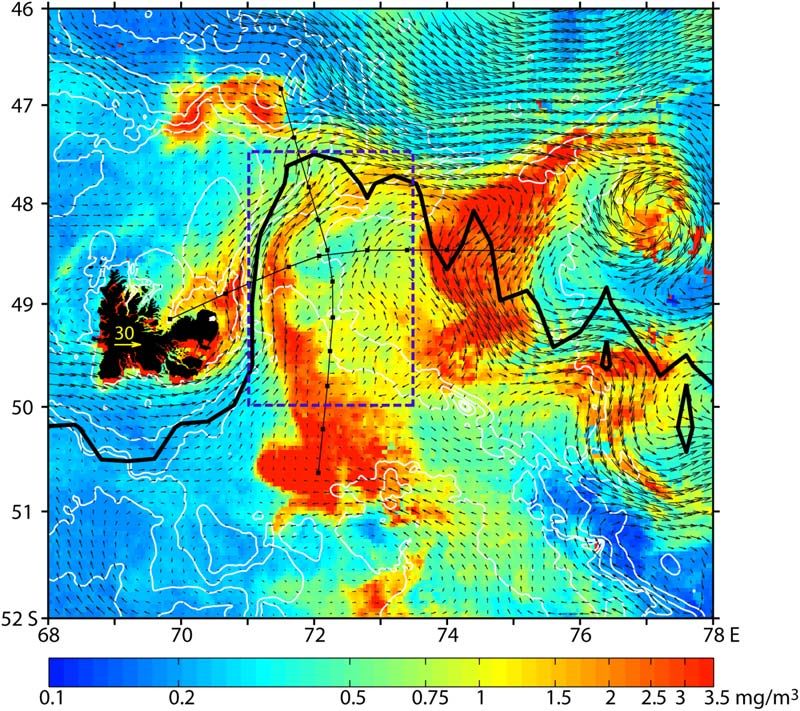
Journal of Geophysical Research: Oceans                                                                                10.1002/2014JC010061

Figure 2. (a–c) Property distributions at 200 m and (d) an altimetry-derived mean surface dynamic topography in the Kerguelen region. Thick white lines in Figures 2a–2c represent the
2000 m isobath and thick black lines in Figure 2d indicate three major ACC fronts. The red rectangular area corresponds to the KEOPS2 cruise area that is presented in Figure 3. Adapted
from Park and Vivier [2011].

                                              iron from the plateau likely plays an important role in the annually recurrent bloom around the Kerguelen
                                              Islands [e.g., Blain et al., 2007; Bown et al., 2012], thus having a potential implication for the air-sea CO2 flux
                                              and climate. In view of the recent increasing interest of the Kerguelen region for climate-related studies, the
                                              hitherto-proposed diverse locations of the PF in our study area appear to create great confusion [Roquet
                                              et al., 2009], so it is time to erase this long-lasting ambiguity. Here we would like to determine an up-to-
                                              date climatological location of the PF around the Kerguelen Islands from all available quality-controlled
                                              hydrographic data and based on the widely accepted best criteria of the front, before validating the results
                                              in comparison with the extensive survey data from the KEOPS2 cruise.
                                              Based on the in situ hydrographic and current measurements as well as drifters tracking data during the
                                              cruise, together with historical hydrographic data, satellite chlorophyll images, and altimetry-derived surface
                                              velocity fields, a precise analysis of the PF is conducted in relation to the distribution of surface/subsurface
                                              water masses, the temporal evolution of its frontal position, and associated frontal exchange of water

PARK ET AL.                                                                      C 2014. The Authors.
                                                                                 V                                                                                                6577
Journal of Geophysical Research: Oceans                                                                   10.1002/2014JC010061

                  Figure 3. (a) Map showing the 2011 KEOPS2 CTD stations (red dots) on (or close to) two N-S and E-W transects (red lines) superimposed
                  on the detailed bathymetry. The blue line represents the MAKER XCTD transect made in January 2011. Isobaths are every 200 m except for
                  100 m. The seabed shallower than 600 m (200 m) is lightly (darkly) shaded. Isobaths of 100 m and every 1000 m are thickened.

                  masses. A circulation schematic of surface/subsurface waters is also suggested based on artificial particle
                  trajectories tracked from fine-resolution altimetric velocity time series fields.

                  2. Data
                  2.1. In Situ CTD and LADCP Data
                  The in situ hydrographic data used in this paper originate from the October–November 2011 KEOPS2 cruise
                  carried out aboard the R/V Marion Dufresne in the northeastern plateau/slope area immediately east off the
                  Kerguelen Islands (Figure 3). We used a total of 25 full-depth CTD (Conductivity-Temperature-Depth) pro-
                  files gathered using two sets of Sea-Bird SBE 9plus sensors (red squares in Figure 3). Many of these stations
                  were reoccupied several times for shallow casts to have biogeochemical samplers and microstructure turbu-
                  lence measurements. During CTD casts, horizontal current profiles throughout the water column were
                  obtained from a pair of downward and upward looking RD Instrument 300 kHz lowered acoustic Doppler
                  current profilers (LADCPs) attached to the rosette. The R/V Marion Dufresne was also equipped with two
                  ship-borne acoustic Doppler current profilers (SADCPs): a ‘‘narrow band’’ 150 kHz and an ‘‘Ocean Surveyor’’
                  75 kHz which provided horizontal currents as a function of depth in the first 300 m and 700 m, respectively.
                  These CTD/LADCP stations were mostly located on two near-perpendicular transects (red lines) in the area
                  where the V-shaped continental slope changes its orientation from the southeast-northwest direction in the
                  southeast of the Kerguelen Islands to the southwest-northeast direction at the northeastern corner of the
                  Kerguelen Plateau. The latter connects with the Gallieni Spur, a narrow submarine ridge which separates
                  the Kerguelen-Amsterdam passage to the north from the Australian-Antarctic Basin to the south. The north-
                  south transect (TNS) cuts the shelf areas found southeast and northeast of the islands, which are separated
                  by the deeper inner corner of the V-shaped slope. The southernmost station A3 is the reoccupation of the

PARK ET AL.                                         C 2014. The Authors.
                                                    V                                                                                             6578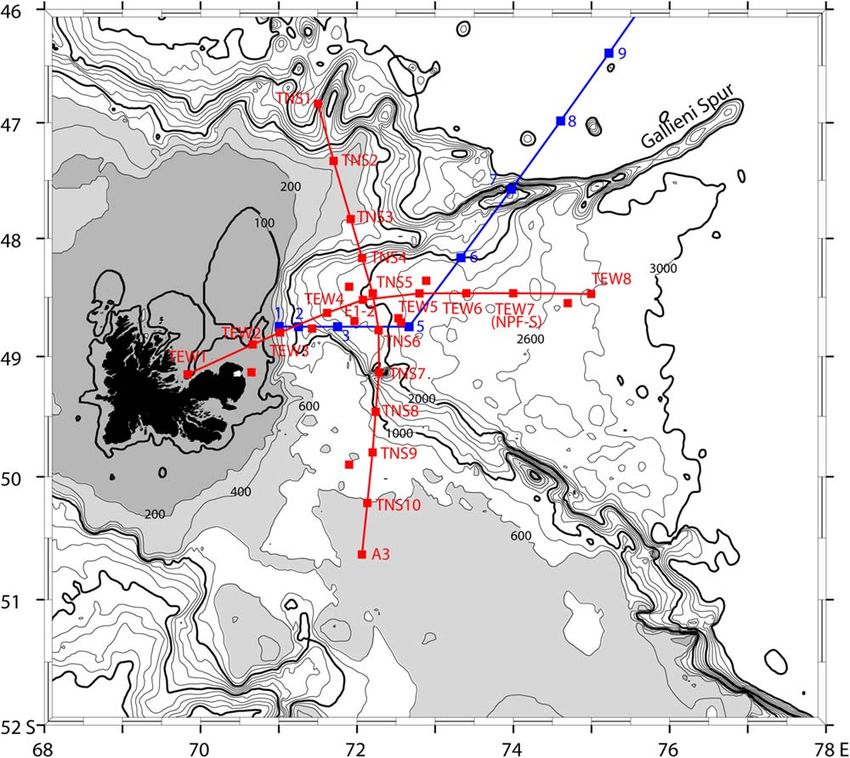
Journal of Geophysical Research: Oceans                                                             10.1002/2014JC010061

                                                                                                        KEOPS1 time series station of the
                                                                                                        same label. The east-west transect
                                                                                                        (TEW) starts from the Baie de
                                                                                                        Baleiniers near the north central
                                                                                                        coast of islands, crosses the shal-
                                                                                                        low shoal less than 100 m east-
                                                                                                        ward closely along the axis of the
                                                                                                        V-shaped slope to the open
                                                                                                        ocean.
                                                                                                             The CTD casts were supple-
                                                                                                             mented with 22 rosette water
                                                                                                             samples for analysis of salinity
                                                                                                             and dissolved oxygen. The CTD
                                                                                                             sensors were calibrated before
                                                                                                             and after the cruise, and the post-
                                                                                                             cruise validated data for pressure,
                                                                                                             potential temperature, salinity,
                                                                                                             and dissolved oxygen are thought
                  Figure 4. Trajectories of drifters deployed during the KEOPS2 cruise and satellite tracked
                                                                                                             to be accurate within 63 dbar,
                  until January 2012. Black dots represent the drifter launch points.                        60.003 C, 60.005 psu, and
                                                                                                             60.005 ml l21, respectively. The
                  LADCP measurements were processed following the method described by Visbeck [2002] and constrained
                  in the surface layers by the SADCP measurements. The SADCP data were processed using the CODAS-3 soft-
                  ware freely available at http://currents.soest.hawaii.edu/. The processing procedure is described in Hummon
                  and Firing [2003].

                  2.2. Drifters Tracking Data
                  During the KEOPS2 cruise, a total of 48 drifters were deployed in October and November 2011. These
                  drifters met the WOCE/SVP (World Ocean Circulation Experiment/Surface Velocity Program) standards and
                  were designed to follow water motion at 15 m. An example of trajectories of drifters tracked until 11 Janu-
                  ary 2012 is shown in Figure 4. We used the drifters-derived velocity data together with those from altimetry
                  to construct the realistic circulation pattern of the study area during the cruise period, which will be dis-
                  cussed in section 4.

                  2.3. Satellite Altimetry and Chlorophyll Concentration Data
                  The KEOPS2 cruise benefited from regionally optimized satellite products provided in quasi-real time by
                  AVISO/CLS (Archivage Validation Interpretation des donnees des Satellites Oceanographiques/Collecte
                  Localisation Satellites) with support from CNES (Centre National d’Etudes Spatiales). These products include
                  multisatellite altimetry-derived sea surface height anomalies at a 1/8 resolution (compared to 1/3 resolu-
                  tion of the standard AVISO product), a regional updated Mean Dynamic Topography, and 1/25 Chlorophyll
                  Modis and Meris composite images. We have used the altimetric data for constraining the drifters tracking
                  data for constructing the mean surface geostrophic current field during the cruise (section 4) as well as
                  tracking artificial water particles seeded in the upstream of the study area to identify the pathways and
                  sources of surface/subsurface waters advected into the study area (section 6). The high-resolution chloro-
                  phyll concentration images appear as an excellent marker of the fronts and filaments in our study area, so
                  that they were used here as supporting evidence for the frontal circulation determined from the combined
                  hydrography, altimetry, and drifters tracking data (section 4).

                  2.4. Historical Hydrographic Data
                  In order to better interpret the KEOPS2 observations within the general circulation context and to accurately
                  determine the climatological PF location, we used all available historical and recent hydrographic data in
                  the study area. These include not only conventional hydrographic data but also autonomous Argo float-
                  derived CTD profiles. We also included still-unpublished XCTD (expendable CTD) data collected annually
                  between 2011 and 2013 as part of the MAKER project, an IPEV (Institut Paul Emile Victor)-sponsored multi-
                  year monitoring project in the Kerguelen area. The blue section in Figure 3 shows a part of the XCTD section

PARK ET AL.                                       C 2014. The Authors.
                                                  V                                                                                       6579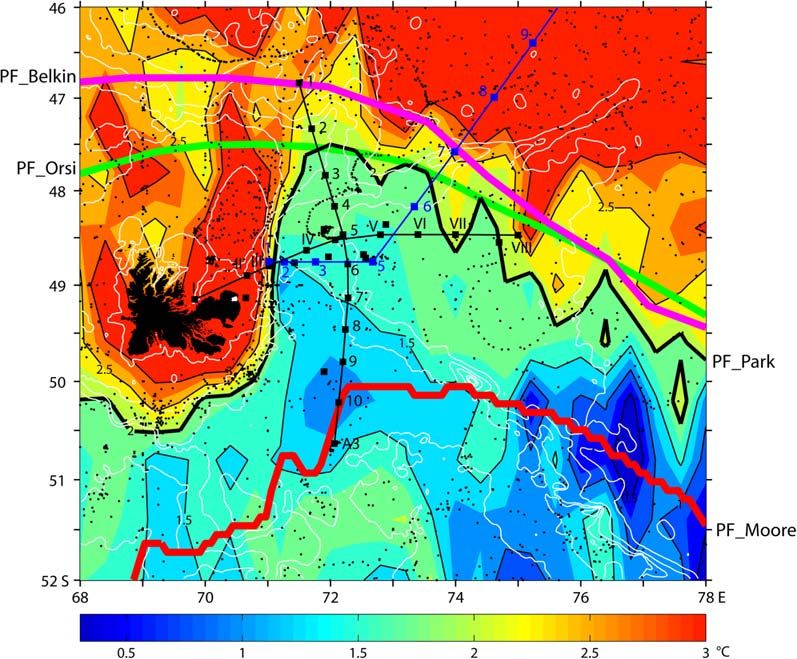
Journal of Geophysical Research: Oceans                                                             10.1002/2014JC010061

                                                                                                                 made in January 2011,
                                                                                                                 which will be referenced
                                                                                                                 in section 5 when inter-
                                                                                                                 preting the KEOPS2 CTD
                                                                                                                 data in terms of cross-
                                                                                                                 frontal exchange of water
                                                                                                                 masses.

                                                                                                                 3. Determination of
                                                                                                                 the Polar Front
                                                                                                                     3.1. An Up-To-Date
                                                                                                                     Determination of the Cli-
                                                                                                                     matological PF From
                                                                                                                     Hydrographic Data
                                                                                                                     Before determining the
                                                                                                                     exact location of the PF in
                                                                                                                     the study area, it may be
                                                                                                                     instructive to briefly recall
                                                                                                                     the two key criteria of the
                                                                                                                     front. The most critical
                  Figure 5. Temperature field at the subsurface temperature minimum layer. Small dots represent       definition of the PF is
                  in situ data points. The 2 C isotherm corresponding to our PF (PF_Park) is shown by a thick black
                                                                                                                     based on its hydrographic
                  line. Also shown by colored thick lines are three PF locations suggested by other authors.
                                                                                                                     characteristics at the
                                                                                                                     northernmost boundary
                  of the Antarctic zone, which can be best characterized by the presence of the Winter Water, a subsurface
                  water mass formed during the precedent winter season and residing underneath the summer mixed layer
                  without changing much its initial winter characteristics. The most traditional definition accounting for this
                  hydrographic feature corresponds to the northern limit of the subsurface temperature minimum (Tmin) of
                  2 C [Botnikov, 1963], which has been widely adapted in the literature [e.g., Whitworth and Nowlin, 1987;
                  Park et al., 1993; Orsi et al., 1995; Belkin and Gordon, 1996, among others]. The second important criterion of
                  the PF, though applicable equally to other fronts, relies on its dynamic characteristics such as a distinct
                  band of strong currents or velocity shear associated with the baroclinic pressure gradient, large-scale infor-
                  mation of which can be obtained from maps of dynamic topography from hydrography or altimetry. The
                  ideal PF location should be the one that satisfies the above two hydrographic and dynamic criteria,
                  although the former criterion is prerequisite. If only the latter dynamic criterion is taken into consideration,
                  however, there is no guarantee that the front determined as such corresponds really to the PF because
                  other fronts (e.g., SAF or SACCF) may equally satisfy that criterion [e.g., Gilles, 1994; Sokolov and Rintoul,
                  2009]. Sometimes, a distinctive meridional gradient of temperature has been used as a criterion, especially
                  using the satellite sea surface temperature data [Moore et al., 1999]. However, a similar precaution as for the
                  above dynamic criterion should be kept in mind.
                  Figure 5 illustrates a map of subsurface Tmin determined in the 100–300 m depth range using all
                  available historical and recent hydrographic data, including 1298 data points from CTD, 877 points from
                  Argo floats, and 31 points from XCTD observations. The PF corresponding to the 2 C isotherm of Tmin is
                  emphasized by a thick black line marked as PF_Park, which is compared with other definitions by Belkin and
                  Gordon [1996], Orsi et al. [1995], and Moore et al. [1999], marked as PF_Belkin, PF_Orsi, and PF_Moore,
                  respectively.
                  Consistent with some previous work [e.g., Park et al., 2008c; Park and Vivier, 2011], the PF_Park separates
                  the cold Winter Water (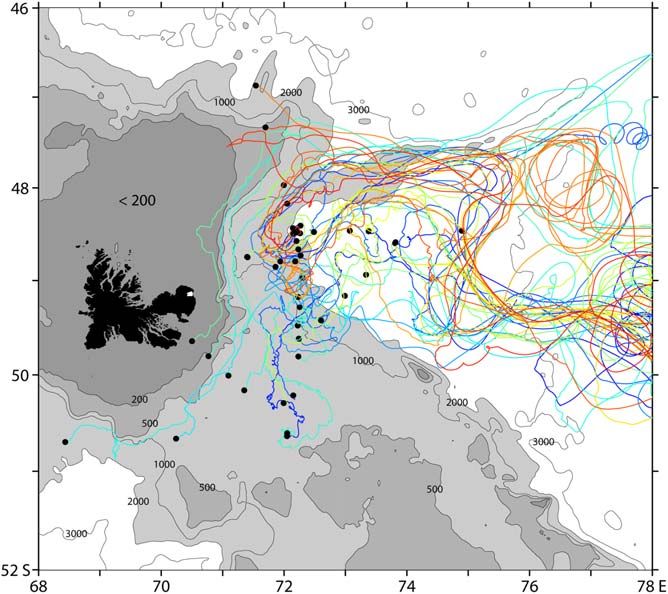
Journal of Geophysical Research: Oceans                                                    10.1002/2014JC010061

                  Winter Water in the deep off-plateau area northeast of the islands, suggesting no direct zonal circulation
                  connecting these two adjacent areas. The PF_Park here exhibits rather an abrupt northward deflection
                  over a meridional distance over 300 km from its southernmost position (50 300 S, 69 E) south of the
                  islands to its northernmost position (47 300 S, 72 E) at the northeastern corner of the Kerguelen Plateau,
                  from which the front retroflects gradually back to the south. This northward deflection of the PF along
                  the eastern slope is in good agreement with strong slope currents identified there from a systematic
                  analysis of drifts of demersal longlines between their deployment and recovery positions for the Kergue-
                  len Patagonian toothfish fisheries [Park et al., 2008a].
                  In contrast, the PF_Orsi and PF_Belkin round the Kerguelen Islands from the north (not south), passing
                  across the shallow shelf or along the northern slope, which are located farther north of the PF_Park by as
                  much as 300–400 km, although they become much closer (within 50–100 km) to the PF_Park in the down-
                  stream area of the plateau. On the other hand, the PF_Moore is found farther south by 200–300 km relative
                  to the PF_Park, passing through the much colder (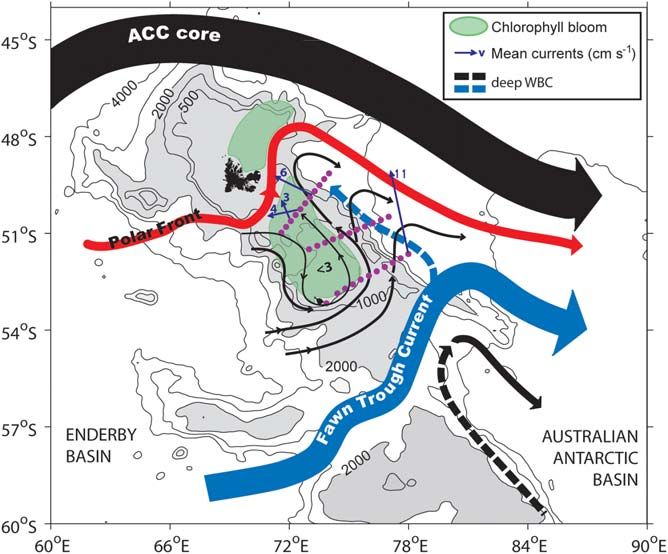
Journal of Geophysical Research: Oceans                                                                     10.1002/2014JC010061

                  Figure 6. Mean surface velocity field during the KEOPS2 cruise constructed from the combined data sets of drifter-derived currents within
                  the dashed rectangular area and altimeter-derived currents outside the rectangular area. The velocity scale for 30 cm s21 is shown on the
                  Kerguelen Islands. See the text for the details of the methodology. Composite chlorophyll images (color shading) during the KEOPS2
                  cruise, the two transects (thin lines), and the PF_Park (thick black line) from Figure 5 are superimposed.

                  3.2. Mean Surface Geostrophic Velocity Field From Drifters and Altimetry
                  In order to get the reliable information on a large-scale surface circulation pattern in the study area during
                  the cruise, we have synthesized all drifters-derived near-surface velocity vectors obtained during the cruise
                  period within the dashed rectangular area of Figure 6 and mean altimetry-derived surface velocity field for
                  the domain outside the rectangular area. The drifter-derived velocity data represent the composite of indi-
                  vidual vectors for the 1 month period from 19 October to 19 November, while the altimetric velocities have
                  been averaged over the same period at each altimetric grid points. These combined data sets have under-
                  gone an optimal interpolation on a fine grid (1/20 lat 3 1/12 lon) based on a stream function method to
                  generate a nondivergent geostrophic velocity field [Bretherton et al., 1976] (Figure 6). In order for further
                  increasing the credibility of these velocity fields, the composited chlorophyll concentration (color shading)
                  over the same period is superimposed.
                  It is remarkable that both the velocity and chlorophyll fields follow coherently the hydrography-derived PF
                  location (thick black line). This is most clear for the northward deflecting PF along the eastern escarpment
                  east of the Kerguelen Islands and its eastward turning at the northeastern corner of the Kerguelen Plateau.
                  The PF here is associated with a concentrated strong flow that is accompanied with a narrow band of clear-
                  cut chlorophyll-poor waters advected from the far upstream in the southwest of the islands. Immediately
                  north of the PF are the southward bending strong currents along the base of the northern escarpment,
                  accompanied with a band of chlorophyll-poor waters. When Figure 6 is compared with Figure 2, it is
                  not difficult to recognize that these southward bending strong currents correspond in effect to the SAF.
                  Merging of the PF and SAF, with the plume-like flow emanating from the shallow Kerguelen shelf being
                  sandwiched between them, occurs along the northern flank of the Gallieni Spur. The southward retro-
                  flecting PF in the eastern half of the study area is associated with highly meandering, much stronger
                  and broader southward flow, probably because of the inclusion of the SAF waters. This southward bend-
                  ing PF generally follows the meandering southward flow but the correspondence between the two fea-
                  tures is significantly less compared to the northward flowing PF in the west. This is probably related to
                  highly time-varying energetic mesoscale meanders frequently observed in the eastern half of the study
                  area, as will be seen later. Also remarkable here is that the strong flow is mostly associated with well-

PARK ET AL.                                          C 2014. The Authors.
                                                     V                                                                                               6582
Journal of Geophysical Research: Oceans                                                                    10.1002/2014JC010061

                                                                                                           developed high-chlorophyll patches,
                                                                                                           in great contrast to the chlorophyll-
                                                                                                           depleted band along the axis of the
                                                                                                           western PF.
                                                                                                               Finally, we remark that there appears
                                                                                                               some noticeable secondary inner cir-
                                                                                                               culation, showing a dominant north-
                                                                                                               ward flow in the eastern half of the
                                                                                                               rectangular area. Another remarkable
                                                                                                               feature is observed in the central part
                                                                                                               where the N-S and E-W transects
                                                                                                               cross. Here the drifters solution
                                                                                                               reveals a nearly stagnant feature
                                                                                                               associated with a local minimum in
                                                                                                               chlorophyll. As this central part of the
                                                                                                               study area had been considered dur-
                       Figure 7. Zoom of the drifter-derived velocity field in the central part of the dashed   ing the cruise as the key area for
                       rectangular area of Figure 6a. Two dashed ellipses are superimposed to help detect-
                                                                                                               repeating a number of biogeochemi-
                       ing a twin-like secondary circulation pattern in the stagnant central part of the area.
                                                                                                               cal stations, a zoom of the detailed
                                                                                                               local velocity field is shown in Figure
                       7. There is clearly a weak small-scale (
Journal of Geophysical Research: Oceans 10.1002/2014JC010061
Figure 9. (a–c) Property sections of the upper 1000 m along the N-S transect during the KEOPS2 cruise and (d) the corresponding full-
depth T-S diagram. The contour interval in Figures 9a–9c is 0.2 C for potential temperature except for dashed supplementary isotherms,
0.1 psu for salinity, and 0.05 kg m23 for potential density. The area with a temperature less than 2 C is shaded in Figure 9a. In Figure 9d,
some selected station numbers are indicated near the corresponding T-S curves.
stations. It is also likely that this central part corresponds to the latest arrival of water particles originating
from the shallow plateau, which may explain the retarded bloom there compared to the outer boundary of
the PF circulation system (see Figure 6).
3.3. Chlorophyll Concentration as an Excellent Marker of the PF
The spatial distribution of chlorophyll concentration during the cruise period is remarkably coherent with
the PF location especially in the western half of the study area. More complete information on the chloro-
phyll concentration can be seen in monthly composite maps for the late spring to early summer period of
2010/2011 and 2011/2012 (Figure 8). Temporally, the spring bloom over the study area peaked in Novem-
ber and faded gradually through December and January, although the degree of fading depends on the
place and year. Spatially, the chlorophyll-rich plume from the shallow shelf north of the Kerguelen Islands
persisted until January especially in 2012, while the one within the inner part of the cyclonically meandering
PF in the off-plateau completely disappeared. The persistent chlorophyll plume emanating from the north-
ern Kerguelen shelf compared to the earlier fading bloom in the off-plateau area makes a clear distinction
of the outer boundary of the PF, as most clearly evident in Figures 8b and 8f. Moreover, the northward
PARK ET AL. C 2014. The Authors.
V 6584Journal of Geophysical Research: Oceans 10.1002/2014JC010061
Figure 10. Same as Figure 9, except for the E-W transect.
deflecting PF immediately east of the islands and its upstream signature in the south of the islands are
obvious in all monthly maps by the presence of a band of local chlorophyll minimum originating from the
chlorophyll-poor upstream waters southwest of the islands. Consequently, the chlorophyll concentration
can be efficiently used as an excellent marker of the PF location in our study area, which is also remarkably
coherent with the results obtained from hydrography and velocity fields (Figures 5 and 6).
4. In Situ Observations of the PF During the KEOPS2 Cruise
4.1. Property Sections and Water Mass Analysis
The vertical property sections of the upper 1000 m and the full-depth T-S diagram along the N-S and E-W
transects are shown in Figures 9 and 10, respectively. Along the N-S transect, an abrupt property change in
the surface layer appears between TNS2 and TNS3, which coincides also with the northern limit of the Tmin
of 2 C at 200 m (Figure 9a), indicating undoubtedly the existence of the PF there. This PF from in situ hydro-
graphic data is in excellent agreement with its climatological position seen in Figure 5. It also agrees well
with the PF_Orsi but completely disagrees with the PF_Belkin and PF_Moore. To the north of the PF, on the
other hand, no water colder than 2 C appears and the surface water becomes distinctively warmer
PARK ET AL. C 2014. The Authors.
V 6585Journal of Geophysical Research: Oceans 10.1002/2014JC010061
(T > 3 C), fresher (S < 33.8), and lighter (rt < 26.8 kg m23) than that south of the PF. This discontinuity in
property distribution across the PF is much clearer in the T-S diagram (Figure 9d) which shows two different
types of T-S relationships between the stations north of the PF (TNS2 and TNS1) and those south of the PF,
indicating different pathways or origins of waters. To the south of the PF, the Winter Water is clearly seen
by a well-defined Tmin between 1.5 and 2 C, with a mean salinity around 34.0 and a mean potential density
of 27.2 kg m23. At stations southeast of the Kerguelen Islands (TNS9, TNS10, A3), the water colder than 2 C
reaches the surface, while at further northern stations it resides below the surface mixed layer (Figure 9a),
suggesting that the Winter Water there must have been advected from the south rather than formed in
place. The coldest Winter Water on the transect is found at TNS10, consistent with the climatology
(Figure 5), which suggests that the major pathway of the northward advection of the Winter Water formed
in the Antarctic zone south of the Kerguelen Islands passes close to TNS10.
Also, we observe at 700 m a subsurface temperature maximum (Tmax) or the Upper Circumpolar Deep
Water having a representative potential density of 27.6 kg m23 (see Figure 9d). This Tmax water must have
come either from the south through the Fawn Trough or from the north through the Kerguelen-Amsterdam
passage because the shallow topography of the northern Kerguelen Plateau prevents such a deep water
mass from directly overpassing the plateau. It is interesting to note that the northernmost extent of the
Tmax of 2.3 C coincides with that of the Tmin of 2 C (Figure 9a), thus also marking the PF location. In this
sense, TNS6 is atypical, showing an isolated Tmax warmer than 2.3 C centered at 550 m, indicative of an
influence by the water north of the PF. This is further supported by slightly warmer waters at the surface
and in the Tmin layer at TNS6 compared to surrounding stations.
Along the E-W transect (Figure 10), the Winter Water (having a core temperature < 2 C near 200 m) is con-
fined between TEW3 and TEW6. This feature together with a strong vertical shear implied by steeply sloping
isopycnals seen in the potential density section (Figure 10c) permits us to place the PF in the vicinity of
these two stations. This Winter Water is believed to have been advected from the southeast of the Kergue-
len Islands as discussed. On the other hand, two shallow (80 m) near-coastal stations located north of the
Kerguelen Islands (TEW1, TEW2) are clearly distinguished from other stations especially by their very low
salinity (33.6–33.8) and low density (3.2 C) centered at 200 m, which is in stark contrast with the more eastern
station TEW8 where the subsurface water characteristics are close to those at TEW6. This abnormal feature
at TEW7 is clearly indicated in the T-S diagram by a spectacular along-isopycnal intrusion of warm water
(Journal of Geophysical Research: Oceans 10.1002/2014JC010061
Figure 11. Vertical section of velocities (cm s21) perpendicular to (a) the N-S transect and (b) the E-W transect. The cumulative transport
(Sv) on each transect is given in the top figures. The contour interval is 5 cm s21 and the gray shaded areas correspond to westward veloc-
ities in Figure 11a and southward velocities in Figure 11b.
fine grid of 0.1 in latitude or longitude and 16 m in vertical, with zero velocities set on grid points below
the bottom. Across the N-S transect (Figure 11a), a broad and weak (Journal of Geophysical Research: Oceans 10.1002/2014JC010061
Figure 12. Same as Figure 9, except for the MAKER XCTD transect shown in Figures 3 and 5.
the total northward transport associated with the cyclonically circulating PF system of the area, including 6 Sv
associated with the northward PF attached to the inner slope shallower than 1500 m west of TEW4, suggest-
ing that the remaining 9 Sv should travel over the deeper outer slope. The net southward transport of 22 Sv
at TEW8 may suggest that the southward PF here is tightly merged with a southern branch of the SAF carrying
the same transport and bending southward across the Gallieni Spur (see Figure 6).
5. Temporal Variability of the Frontal Circulation
An abnormal warm core in the temperature minimum layer at TEW7 has been discussed in the previous sec-
tion (Figure 10). This abnormal feature disappears completely when station NPF-S was reoccupied 6 days
later. In order to understand this change in vertical property distribution in terms of temporal variability of
the frontal circulation, we first examine the property sections in the upstream area from the January 2011
MAKER XCTD transect (Figure 12). The geographical positions of the XCTD stations up to station 9 are given
in Figure 3. The PF crossed twice this transect: first, between stations 1 and 2, consistent with the observa-
tions on the KEOPS2 E-W transect and climatology (see Figure 5), and then between stations 6 and 7 across
the Gallieni Spur, also consistent with the climatology. The SAF, which marks an abrupt deepening below
400 m of the subsurface salinity minimum to form the Antarctic Intermediate Water, can be placed near sta-
tion 8, which coincides also with the surface salinity minimum (Figure 12b). The PF and SAF here are sepa-
rated by 140 km only, which constitutes probably one of the closest convergence zones of the two fronts in
PARK ET AL. C 2014. The Authors.
V 6588Journal of Geophysical Research: Oceans 10.1002/2014JC010061
Figure 13. (a) Same as Figure 10a, except for NPF-S that is the repeated station of TEW7 6 days later. (b) Comparison of T-S curves at NPF-
S, TEW7, and the MAKER XCTD station 8.
the Southern Ocean. North of station 9 is the Subtropical zone, whereas the Subantarctic zone here is practi-
cally nonexistent due to a tight merging of the SAF and Subtropical Front [Park et al., 1993].
Figure 13a is the temperature section on the E-W transect, which is same as Figure 10a except that the CTD
measurements at TEW7 are replaced by the repeated measurements noted as NPF-S. The abnormal subsur-
face warm core observed a week before at the same place (TEW7) is completely absent now, and the transi-
tion of subsurface temperature minimum across the PF is much more gradual compared to that in Figure
10a. Comparison of T-S curves at NPF-S and TEW7 in Figure 13b indicates that the two stations exhibit
nearly same T-S relationships in the water column except in the Tmin layer centered at the potential density
of 27.2 kg m23. In this Tmin layer, the T-S curve at NPF-S straddles the 2 C isotherm due to its proximity to
the PF, while the T-S curve at TEW7 approaches closely to that of the MAKER XCTD station 8 placed near the
SAF (Figure 12). This suggests that prior to the occupation of TEW7, a southern branch of the SAF must
have flown so close to TEW7 that a cross-frontal injection or double-diffusive intrusion [e.g., Ruddick and
Turner, 1979] of warm and saltier subsurface water associated with the SAF could occur. This indicates also
highly time-varying frontal circulation of the area, which will be examined below.
In order to see the temporal variability of the frontal circulation associated with the southward retroflecting
PF in the eastern half of the study area, three selected snapshots of altimetric surface currents are shown
for the period before, during, and after the occupation of TEW7 in Figures 14a, 14b, 14c, respectively. In all
maps, the northward flowing PF along the inner slope east of the Kerguelen Islands is visible by a band of
moderate northward flow. The SAF is associated with the anticyclonically curving strongest flow north of
the Gallieni Spur. Recall that on the MAKER XCTD transect (blue line), we have placed the SAF near station 8
and the PF between stations 6 and 7 (see Figure 12). This strong convergent flow between the SAF and PF
becomes diverging into three branches to the east of 75 300 E; the main northernmost branch, which is
most likely associated with the SAF core, bends northeastward along the Gallieni Spur; the second branch
flows eastward crossing the spur and bends southward to form an energetic cyclonic eddy (centered near
48 S, 77 E); the third southernmost branch, which is closest to the PF, bends southward after crossing the
spur at 75 300 E. These are quasi-permanent features, however, the downstream flow of the third branch is a
noticeable time-varying meandering pattern (see dashed red lines).
Three distinct flow patterns associated with the eastern PF appear in Figure 14. About a week before the
occupation of TEW7, the third southernmost branch executed an abrupt westward U-turn at 48 S, 76 E to
flow westward before retroflecting anticyclonically just west of TEW7 to flow southeastward (Figure 14a).
During the occupation of TEW7, the above S-shaped meander broke down and was short-circuited by two
separate branches (Figure 14b); an upstream southward branch cutting the MAKER XCTD transect between
PARK ET AL. C 2014. The Authors.
V 6589Journal of Geophysical Research: Oceans 10.1002/2014JC010061
stations 6 and 7 and the KEOPS2 E-W tran-
sect between TEW6 and TEW 7, similar to
what observed in Figures 12 and 10, and
an eastern southwestward branch passing
just east of TEW8. The abnormal subsurface
warm core observed at TEW7 is most likely
related to the remnant SAF subsurface
water previously advected into the vicinity
of TEW7 by the S-shaped meander shown
in Figure 14a (red dashed line). The frontal
circulation changed continuously, and after
9 days since the occupation of TEW7 (Fig-
ure 14c), there appeared a near zonal flow
south of the E-W transect in addition to a
southward branch originating from the
Gallieni Spur and passing just east of
TEW8. The reoccupied station NPF-S, which
was made a week after TEW7, did not
reveal any abnormal feature (see Figure
13), probably because the subsurface
warm core previously observed at TEW7
must have been swept away by the above-
mentioned near zonal flow. Consequently,
the exact location of the PF in the eastern
half of the study area should vary substan-
tially due to continually evolving meander-
ing flow, which may also favor the
intermittent cross-frontal exchange with
subsurface waters of the SAF origin.
6. Summary and Discussion
We have determined an up-to-date loca-
tion of the PF around the Kerguelen Islands
from hitherto-accumulated abundant his-
torical and recent hydrographic data
according to the traditional definition of
the front following Botnikov [1963], i.e., the
northern limit of the subsurface Tmin of
2 C. This hydrography-derived climatologi-
cal PF location has been systematically vali-
dated against the high-quality CTD/LADCP
measurements and the satellite tracking of
48 surface drifters deployed during the
recent KEOPS2 cruise. We have shown that
the northern limit of the subsurface Tmax
of 2.3 C marks equally well the PF. Further
validation has been successfully conducted
against satellite chlorophyll images and
altimetry-derived velocity fields. All these
in situ and satellite data sets confirm our
Figure 14. Snapshots of altimetric velocity field (a) 8 days before and (c) 9 climatological PF with a high degree of
days after (b) the occupation of TEW7. Arrows are velocity vectors and the
color shading represents the velocity intensity. Dashed red lines are superim- credibility, suggesting a stable geographi-
posed for clarifying the time-varying meandering PF. cal location of the contemporaneous PF
PARK ET AL. C 2014. The Authors.
V 6590Journal of Geophysical Research: Oceans 10.1002/2014JC010061
Figure 15. (a) Trajectories of artificial particles in the Kerguelen region forward tracked using the altimetric velocity time series fields. Initial positions of particles are indicated by cyan
dashed lines. See the text for the details of the methodology. The SAF and PF are shown by thick black dashed lines. (b) A schematic of the circulation of surface/subsurface waters drawn
based on Figure 15a. The abbreviations are Antarctic Surface Water (AASW), Polar Frontal Surface Water (PFSW), Subantarctic Surface Water (SASW), and Subtropical Surface Water (STSW).
around the Kerguelen Islands. Consistent with our previous work, the newly determined PF location rounds
the Kerguelen Islands from the south, executing a permanent cyclonic meandering in the off-plateau area
immediately east of the Kerguelen Islands. Due to the northward deflection of the PF along the eastern
escarpment east of the Kerguelen Islands, the shallow plateau waters southeast of the islands advance as
far north as the northeastern corner of the Kerguelen Plateau, possibly affecting the regional primary pro-
duction that has an important climatic implication.
By way of discussion of our findings within the context of the general circulation in the Kerguelen
region, we present in Figure 15 a map of trajectories of artificial water particles tracked using the alti-
metric velocity time series and a resultant schematic of circulation of surface/subsurface waters of differ-
ent origins. The altimetric velocity time series used for this tracking are those of fine resolution (1 day
resolution in time and 1/8 in space for the 6 months of period starting from 1 April 2011) specially pre-
pared for the KEOPS2 cruise by the AVISO/CLS. We applied a forward tracking algorithm similar to that
employed by Filippi et al. [2010], which uses a simple prediction-correction scheme. Artificial particles
are seeded at every 0.1 (cyan dashed lines in Figure 15a) along 63 E between 45 and 54 S in the
upstream area of the Kerguelen Plateau, along 50 300 S between 63 and 75 E south of the Kerguelen
Islands, and along 52 S between 73 and 77 E north of the Heard Island. Different colors are used for
emphasizing different pathways or sources of particles. It is remarkable that most trajectories forming
the PF (purple lines) originate from the southwest of the Kerguelen Islands south of 50 S. However, the
particles impinging on the Kerguelen Plateau from the west between 51 and 53 S do not show any
well-organized zonal flow directly crossing over the plateau but they are hindered by topography,
revealing a very irregular and stagnant eddying flow; only a few trajectories pass directly to the south
of the Heard Island. The circulation around the latter island is clearly anticyclonic (blue lines) and
extends northwestward over the eastern plateau to reach as far north as the northernmost reach of the
PF at the northeastern corner of the Kerguelen Plateau.
The shallow shelf (Journal of Geophysical Research: Oceans 10.1002/2014JC010061
These altimetric particle trajectories are remarkably consistent with the frontal circulation discussed in the
previous sections. A schematic of the regional circulation of surface/subsurface waters (Figure 15b) is
intended for providing the reader with a larger scale perspective for better understanding the pathways or
origins of different water masses flowing into the off-plateau study area east of the Kerguelen Islands. It is
clear that most of the KEOPS2 stations except for a few stations at the transect extremities encounter the
Antarctic Surface Water (AASW) originating from the shallow shelf surrounding the Heard Island. This south-
ern shelf water is completely separated by the PF from the northern shelf water north of the Kerguelen
Islands, which is embedded within the Polar Frontal Surface Water (PFSW) rounding the northern shelf
along the northern escarpment of the Kerguelen Plateau. These surface/subsurface waters coming from dif-
ferent places meet and undergo eddy mixing along the southward retroflecting PF to the east 73 E.
Finally, we hope that the newly determined PF and its associated circulation shall serve as a reference for
better interpreting other variables and biogeochemical parameters measured during the KEOPS2 cruise and
for erasing definitely the long-standing confusion about the PF location in the Kerguelen region. In addition,
considering an increasing volume of hydrographic data in the Southern Ocean especially thanks to Argo
float measurements, reliable satellite altimetry, and the urgent need for a precise determination of the PF
for climate-related studies, a similar investigation as the present work is warranted to extend to other critical
ACC frontal zones, in particular in the vicinity of islands or prominent topographic features.
Acknowledgments References
We thank the IPEV for financial and
Belkin, I. M., and A. L. Gordon (1996), Southern Ocean fronts from the Greenwich Meridian to Tasmania, J. Geophys. Res., 101, 3675–3696.
logistical support and the captain and
Blain, S., et al. (2007), Effect of natural iron fertilization on carbon sequestration in the Southern Ocean, Nature, 446, 1070–1074, doi:
crew of the R/V Marion Dufresne for
10.1038/nature05700.
their professional contributions to
Botnikov, V. N. (1963), Geographical position of the Antarctic convergence zone in the Pacific Ocean, Sov. Antarct. Exped. Inf. Bull., Engl.
various field experiments during the
Transl., 4, 324–327.
2011 KEOPS2 cruise. The MAKER
Bown, J., M. Boye, P. Laan, A. R. Bowie, Y.-H. Park, C. Jeandel, and D. M. Nelson (2012), Imprint of a dissolved cobalt basaltic source on the
project has benefited the logistic and
Kerguelen Plateau, Biogeosciences, 9, 5279–5290.
financial support from the IPEV and
Bretherton, F., R. Davis, and C. Fandry (1976), A technique for objective analysis and design of oceanographic experiments applied to
CNES. The altimeter and chlorophyll
MODE-73, Deep Sea Res. Oceanogr. Abstr., 23, 559–582.
products for the Kerguelen area were
Filippi, J.-B., T. Komatsu, and K. Tanaka (2010), Simulation of drifting seaweeds in East China Sea, Ecol. Informatics, 5, 67–72.
produced by Ssalto/Duacs and CLS
Gilles, S. T. (1994), Mean surface height of the Antarctic Circumpolar Current from Geosat data: Method and application, J. Geophys. Res.,
with support from CNES. These data
99, 18,255–18,273.
are available at CLS. We thank also the
Hummon, J. M., and E. Firing (2003), A direct comparison of two RDI shipboard ADCPs: A 75-kHz ocean surveyor and a 150-kHz narrow
French Service d’Observation ROSAME
band, J. Atmos. Oceanic Technol., 20, 872–888.
(LEGOS/INSU) for providing us with the
McCartney, M. S., and K. A. Donohue (2007), A deep cyclonic gyre in the Australian-Antarctic basin, Prog. Oceanogr., 75, 675–750.
model tidal current information used
Moore, J. K., M. R. Abbott, and J. G. Richman (1999), Location and dynamics of the Antarctic Polar Front from satellite sea surface tempera-
in this study. The KEOPS2
ture data, J. Geophys. Res., 104, 3059–3073.
hydrographic, LADCP, and moored
Nowlin, W. D., Jr., and J. M. Klinck (1986), The physics of the Antarctic Circumpolar Current, Rev. Geophys. Space Phys., 24, 469–491.
current meter data are available at
Orsi, A. H., T. Whitworth III, and W. D. Nowlin Jr. (1995), On the meridional extent and fronts of the Antarctic Circumpolar Current, Deep Sea
LOCEAN.
Res., Part I, 42, 641–673.
Park, Y.-H., and F. Vivier (2011), Circulation and hydrography over the Kerguelen Plateau, in The Kerguelen Plateau: Marine Ecosystem and
Fisheries, edited by G. Duhamel et al., pp. 43–55, Cybium, Paris.
Park, Y.-H., L. Gamb eroni, and E. Charriaud (1993), Frontal structure, water masses and circulation in the Crozet Basin, J. Geophys. Res., 98,
12,361–12,385.
Park, Y.-H., N. Gasco, and G. Duhamel (2008a), Slope currents around the Kerguelen Islands from demersal longline fishing records, Geo-
phys. Res. Lett., 35, L09604, doi:10.1029/2008GL033660.
Park, Y.-H., J. L. Fuda, I. Durand, and A. C. Naveira Garabato (2008b), Internal tides and vertical mixing over the Kerguelen Plateau, Deep Sea
Res., Part II, 55, 582–593.
Park, Y.-H., F. Roquet, I. Durand, and J. L. Fuda (2008c), Large-scale circulation over and around the Northern Kerguelen Plateau, Deep Sea
Res., Part II, 55, 566–581.
Park, Y.-H., F. Vivier, F. Roquet, and E. Kestenare (2009), Direct observations of the ACC transport across the Kerguelen Plateau, Geophys.
Res. Lett., 36, L18603, doi:10.1029/2009GL039617.
Roquet, F., Y.-H. Park, C. Guinet, F. Bailleul, and J.-B. Charrassin (2009), Observations of the Fawn Trough Current over the Kerguelen Plateau
from instrumented elephant seals, J. Mar. Syst., 78(3), 377–393, doi:10.1016/j.jmarsys.2008.11.017.
Ruddick, B. R., and J. S. Turner (1979), The vertical length scale of double diffusive intrusions, Deep Sea Res., Part A, 26, 903–913.
Sokolov, S., and S. R. Rintoul (2009), Circumpolar structure and distribution of the Antarctic Circumpolar current fronts: 1. Mean circumpolar
paths, J. Geophys. Res., 114, C11019, doi:10.1029/2008JC005108.
Testut, L., F. Birol, and C. Delebecque (2012), Regional tidal modeling and evaluation of Jason-2 tidal geophysical correction, Mar. Geod., 35,
299–313.
van Beek, P., M. Bourquin, J. L. Reyss, M. Souhaut, M. A. Charette, and C. Jeandel (2008), Radium isotopes to investigate the water mass
pathways on the Kerguelen Plateau (Southern Ocean), Deep Sea Res., Part II, 55, 622–637.
Visbeck, M. (2002), Deep velocity profiling using Lowered Acoustic Doppler Current Profilers: Bottom track and inverse solutions, J. Atmos.
Oceanic Technol., 19, 794–807.
Whitworth, T., III, and W. D. Nowlin Jr. (1987), Water masses and currents of the Southern Ocean at the Greenwich Meridian, J. Geophys.
Res., 92, 6462–6476.
PARK ET AL. C 2014. The Authors.
V 6592You can also read