Phenotyping Local Eggplant Varieties: Commitment to Biodiversity and Nutritional Quality Preservation - Frontiers
←
→
Page content transcription
If your browser does not render page correctly, please read the page content below
ORIGINAL RESEARCH
                                                                                                                                                published: 01 July 2021
                                                                                                                                        doi: 10.3389/fpls.2021.696272

                                             Phenotyping Local Eggplant
                                             Varieties: Commitment to
                                             Biodiversity and Nutritional Quality
                                             Preservation
                                             Eva Martínez-Ispizua 1 , Ángeles Calatayud 1 , José Ignacio Marsal 1 ,
                                             Rubén Mateos-Fernández 2 , María José Díez 3 , Salvador Soler 3 , José Vicente Valcárcel 3
                                             and Mary-Rus Martínez-Cuenca 1*
                                             1
                                              Horticulture Department, Valencian Institute for Agricultural Research (IVIA), Valencia, Spain, 2 Plants Genomics and
                                             Biotechnology Department, Institute for Plant Molecular and Cell Biology (IBMCP), Valencia, Spain, 3 Biotechnology
                                             Department, Valencian Institute for the Conservation and Improvement of Agrobiodiversity (COMAV), Polytechnic University
                                             of Valencia, Valencia, Spain

                                             Given the little variability among commercialised eggplants mainly in developed countries,
                                             exploring, and structuring of traditional varieties germplasm collections have become
                                             a key element for extending ecotypes and promoting biodiversity preservation and
                                             consumption. Thirty-one eggplant landraces from Spain were characterised with 22
                            Edited by:       quantitative and 14 qualitative conventional morphological descriptors. Landraces were
                     Antonio Ferrante,       grouped based on their fruit skin colour (black-purple, striped, white, and reddish).
               University of Milan, Italy
                                             Landraces B7, B20, and B24 were left out for their distinctive fruit characteristics.
                      Reviewed by:
               Francesco Elia Florio,
                                             Wide variation for plant, leaf, flower, and fruit phenology traits was observed across
             University of Milan, Italy      the local landraces, and fruit descriptors were considered the most important ones. In
                       Oksana Sytar,
                                             a second experiment, landraces, B14, B16, and B17 were selected to determine fruit
 Taras Shevchenko National University
                     of Kyiv, Ukraine        quality. By contemplating the benefits provided by antioxidants and sugars for human
                 *Correspondence:            health, pulp antioxidant capacity, total phenolic, ascorbic acid, carotenoid, flavonoid,
           Mary-Rus Martínez-Cuenca          and total sugar content were determined. Significant differences were observed across
                martinez_mru@gva.es
                                             these three landraces, and B14 was highlighted for its antioxidant properties, while
                   Specialty section:        B17 stood out for its high sugar content. B16 did not stand out for any traits. The
         This article was submitted to       results indicate the wide variability in eggplants for their phenotypic and nutritional
        Crop and Product Physiology,
                                             characteristics, which emphasises the importance of traditional varieties as the main
               a section of the journal
            Frontiers in Plant Science       source of agricultural biodiversity.
              Received: 16 April 2021        Keywords: eggplant, landrace, nutraceutical value, antioxidants, phenotype, biodiversity
             Accepted: 07 June 2021
             Published: 01 July 2021

                            Citation:        INTRODUCTION
    Martínez-Ispizua E, Calatayud Á,
    Marsal JI, Mateos-Fernández R,           Nutritional habits have vastly changed, and the consumption of fruit and vegetables has grown
  Díez MJ, Soler S, Valcárcel JV and
                                             thanks to the abundance of health-promoting compounds found in them (Yahia et al., 2018).
       Martínez-Cuenca M-R (2021)
Phenotyping Local Eggplant Varieties:
                                             They are provided a wide range of minerals (Jiménez-Aguilar and Grusak, 2017), proteins (Raigón
    Commitment to Biodiversity and           et al., 2008; Sedlar et al., 2021), fibre (Ciudad-Mulero et al., 2019) and antioxidants (Gürbüz
     Nutritional Quality Preservation.       et al., 2018; Karasawa and Mohan, 2018; Sidhu and Zafar, 2018). However, fruit and vegetables
        Front. Plant Sci. 12:696272.         appreciation has mainly increased due to the beneficial effects associated with dietary antioxidants
     doi: 10.3389/fpls.2021.696272           (Hussain et al., 2014).

Frontiers in Plant Science | www.frontiersin.org                                   1                                             July 2021 | Volume 12 | Article 696272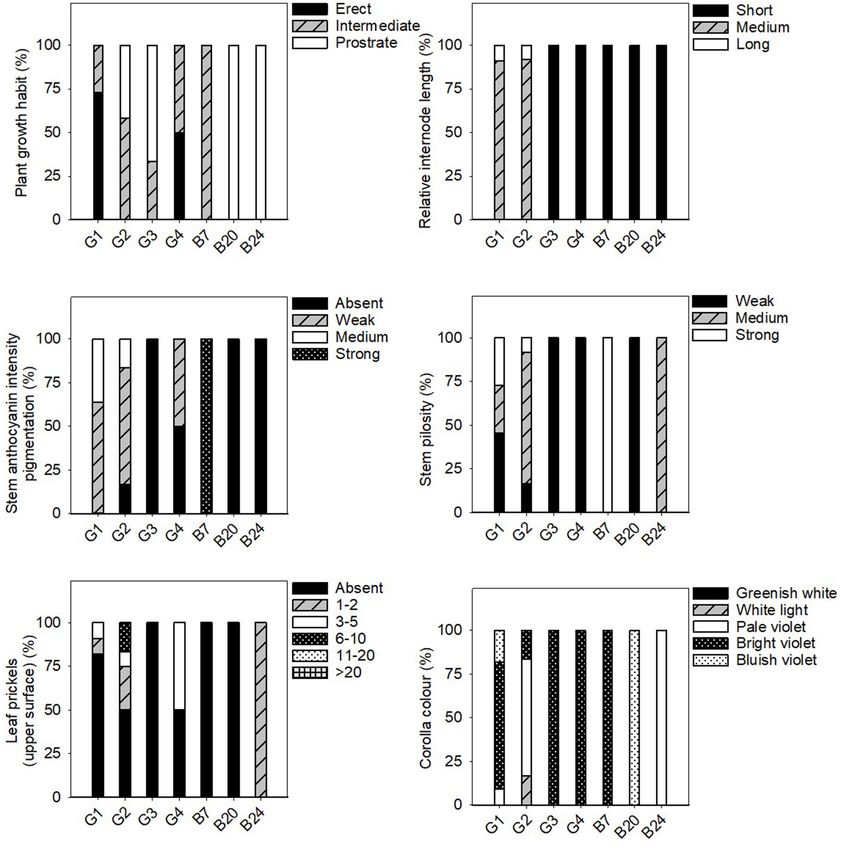
Martínez-Ispizua et al.                                                                                Characterisation of Valencian Eggplant Landraces

    Eggplant is a common annual vegetable crop grown in                     eggplant varieties should attach considerable interest giving the
subtropical and tropical areas (Kaur et al., 2014). It is one               high phenotype biodiversity that can be found in these landraces.
of the most important vegetable crops, and 1.85 million                         The main challenge of crop genetic selection lies in the
cultivated hectares (ha) worldwide are used to grow it (with                reliability of available phenotypic data (Gosa et al., 2019).The
a production of 55 million tonnes). It has a huge economic                  rapid development of genomics, has offered crop breeders the
impact in Africa, Europe, and especially Asia, which harvests               ability to develop high yielding and stress tolerant plants, but
more than 90% of the total eggplant production. It is particularly          the ability to acquire high yielding phenotypic data hinders this
important in China and India. Spain is the world’s tenth                    opportunity (Zhang and Zhang, 2018).
largest producer of this vegetable (Food and Agriculture                        Currently, non-destructive phenotyping technologies, like
Organization Faostat, 2019).                                                hyperspectral imaging or multispectral fluorescence, are of
    Although most commercial varieties are purple (Nothmann                 great interest as they allow predicting the content of many
et al., 1976; Hanson et al., 2006), eggplants are known for being           nutraceuticals compounds without damaging the plant itself
highly variable in fruit colour, shape, and size. A representative          (Zarco-Tejada et al., 2009; Pu et al., 2015). Most of these facilities
part of this diversity is found among traditional varieties.                collect information in controlled environments using robotics
Landraces are crop varieties that have been differentiated by               and automatic image acquisition and analysis (Gosa et al., 2019).
farmers through a historical selection process and they represent           However, although this type of non-destructive technique can
great genetic heritage as a source of agricultural biodiversity (Jain       estimate a wide range of internal biochemical data in a short time,
and Gupta, 2013). These local varieties are better adapted to               information on the ability of biochemical reflectance indices to
specific agroclimatic conditions, and they are suitable for new             quantify many compounds is still lacking (Sytar et al., 2017).
agriculture kinds, such as organic production (Gonzalez-Cebrino             Compared to hyperspectral studies, more progress has been made
et al., 2011; Ribes-Moya et al., 2018).                                     in fluorescence methods. The multi-channel fluorescence systems
    The fruit of the eggplant not only contains proteins,                   with multi-colour excitation have been significantly improved
minerals, dietary fibre, minerals of interest as potassium, calcium,        and the commercial devices became available and widely applied
magnesium, sodium, iron (Quamruzzaman et al., 2020), but is                 (Sytar et al., 2020). However, these technologies are still under
also enriched in polyphenols, including phenolic acids such as              active development (Yang et al., 2020).
chlorogenic acid, caffeic acid, and p-coumaric acid (Chumyam                    This work seeks to revalue traditional eggplant varieties
et al., 2013; Uscanga-Sosa et al., 2020), and flavonoids, including         from the Valencian Community (Spain) as the biodiversity of
trace quantities of flavonols and a high content of various                 the territory has been severely diminished by widely cultivated
acylated and non-acylated anthocyanins specially in purple-                 commercial hybrids. In this context, 31 eggplant landraces were
coloured varieties (Koley et al., 2019). Also is appreciated for            selected from the plant resources stored in the genebank of the
its content in other antioxidants as ascorbic acid (Fategbe                 Institute for the Conservation and Improvement of Valencian
et al., 2013) and vitamins, especially vitamin P (Dong et al.,              Agrobiodiversity (COMAV, Valencia) and the Valencian Institute
2020), although has low provitamin A carotenoid content as                  for Agrarian Research (IVIA, Valencia). Even if the majority of
compared to other Solanaceous crops such as tomatoes and                    the selected eggplants had black-purple or striped skin, other less
peppers (Gürbüz et al., 2018). These bioactive compounds                    common varieties were included in the assay, since having a high
are responsible for higher functional properties of eggplant                degree of diversity was advantageous, both for their possible use
(Koley et al., 2019), as they neutralise reactive oxygen species            in breeding programmes and for promoting their conservation.
(ROS) by reducing lipid peroxidation and damage to cellular                 Once the phenotypic data had been collected, the nutritional
organelles (Fategbe et al., 2013; Kaur et al., 2014), and provide           and nutraceutical characteristics of three selected landraces were
antibacterial, anti-inflammatory, antiallergic, hepatoprotective,           determined in order to gain benefits derived from their use.
antithrombotic, antiviral, anticarcinogenic, and vasodilatory
properties in humans (Rathee et al., 2009; Akanitapichat et al.,            MATERIALS AND METHODS
2010; Cushnie and Lamb, 2011; Grussu et al., 2011).
    In relation to nutritional concerns, the eggplant (Solanum              Plant Material and Soil Experiment
melongena L.) has become a highly appreciated crop. Of                      The work herein presented is divided into two main experiments:
120 vegetables evaluated to determinate their antioxidant                   one focuses on phenotypic characterisation and the other on
capacity, eggplant was ranked in the top 10 for its oxygen                  nutritional quality. They were carried out in two consecutive
radical absorbance capacity, mediated mainly by fruit’s phenolic            years (2019 and 2020).
constituents (Stommel and Whitaker, 2003; Hanson et al., 2006).                Seeds of eggplant landraces (S. melongena L.) were provided
Nevertheless, a wide natural variation in antioxidant capacity has          by the genebanks at the COMAV and the IVIA (Spain).
been found between eggplant landraces (Stommel and Whitaker,                The passport data are indicated in Table 1. Landraces were
2003; Hanson et al., 2006; Mennella et al., 2010). It is known that         selected according to fruit colour and morphology to study
the quantity and quality of phenols present in fruit is conditioned         as much phenotypic diversity as possible (Figure 1). In both
by the environment, soil type, and also growing and storage                 years, the experiments were conducted from May to August in
conditions (Lee et al., 2004; Achouri et al., 2005; Luthria and             the experimental open-field of the IVIA located in Moncada
Mukhopadhyay, 2006). Therefore, having a detailed description               (Valencia, Spain; 39◦ 35′ 22.3′′ N, 0◦ 23′ 44.0′′ W, 37 cm above
of the characteristics and nutraceutical quality of traditional             sea level). Soil was sandy clay loan (clay: 21.2%; silt: 11.8%; sand:

Frontiers in Plant Science | www.frontiersin.org                        2                                        July 2021 | Volume 12 | Article 696272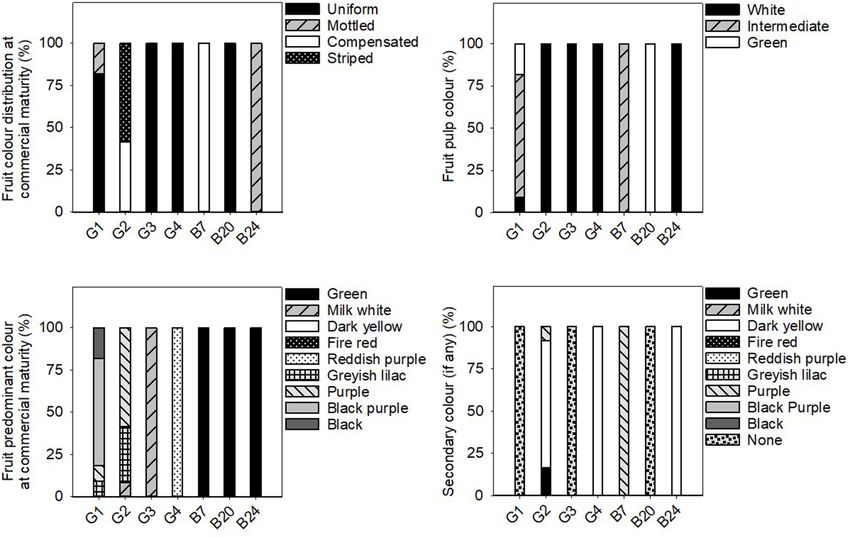
Martínez-Ispizua et al.                                                                                                          Characterisation of Valencian Eggplant Landraces

TABLE 1 | Abbreviation, germplasm collection code, group (based on eggplant skin colour, G1= black-purple, G2 = striped, G3 = white, G4 = reddish purple) and origin
of the 31 eggplant landraces used in the study.

Abreviation code                                        Genbank code                                   Group                                    Original location

B1                                                      BGV005769                                      G2                                       Alcira, Valenica, Spain(a)
B2                                                      BGV005770                                      G2                                       Gandía, Valencia, Spain(a)
B3                                                      BGV005771                                      G4                                       Gandía, Valencia, Spain(a)
B4                                                      BGV005774                                      G1                                       Jaraco, Valencia, Spain(a)
B5                                                      BGV005776                                      G2                                       Valencia, Spain(a)
B6                                                      BGV005778                                      G2                                       Orihuela, Alicante, Spain(a)
B7                                                      BGV005781                                      –                                        Benijofar, Alicante, Spain(a)
B8                                                      BGV005780                                      ’G1                                      San Fulgencio, Alicante, Spain(a)
B9                                                      BGV005783                                      G2                                       Aspe, Alicante, Spain(a)
B10                                                     BGV005784                                      G1                                       Novelda, Alicante, Spain(a)
B11                                                     BGV005785                                      G1                                       Elche, Alicante, Spain(a)
B12                                                     BGV005787                                      G1                                       Mutxamel, Alicante, Spain(a)
B13                                                     BGV005788                                      G2                                       Benejama, Alicante, Spain(a)
B14                                                     BGV005789                                      G1                                       Gandía, Valencia, Spain(a)
B15                                                     BGV005790                                      G2                                       Orihuela, Alicante, Spain(a)
B16                                                     BGV015751                                      G3                                       Alacuás, Valencia, Spain(a)
B17                                                     BGV008284                                      G2                                       Moncada, Valencia, Spain(a)
B18                                                     BGV015630                                      G3                                       Torreblanca, Castellón, Spain(a)
B19                                                     BGV015745                                      G1                                       Benimasot, Alicante, Spain(a)
B20                                                     BGV015762                                      –                                        Alcudia de Crespins, Valencia, Spain(a)
B21                                                     BGV015847                                      G2                                       Onteniente, Valencia, Spain(a)
B22                                                     BGV015763                                      G1                                       Onteniente, Valencia, Spain(a)
B23                                                     BGV015848                                      G1                                       Onteniente, Valencia, Spain(a)
B24                                                     BGV015849                                      –                                        Jaraco, Valencia, Spain(a)
B25                                                     BGV015850                                      G2                                       Jaraco, Valencia, Spain(a)
B26                                                     BGV015834                                      G1                                       Jaraco, Valencia, Spain(a)
B27                                                     BGV015835                                      G4                                       Jaraco, Valencia, Spain(a)
B28                                                     BGV015836                                      G3                                       Jaraco, Valencia, Spain(a)
B29                                                     BGV014500                                      G2                                       Villarreal, Castellón, Spain(a)
B30                                                     B-81                                           G2                                       Gandía, Valencia, Spain(b)
B31                                                     B-76                                           G1                                       Alginet, Valencia, Spain(b)

Plant material was provided by the:   (a) Valencian   Institute for the Conservation and Improvement of Agrobiodiversity (COMAV, Spain);   (b) Valencian   Institute for Agricultural Research
(IVIA, Spain).

67.0%), and organic matter was 0.61%, pH 7.8 at 25◦ C and EC1 : 5                                August depending on the landrace (plants around 2.5–3 months
at 25◦ C: 0.289 dS m−1 .                                                                         after transplant). Data for plant, leaf, and flower traits were
                                                                                                 taken from eight independent plants, which gave 8 replicates per
Experiment 1: Phenotyping Study                                                                  landrace. Fruit traits were measured in 10 different fruits which
For the first-year experiment, 31 eggplant landraces were sown                                   were representative of the landrace, which equals 10 replicates
on 5 March 2019 and seedlings (8 plants per landrace) were                                       per variety.
planted on 2 May 2019. Plants were grown in single rows placed
120 cm apart leaving 60 cm between each plant. Irrigation of                                     Experiment 2: Fruit Quality Study
plants satisfied 100% of the crop evapotranspiration (ETc) as                                    During the second-year experiment, landraces B14, B16, and B17
described in Penella et al. (2014) with a drip system. Nutrients                                 were chosen as being representative of the main fruit colour
were applied via the irrigation system at a rate (kg ha−1 ) of 200 N,                            groups, namely, G1: black-purple, G2: striped and G3: white, to
50 P2 O5 , 250 K2 O, 110 CaO, and 35 MgO, as recommended by                                      analyse fruit quality and to, thus, provide verified information
Maroto Borrego (2002). The average range of the minimum and                                      on their added value and to facilitate their trade. Landraces
maximum temperatures for the first-year experiment was 12–                                       from G4 group and outliers (B7, B20, and B24) were not
24◦ C for May, 15–28◦ C for June, 19–32◦ C for July, and 19–32◦ C                                considered due to their reduced number of representatives and
for August (http://riegos.ivia.es/) (IVIA (Instituto Valenciano                                  unsuitable qualities for cultural practises and market observed in
de Investigaciones Agrarias), 2021). Measurements were taken                                     experiment 1 (high number of calix prickles, undesirable growth
when fruits reached the commercial maturity, along July and                                      habit, low number of flowers per inflorescence, intense leaf

Frontiers in Plant Science | www.frontiersin.org                                             3                                                  July 2021 | Volume 12 | Article 696272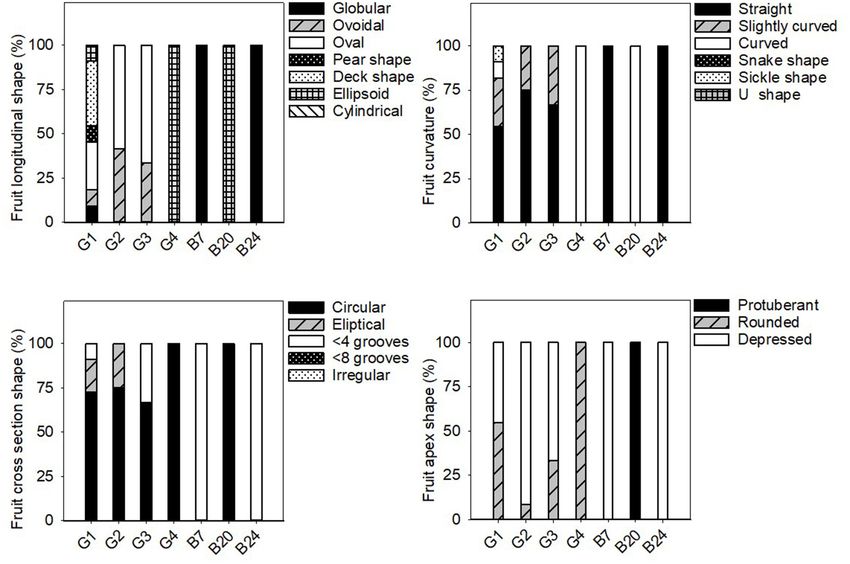
Martínez-Ispizua et al.                                                                                           Characterisation of Valencian Eggplant Landraces

 FIGURE 1 | Pictures of the 31 cultivated eggplant landraces (S. melongena L.) provided by the Germplasm Banks from the COMAV and the IVIA (Spain). The size of
 the grid cells in the fruit pictures is 1 × 1 cm.

pilosity. . . ). Seeds were sown on 7 March 2020 and seedlings (10                  plant, which gave 16 data per landrace. L∗ (lightness), a∗
plants per landrace) were planted on 13 May 2020. Agronomic                         (red/green chromatic coordinates) and b∗ (yellow/blue chromatic
culture practises were similar as in the first-year experiment.                     coordinates) measures were recorded in order to determine leaf
The average range of the minimum and maximum temperatures                           colour. L∗ a∗ b∗ standard for colour measurement was chosen
was 11–31◦ C for May, 14–31◦ C for June, 18–33◦ C for July                          as it is perceptually uniform and device-independent (Mendoza
and 19–34◦ C for August (http://riegos.ivia.es/) (IVIA (Instituto                   et al., 2006). Eggplant peel colour was assigned by researchers
Valenciano de Investigaciones Agrarias), 2021). Fruits were                         visually, being thus considered a qualitative trait.
harvested when reached the commercial maturity, along July
and August depending on the landrace (plants around 2.5–3                           Fruit Quality Determinations
months after transplant). For each case, two fruit samples were                     The percentage of dry weight (DW), pulp colour, antioxidant
taken from ten independent plants, which gave 20 replicates                         capacity, and total phenolic, flavonoid, ascorbic acid, carotenoid
per landrace.                                                                       and sugar contents, were analysed in the mid-part of the pulp of
                                                                                    harvested fruits in B14, B16, and B17 to determine if there were
                                                                                    significant differences among them.
Agromorphological Characterisation and
Data Collection                                                                     Fruit Dry Material
The quantitative and qualitative agromorphologic data from                          In order to establish the percentage DW in fruits, the fresh weight
thirty-six phenotypic traits (Table 2) measured in plants, stem,                    (FW) of eggplants was recorded. Samples were dried at 65◦ C for
leaves, flowers, and fruit were scored and classified according to                  72 h in a laboratory oven. The DW percentage was calculated as
the International Board for Plant Genetic Resources descriptors                     (DW/FW) × 100.
(IBPGR 1990) for eggplant.
                                                                                    Pulp Colour
Leaf and Fruit Peel Colour                                                          Fruit slides (10 mm wide Zaro et al., 2014b) were cut
The colour of eggplant leaves was determined by placing the                         transversally in the central part of the eggplant and colour
laboratory standard colorimeter (Minolta Colorimeter model                          in the inner pulp was measured by laboratory standard
CR-400, Osaka, Japan) on the central part of the adaxial                            colorimeter (Minolta Colorimeter model CR-400, Osaka, Japan).
face. Two independent colour measures were taken in each                            One measure in the central part of the sample was taken in

Frontiers in Plant Science | www.frontiersin.org                                4                                           July 2021 | Volume 12 | Article 696272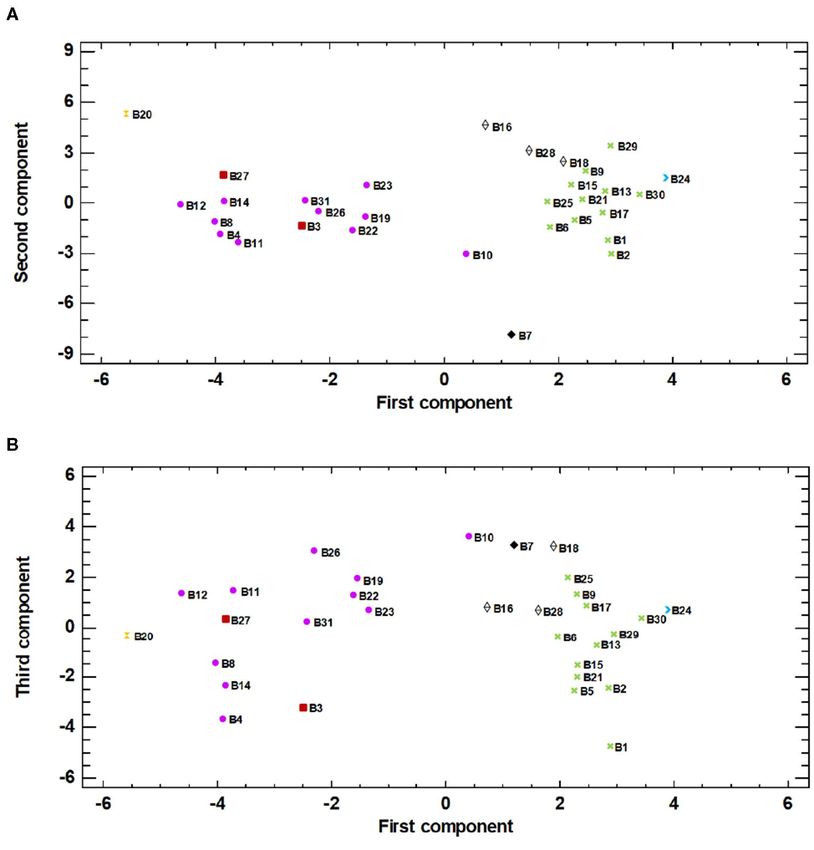
Martínez-Ispizua et al.                                                                                                 Characterisation of Valencian Eggplant Landraces

TABLE 2 | List of the descriptors used for phenotyping according to the                   TABLE 2 | Continued
International Board for Plant Genetic Resources descriptors (IBPGR 1990)
for eggplant.                                                                             Descriptors                 Unit/Scale

Descriptors                   Unit/Scale                                                  Curvature                   1.Straight 3.Slightly curved 5.Curved 7.Snake
                                                                                                                      shape 8.Sickle shape 9.U shape
Quantitative                                                                              Cross section shape         1.Circular, without grooves 3.Elliptical, without
Plant morphology                                                                                                      grooves 5.Few grooves (∼4) 7.Lots of grooves (∼8)
Length                        cm                                                                                      9.Very irregular

Width                         cm                                                          Apex shape                  3.Protuberant 5.Rounded 7.Depressed

Branch density                1.Very scarce (≤ 2) 3.Scarce (∼5) 5.Intermediate            Colour distribution at      1.Uniform 3.Mottled 5.Compensated 7.Striped
                              (∼10) 7.Dense (∼20) 9.Very dense (>30)                      commercial maturity

Leaf morphology               cm                                                          Pulp colour                 1.White 3.Intermediate 5.Green
Length                                                                                    Predominant colour in       1.Green 2.Milk white 3.Dark yellow 4.Fire red
Width                         cm                                                          commercial maturity         5.Redish purple 6.Greyish lilac 7.Purple 8.Black
                                                                                                                      purple 9.Black
Pedicel length                mm
                                                                                          Secondary colour (if any)   1.Green 2.Milk white 3.Dark yellow 4.Fire red
Pedicel thickness             mm
                                                                                                                      5.Redish purple 6.Greyish lilac 7.Purple 8.Black
Colour                        L*                                                                                      purple 9.Black
                              a*
                              b*
Dented leaf blade             1.Very weak 3.Weak 5.Medium 7.Strong 9.Very                 each fruit, which gave 20 data per landrace. L∗ (lightness),
                              strong                                                      a∗ (red/green chromatic coordinates), and b∗ (yellow/blue
Blistering                    1.Very weak 3.Weak 5.Medium 7.Strong 9.Very                 chromatic coordinates) measures were recorded in order
                              strong
                                                                                          to determine pulp colour immediately after eggplants were
Pilosity (per cm−2 )          1. (
                                                                                          cut (Concellón et al., 2012). L∗ a∗ b∗ standard for colour
                              200)
                                                                                          measurement was chosen as it is perceptually uniform and
Flowers
                                                                                          device-independent (Mendoza et al., 2006).
Number per
inflorescence
                                                                                          Nutraceutical Compounds and Antioxidant Capacity
Fruit
                                                                                          Sample Extract
Number of colours in
commercial maturity
                                                                                          Nutraceutical compounds and antioxidant capacity were
Length                        cm
                                                                                          analysed in the pulp of eggplant fruit. Samples were peeled, cut
Width                         cm
                                                                                          into pieces and homogenised (Polytron PT 3100, Kinematica
Length/width
                                                                                          AG.,) at 15,000 g for approximately 1 min. Final extracts were
                                                                                          divided into aliquots of 2 g, frozen in liquid nitrogen and stored
Weight                        g
                                                                                          at −80◦ C until further determinations were made.
Calyx length                  cm
Calyx lenght total lenght     %
                                                                                          Antioxidant Capacity Measurements
ratio
                                                                                          Antioxidant capacity was measured following the method
Number of calyx prickles
                                                                                          reported by Brand-Williams et al. (1995) with a few
Descriptors                   Unit/Scale
                                                                                          modifications. The sample extract (1 g) was homogenised
Qualitative
                                                                                          in 4.0 mL 80% (v/v) methanol, incubated in an ultrasonic
Plant morphology
                                                                                          bath (Ultrasonic cleaner, Fungilab) at medium intensity for
Plant growth habit            3.Erect 5.Intermediate 7.Postrate
                                                                                          30 min and then vortexed. Samples were centrifuged at 10,000 g
Relative internode length     1.Short 2.Medium 3. Long
                                                                                          at 4◦ C for 15 min. Then 10 µL of the extract were mixed
Anthocyanin intensity         0.Absent 1.Weak 2.Medium 3.Strong
                                                                                          with 990 µL of a solution composed of 3.12 × 10⁻⁵ M of
pigmentation
                                                                                          2,2-diphenyl-1-picrylhydrazyl (DPPH) in 80% methanol. The
Pilosity                      1.Weak 2.Medium 3.Strong
                                                                                          decrease in absorbance at 515 nm contrasted with a blank
Leaf morphology
                                                                                          solution containing 80% methanol with no extract after a 30-min
Prickels (upper surface)      0. Absent 1. (1–2) 3. (3–5) 5. (6–10) 7. (11–20) 9. >
                              20
                                                                                          reaction time at room temperature and in the dark using a
Flower morphology
                                                                                          spectrophotometer (Uvikon XS, Bio-Tek). Antioxidant capacity
Corolla colour                1.Greenish white 3.Light White 5.Pale violet 7.Bright
                                                                                          was expressed as the 149 percentage reduction of the initial
                              violet 9.Bluish violet                                      DPPH absorption in extracts.
Fruit morphology
                                                                                          Total Phenolic Content
Longitudinal shape            1.Globular 2.Ovoidal 3.Ovobal 4. Pear shape
                              5.Deck shape 6.Ellipsoid 7.Cylindrical                      Phenolic content was analysed as described by Dewanto et al.
                                                                                          (2002) with some adjustments. The sample extract (1 g) was
                                                                        (Continued)       mixed with 4.0 mL of 80% (v/v) methanol, vortexed and

Frontiers in Plant Science | www.frontiersin.org                                      5                                            July 2021 | Volume 12 | Article 696272
Martínez-Ispizua et al. Characterisation of Valencian Eggplant Landraces
incubated in an ultrasonic bath (Ultrasonic cleaner, Fungilab) Bio-Tek) and 80% acetone (v/v) was used for the blank solution.
at medium intensity for 30 min. Samples were centrifuged at The carotenoid concentration of samples was calculated using
10,000 g at 4◦ C for 15 min. The total phenolic concentration Equation (1), and then expressed as µg g−1 FW:
was determined following the procedure of Singleton and Rossi
Carotenoids (µg mL−1 ) = [(1000 × Abs470 – 1.82 × Chl a)
(1965) based on the Folin-Ciocalteu colorimetric method. Then
– (85.02 × Chl b)]/198 (1)
10 µL of the supernatant were mixed with 115 µL of distilled
water, 125 µL of Folin-Ciocalteu reagent (Sigma-Aldrich, Co.) Where Chl a and Chl b were the chlorophyll a and b contents,
and 1.25 mL of NaHCO3 (7%). Afterwards the mix was incubated respectively, and were calculated by Equations (2) and (3); Abs is
at room temperature for 90 min in complete darkness. The the absorption of samples at a specific wavelength (nm):
absorption of the solution was measured at 760 nm in a
Chl a (µg mL−1 ) = 12.25 × Abs663 – 2.55 × Abs648 (2)
spectrophotometer (Uvikon XS, Bio-Tek). A blank solution with
Chl b (µg mL−1 ) = 20.31 × Abs648 – 4.91 × Abs663 (3)
no extract was used for calibration. Total phenolic concentration
was compared to a standard curve using gallic acid (120–600 mg
L−1 ). Total phenolic content was expressed as mg gallic acid Total Soluble Sugar Content
equivalent (GA) g−1 FW. Soluble sugar content was spectrophotometrically determined
according to Calatayud et al. (2008) with several modifications.
Total Flavonoid Content The sample extract (0.3 g) was mixed with 15 mL of 80% ethanol
Flavonoid content was measured following the method reported (v/v), which was previously heated. The mixture was incubated
by Du et al. (2009) with some modifications. Briefly, 1 g of sample in a water bath for 10 min at 85◦ C and then vortexed. Samples
extract was homogenised in 4.0 mL of 80% (v/v) methanol, were centrifuged at 10,000 g at 23◦ C for 10 min. The resulting
incubated in an ultrasonic bath (Ultrasonic cleaner, Fungilab) at supernatant was reserved in a flask. This same process was
medium intensity for 30 min and then vortexed. Samples were repeated 2 more times by adding hot ethanol to the mixing
centrifuged at 10,000 g at 4◦ C for 15 min. Then 0.3 mL of the tube. The ethanol present in the reserved supernatant was then
supernatant were mixed with 3.4 ml of 30% ethanol, 0.15 ml evaporated by a rotary evaporator (R-210, Buchi) at 50◦ C. The
of NaNO2 0.5 M, and 0.15 mL of AlCl3 . Next 6H2 O 0.3 M was sugar concentrate was diluted in 100 mL of distilled water and
added and vortexed. Samples were incubated for 5 min at room filtered to be reserved in a volumetric flask for 24 h at 4◦ C. Next
temperature. Afterwards 1 mL of NaOH 0.1 M was added to the 0.5 mL of this solution was mixed with 2 mL of distilled water
mixture. The absorption of solution was measured at 506 nm and placed on ice. Once cooled, 5 mL of 4 µM anthrone (Acros
in a spectrophotometer (Uvikon XS, Bio-Tek). Total flavonoid Organics B.V.B.A.) solution, diluted in 96% (v/v) sulphuric
concentration was compared to a standard curve using rutin acid, were added to each tube. Samples were incubated in a
(Merck Co.) as the standard (4.7–300 mg L−1 ). Flavonoid content water bath for 7.5 min at 85◦ C and then placed on ice for
was expressed as mg rutin equivalent g−1 FW. 30 min. The absorption of solution was measured at 630 nm
in a spectrophotometer (Uvikon XS, Bio-Tek). Total sugar
Ascorbic Acid Concentration concentration was compared to a standard curve using a diluted
Ascorbic acid content was spectrophotometrically determined (1:25) stock solution of 55.6 µM glucose and 70 µM sodium
according to Kampfenkel et al. (1995). The sample extract (0.3 g) benzoate as the standard. Total sugar content was expressed as
was mixed with 2 mL of 6% (w/v) TCA (trichloroacetic acid). g glucose equivalent 100 g−1 FW.
Samples were centrifuged at 10,000 g for 3 min. Next 0.05 mL
of the supernatant were mixed with 0.05 mL of 10 mM DTT Statistical Analysis
and 0.1 mL of 0.2 M phosphate buffer (pH 7.4). Samples were The results obtained from the evaluated parameters underwent
incubated for 15 min at 42◦ C. Subsequently, 0.05 mL of 0.5% a one-way ANOVA analysis in Statgraphics Centurion XVII
(w/v) NEM (N-ethylamide) were added to the mix and incubated (Statistical Graphics Corporation 2014) using the selected
for 1 min at room temperature. Later 0.25 mL of 10% (w/v) landraces as the factor of analyses. The results were expressed
TCA, 0.2 mL of H3 PO4 , 0.2 mL of 4% (w/v) 2,2’-dipyridyl, and as the mean ± standard deviation (SD). The means were
0.1 mL of 3% (w/v) FeCl3 were added to the previous solution. accepted as being significantly different at a 95% confidence
The mixture was incubated in a water bath for 40 min at interval (p ≤ 0.05).
42◦ C. The absorption of solution was measured at 525 nm in Principal component analysis (PCA) was run for the
a spectrophotometer (Uvikon XS, Bio-Tek). Ascorbic acid was standardised values using pairwise Euclidean distances among
expressed as mg AsA 100 g−1 FW. accession means to determinate any relations between genotypes.
The extracted eigenvalues, and the relative and cumulative
Carotenoid Concentration proportions of the total variance explained by the first three
The carotenoid concentration was determined components, were calculated. Two-dimensional (2D) scatter
spectrophotometrically as reported by Porra et al. (1989). plots (the first vs. the second and the first vs. the third principal
The sample extract (0.3 g) was mixed with 1.5 mL of 80% acetone components) were prepared based on a distance matrix for the
(v/v) and centrifuged at 7,000 g for 10 min. The supernatant was principal components to visualise the relation that explained
used for the analysis. The absorption of solution was measured traits. For the PCA analysis, the phenotypic data pertaining to
at 663, 648, and 470 nm in a spectrophotometer (Uvikon XS, the 31 landraces was considered together.
Frontiers in Plant Science | www.frontiersin.org 6 July 2021 | Volume 12 | Article 696272Martínez-Ispizua et al. Characterisation of Valencian Eggplant Landraces
Furthermore, two correlation analyses, in which the individual groups G3 and G4 for their distinctive fruit traits. Landraces B7,
samples of each accession were subjected to linear regression and B20, and B24 were not included in any of these groups in PCA
the correlation coefficients (r), were completed among the: (1) analysis because of their distinctive fruit morphology.
selected phenotypic quantitative traits of each landrace (n = 31); In the plot corresponding to first and second components
(2) dry weight, pulp colour and antioxidant traits of the selected (Figure 2A), the landraces from G2, G3, and B24 were located
landraces (B14, B16, B17). furthest to the right according to the correlations determined in
the first component. In contrast, landrace B20 was located on
RESULTS the left of the graph because its fruits ranked first for the both
fruit-length and width-length ratios. B20 was located in the top
PCA Analysis of Phenotyping Traits position of the plot because its leaves obtained higher values for
The PCA analysis and those eigenvalues above 1 reflected a colour parameters L∗ and b∗ , and the lowest value for colour
different pattern in the correlation of eggplants (Table 3). Nine parameter a∗ . In contrast, landrace B7 remained at the bottom of
principal components were determined, which described around the plot given the strong anthocyanin pigmentation on the stem
80% of the variability between landraces. Here it is only shown in addition to having the lowest values for leaf parameters L∗ and
the distribution of landraces based on the most significant b∗ . G1 and G4 were also located on the left of the plot, principally
principal components; the first, second and third components for their elongated shape and their uniform-mottled skin colour
of the PCA, which, respectively, accounted for 23.33, 16.73, and distribution. B10 was slightly separated for having the lowest fruit
12.04% of the total variation for the studied traits. length/width ratio.
The first component principally correlated with fruit traits. The plot projecting the landrace distribution based on the first
All the correlations were moderate, and the strongest positive and third principal components (Figure 2B) did not differ that
relations were observed with fruit width, apex shape, and skin much from the previous one. In this case however, the varieties
colour distribution upon maturity. Negative correlations were of each group appeared somewhat more dispersed given the leaf
found with fruit longitudinal shape, pulp colour, and the length- morphology effect. Landraces B10, B7, B18, and B26 appeared at
width ratio. Therefore, the darkest and longest eggplants with the top of the graph. B10 stood out for its globous leaves, and
obscure pulp were placed to the left of the plot, while the B7 and B18 lacked prickles on leaves and displayed a very short
widest and lightest eggplants with a striped/mottled skin colour pedicel length. B26 stood out for presenting very thin leaves with
distribution and a whitish pulp were placed to the right of the fine pedicels. Conversely, B1 was located at the bottom of the plot
plot. In line with this, when analysing the second component, for its wide leaves with thick pedicels and for also presenting the
the highest correlations were recorded for the leaf and stem most marked presence of prickles.
traits. In particular, positive correlations were established with
colour parameters L∗ and b∗ and dental leaf blade, while negative
correlations were found for stem anthocyanin pigments intensity Phenotypic Differences Between Eggplant
and leaf colour parameter a∗ , among others. So the landraces Landraces
whose leaves had an intense light-green colour and with very Significant differences were found among the average
lobed margin were placed in the upper part of the plot, while values of all the eggplant groups for the majority of the
the landraces with dark-green leaves with soft margins and considered quantitative traits (Table 4). The individual
absence of anthocyanins on the stem were placed in a lower data for each landrace of these groups is shown in the
position. The third component of the PCA analysis showed that Supplementary Tables 1, 2. All the qualitative data is found in
the correlations with fruit descriptors followed the same pattern Figures 3–5.
as that observed for the first component. In contrast, negative In general, the fruit purple-black eggplant varieties (G1) were
correlations were established with some leaf descriptors: width, characterised by an erect plant growth habit, medium relative
presence of prickles, pedicel thickness, and pedicel length. In each internode length, weak stem anthocyanin pigmentation, strong
group described according to the fruit criteria, those landraces leaf pilosity and bright violet flowers. The fruits themselves stand
with wider leaves, lacking prickles, and long pedicels were placed out for their oval, pear or deck shape, and were much longer than
in the upper position in the plot. they were wide, with a rounded or depressed apex, no curvature,
The projection on the PCA plot (Figure 2) showed how white to greenish pulp and their long, but not very prickly calyx.
accessions spread widely over the area. In general, the landraces The landraces grouped for their striped fruit-skin (G2)
that were similar in fruit skin colour and shape were placed were mostly characterised by an intermediate prostrate growth
together, which highlights the importance of both traits. habit, medium relative internode length, large hairy leaves and
According to this information, several groups were arranged pale flowers. Their fruits were elongated, non-curved with a
based mainly on fruit skin colour: G1 = black-purple, G2 = depressed apex, white pulp, many prickles on the calyx and
striped, G3 = white, G4 = reddish purple. The dark and striped they were considerably heavy. Dark yellow and purple colours
skin eggplants were clearly separated in the plot. The white predominated on their skin, along with a striped or compensated
landraces remained close to the striped ones because of their colour distribution.
globular shape, while the reddish ones remained near the black- Three of the landraces in this study had white skin fruits (G3)
purple ones given their dark skin colour and elongated shape. and generally presented short internodes, prostrate growth habit,
Notwithstanding, it was considered necessary to differentiate weak stem pilosity, absence of anthocyanins on the stem and
Frontiers in Plant Science | www.frontiersin.org 7 July 2021 | Volume 12 | Article 696272Martínez-Ispizua et al. Characterisation of Valencian Eggplant Landraces
TABLE 3 | Correlation coefficients for each morphological trait for the three first Only two accessions that produced reddish-purple fruit were
principal components, eigenvalue, and relative and cumulative proportion of the detected (G4). These plants presented erect-intermediate growth
total variance explained by these components in the collection of the 31
habit, dense branching, short internodes, weak stem pilosity,
eggplant landraces.
and bright violet flowers. Their fruits were elongated, ellipsoid-
First Second Third shaped and curved, and they presented a rounded apex, white
principal principal principal pulp and a few prickles on the calyx.
component component component
Landraces B7, B20, and B24 were not included in any of the
Pl Growth habit 0.216 0.194
groups because of their distinctive fruit typology. Variety B7 had
Pl Branch density −0.159 −0.199
globular fruits that were equally green and purple in colour,
and were very light and small in size. This landrace was also
Pl Height −0.225
notable for its high anthocyanin content on its hairy stem. The
Pl Width −0.164
B20 entry had very elongated ellipsoid fruits that were green in
S Relative internode length −0.173 −0.230
colour with no prickles on the calyx. Finally, landrace B24 had
S Anthocyanin pigments −0.334
intensity
mostly green and globular-shaped fruits, but with yellow stripes
S Pilosity −0.227
on the lower part. They also characterised for their white pulp
L Puffiness 0.211
and elevated weight.
L Dental leaf blade 0.291
L Thorn presence −0.339
L Pilosity
Correlation Among the Selected
L Length −0.240 Agro-Morphological Quantitative Traits
L Width 0.213 −0.294 Correlation analyses were carried out to estimate the relation
L Pedicel length −0.180 −0.274 between the most important quantitative traits (Table 5). The
L Pedicel thickness −0.351 pairwise coefficients showed a positive correlation and a
L Colour parameter L* 0.304
statistical significance for 15 pairs of traits of the 55 studied ones.
L Colour parameter a* −0.309
The most representative positive relations were observed between
L Colour parameter b* 0.342
fruit width vs. weight, fruit ratio vs. fruit length and leaf length
Fl Corolla colour −0.204
vs. width. Statistically significant negative correlations for pairs
of traits were also determined in 6 out of the 55 studied ones. The
Fl Number per
inflorenscence closest negative relations were for the fruit ratio vs. fruit width
Fr Longitudinal shape −0.280 −0.176 and fruit length vs. calyx ratios.
Fr Curvature −0.214 −0.209
Fr Cross section shape 0.208
Fr Apex shape 0.260
Nutraceutical Characteristics
Fr Colour distrib. at maturity 0.253
The fruit of three eggplant landraces (B14, B16, B17) were
Fr Pulp colour −0.257
characterised to establish fruit quality. Significant differences (p
Fr Colour predominant −0.272
< 0.05 or p < 0.001) were found among the average values in
maturity the selected eggplant landraces for all the analysed nutraceutical
Fr Secondary colour (if any) 0.174 compounds, but not in the DW percentage (Table 6).
Fr Number of colours 0.193
Fr Length −0.188 0.204 −0.222 Fruit DW Percentage
Fr Width 0.280 The fruit DW (Table 6) range was 11.57–42.64% for the studied
Fr Length/width ratio −0.252 −0.215 landraces. The mean values for cultivars B14, B16, and B17
Fr Weight 0.212 were 24.37, 21.87, and 23.09%, respectively, and no significant
Fr Calyx length differences were observed among landraces.
Fr Calyx lenght/total lenght 0.172 0.186
Fr Calyx prickles number 0.182 Pulp Colour
Eigenvalue 8.400 6.022 4.336 The L∗ , a∗ , b∗ colour parameters, measured on the fruit inner
Variance explained (%) 23.334 16.728 12.043 pulp after cut, (Table 6) ranged from 71.27 to 88.48 (L∗ ), −2.38 to
Cumulative variance 23.334 40.062 52.105 1.6 (a∗ ) and 15.11–22.87 (b∗ ) for the studied landraces. Focusing
explained (%)
on colour parameter L∗ , significant differences were found
Only the correlations with absolute 0.150≤ are listed. Pl, Plant; S, Stem; L, Leaf; Fl, Flower; between landraces, turning B17 to own a lighter pulp colour
Fr, Fruit. (1.07-fold higher value). When analysing colour parameter a∗ , it
was observed that landrace B14 had a greener pulp tonality (3.62-
fold higher value). Also, in accordance with b∗ parameter data,
many bright violet flowers. The aforementioned fruits had white landrace B14, showed a much more yellowish pulp (1.97-fold
pulp, many prickles, an oval-ovoidal shape and no curvature. higher value), what differentiated this variety from B16 and B17.
Frontiers in Plant Science | www.frontiersin.org 8 July 2021 | Volume 12 | Article 696272Martínez-Ispizua et al. Characterisation of Valencian Eggplant Landraces
FIGURE 2 | The principal component analysis (PCA) for the 31 eggplant accessions based on the traits used for phenotyping represented in (A) the two first
components (first component, X-axis; second component, Y-axis) of the PCA (23.34 and 16.73% of total variation, respectively) and (B) the first and third components
(first component, X-axis; third component, Y-axis) of the PCA (23.34 and 12.04% of total variation, respectively). Groups, arranged based mainly on fruit skin colour
(G1 black-purple, G2 = striped, G3 = white, G4 = reddish purple), are represented in the plot: G1 ( ), G2 ( ), G3 ( ), and G4 ( ). Outliers B7 ( ), B20 ( ), and B24
( ) are also expressed in the figure.
Nutraceutical Compounds and Antioxidant Capacity 1.7-fold higher in landrace B14, which was 42% higher than for
Antioxidant Capacity the other varieties.
Antioxidant capacity was determined by the DPPH assay
(Table 6) and its range was 9.97–62.65%. Landrace B14 had a Flavonoids
statistically higher antioxidant capacity (mean value of 38.29 mg The total flavonoid content (Table 6) ranged between 5.75 and
g−1 FW) compared to B16 and B17, with no differences found 118.63 mg 100 g−1 FW among the three landraces. Significant
between them. Antioxidant capacity was 17.56% higher (1.8-fold) differences were found in the three landraces in relation to the
in B14. total flavonoid content. Landraces B16 and B17 did not show any
significant differences in the flavonoid concentration, and their
mean values were 27.25 and 26.1 mg 100 g−1 FW, respectively.
B14 stood out for its high flavonoid content (mean value of
Phenols 65.7 mg 100 g−1 FW). The flavonoid concentration was 59.4%
The total phenolic content (Table 6) for the three different higher in B14, which was 2.5-fold higher than B16 and B17.
eggplant cultivars ranged from 1.56 to 7.48 mg g−1 FW. B14
obtained a significantly higher mean value for phenolic content Ascorbic Acid
(4.47 mg g−1 FW), with no differences between B16 and B17 (2.53 The ascorbic acid content (Table 6) range was 3.45–18.45 mg
and 2.61 mg g−1 FW, respectively). Phenolic concentration was 100 g−1 FW for the three landraces. Significant differences were
Frontiers in Plant Science | www.frontiersin.org 9 July 2021 | Volume 12 | Article 696272Martínez-Ispizua et al. Characterisation of Valencian Eggplant Landraces TABLE 4 | Variation parameters for the conventional morphologic quantitative descriptors in the 31 local eggplant landraces cultivated in Spain. Statistics were performed by the formed groups based on fruit skin colour; G1 = black–purple, G2 = striped, G3 = white, G4 = reddish purple. Landrace G1 G2 Descriptors Mean Range CV (%) F–ratio Mean Range CV (%) F-ratio Plant Length 94.92 58–128 16.85 15.3*** 78.18 58–109 13.48 9.10*** Width 108.94 80–155 13.64 2.97** 113.75 89–143 11.02 3.88*** Branch density 5.54 4.90–7 9.93 11.06*** 5.60 5–8 10.81 3.84*** Leaf Length 20.22 11–27.90 14.10 2.58* 21.58 14.5–30 14.33 1.84 Width 12.71 8.50–21 21.26 5.17*** 16.81 10–24.50 18.50 4.63*** Pedicel length 8.72 3.50–16 31.70 4.97*** 8.82 4–15 23.14 4.41*** Pedicel thickness 5.53 3.35–9.10 19.04 5.32*** 7.00 4–10.75 21.53 26.75*** Dented leaf blade 3.44 1–7 48.90 28.95*** 6.23 4–8 15.89 18.33*** Blistering 2.90 1–5 24.85 16.05*** 3.58 1–7 55.61 170.99*** Pilosity (per cm−2 ) 5.80 3–7 23.91 79.8*** 5.42 3–7 26.80 200
Martínez-Ispizua et al.                                                                                                                  Characterisation of Valencian Eggplant Landraces

TABLE 4 | Continued

Landrace                                                                            G3                                                                     G4

Descriptors                                          Mean               Range               CV (%)         F-ratio          Mean                 Range              CV (%)         F-ratio

Length                                                13.79             10–21                16.23           3.57*          15.83               13.4–22             14.18            1.71
Width                                                 8.54            5.86–12.18             20.74         34.78***          4.10                 3–5.2             17.89            0.35
Length/width ratio                                    1.68            1.12–2.36              22.17         29.24***          4.03               2.91–4.92           13.77            0.06
Weight                                               349.17        121.90–791.40             37.53          9.57***        126.15             66.3–208.53           30.67            0.69
Calyx length                                          8.62            5.50–12.50             23.06         10.89***          8.23               4.7–12.5            22.87            0.29
Calyx lenght total lenght ratio                       63.37           35.26–100              26.15          5.82***         49.17             40.46–55.97            9.97          20.01**
Number of calyx prickles                              22.73              0–57                81.49          7.44**           5.89                 0–16              86.37            0.20

Landrace                                                                  B7                                             B20                                            B24

Descriptors                                               Mean                    Range                  Mean                    Range                      Mean                 Range

Plant
Length                                                     83.13                  79–91                  86.00                   66–106                     88.83                81–105
Width                                                      99.13                 93–103                 105.17                   98–108                    135.57               121–150
Branch density                                             5.63                    5–6                    5.00                       –                      6.00                    –
Leaf
Length                                                     22.50                 19.50–26                19.70                  18–21.90                    20.00                17–25
Width                                                      15.44                 12–17.50                13.86                  12.50–15                    14.79               13.50–17
Pedicel length                                             7.75                    6–11                   5.64                      5–6                     9.00                4.90–14
Pedicel thickness                                          5.80                 5.15–6.70                 5.76                  4.90–6.08                   5.41               4.70–6.30
Dented leaf blade                                          5.00                     –                     5.14                      4–6                     6.00                    –
Blistering                                                 1.00                     –                     5.43                      4–6                     3.29                   3–4
Pilosity (per cm−2 )                                       7.00                     –                     5.00                       –                      7.00                    –
Leaf L*                                                    25.16                 19.67–30                32.49                 28.26–36.95                  31.30             28.84–33.45
Leaf a*                                                   −3.72                −8.19 to 0.61             −7.99              −9.22 to −6.26                 −7.61              9.55 to −6.46
Leaf b*                                                    7.18                 3.36–11.44               12.39                 8.23–15.10                   10.73              9.89–11.13
Flowers
Number per inflorescence                                   2.63                    2–3                    1.00                       –                      1.00                    –
Fruit
Number of colours in commercial maturity                   1.00                     –                     2.00                       –                      3.00                    –
Length                                                     6.14                 5.60–6.80                22.11                 14.70–26.90                  11.71              8.10–14.30
Width                                                      7.11                 6.35–8.16                 3.72                  3.05–4.44                   9.04               7.36–9.81
Length/width ratio                                         0.87                 0.75–0.95                 6.17                  5.77–7.15                   1.36               1.09–1.64
Weight                                                    112.89               83.37–146.80             120.22               70.27–186.02                  341.42            231.83–465.69
Calyx length                                               6.94                 6.20–7.70                 5.89                  5.40–6.50                   8.00               5.80–11.30
Calyx lenght total lenght ratio                           110.86               95.59–120.69              25.98                 23.66–28.93                  68.89               50.74–93
Number of calyx prickles                                   2.63                    0–5                    3.50                      0–8                     4.50                  0–11

Data belonging to outliers (B7, B20, B24) is also shown. Values represent the mean, range, coefficient of variation (CV, %), F–ratio and significance (***, **, * indicate significance at p <
0.001, p < 0.01, p < 0.05), for the conventional morphological descriptors studied in cultivated eggplants (n = 8 for plant, leaf, and flower traits and n = 10 for fruit traits).

found in the three landraces. Landrace B16 had a statistically                                    significant differences between them and, respectively, presented
lower ascorbic acid content (mean value of 4.82 mg 100 g−1 FW)                                    1.65 and 1.78 µg g−1 of FW carotenoids as the mean value. The
compared to B14 and B17 (mean values of 10.94 and 12.75 mg                                        carotenoid concentration was 55.6% (2.27-fold) lower in B16 and
100 g−1 FW, respectively), with not differences between them.                                     B17 compared to B14.
The ascorbic acid concentration was 60% lower in B16, which is
2.5-fold lower than B14 and B17.                                                                  Soluble Sugars
                                                                                                  The sugar content (Table 6) for the different eggplant cultivars
Carotenoids                                                                                       ranged from 4.85 to 7.62 g 100 g−1 FW, which is a 1.57-fold
The total carotenoid content (Table 6) range was 1.46–4.06 µg                                     increase in content. Considerable differences were found in the
g−1 FW for the three landraces. The ANOVA analysis showed                                         studied landraces. B17 had a significantly higher mean value
that landrace B14 had the highest carotenoid content (mean value                                  for sugar content (6.48 g 100 g−1 FW), and no differences were
of 3.88 µg g−1 FW). Accessions B16 and B17 did not show                                           reported between B14 and B16 (5.336 and 4.96 g 100 g−1 FW,

Frontiers in Plant Science | www.frontiersin.org                                             11                                                    July 2021 | Volume 12 | Article 696272
Martínez-Ispizua et al. Characterisation of Valencian Eggplant Landraces
FIGURE 3 | Frequency distribution (%) of the stem, leaf and flower qualitative traits in the 31 eggplant landraces in each group (G1, G2, G3, G4) and B7, B20, and
B24. Measurements were taken when fruits reached the commercial maturity. Data for plant, leaf and flower traits were measured from eight independent plants,
which gave 8 replicates per landrace.
respectively). Sugar content was 20.64% higher in B17, which is DW, colour, nutraceutical compounds and sugar data (Table 7).
1.25-fold increase compared to B14 and B16. The pairwise coefficients showed a positive correlation and
a statistical significance for 11 pairs and only two negative
Correlation Between Antioxidant Compounds correlations. While DW was not correlated with any trait, the
In order to estimate the contribution of the quality traits colour parameters in the pulp showed marked correlations.
in the pulp of the fruits, several correlation analyses were The strongest and most positive ones were registered between
carried between the different combinations of the percentage of b∗ value and four of the five nutraceutical compounds (r
Frontiers in Plant Science | www.frontiersin.org 12 July 2021 | Volume 12 | Article 696272Martínez-Ispizua et al. Characterisation of Valencian Eggplant Landraces
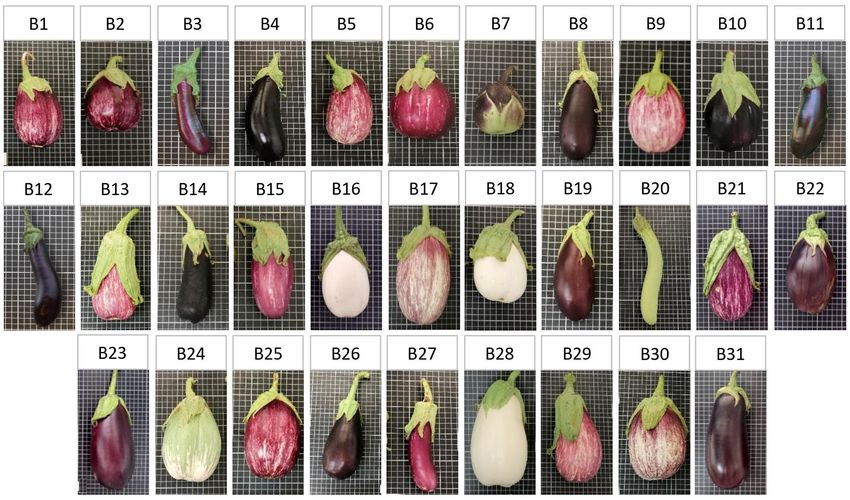
FIGURE 4 | Frequency distribution (%) of the fruit qualitative traits related to fruit shape and size in the 31 eggplant landraces in each group (G1, G2, G3, G4) and B7,
B20, and B24. Measurements were taken when fruits reached the commercial maturity. Data for fruit traits were measured from 10 different fruits which were
representative of the landrace.
= 0.9604 for carotenoids and r = 0.5769–0.6327 for DPPH, programmes. According to Uddin et al. (2015), clustering
phenols, and flavonoids). By contrast, a strong but negative accessions in different groups may be useful for providing a basis
correlation was observed between a∗ and carotenoids content for further crop improvement. Many characterisation studies
(r = −0.9771) while it was moderate and positive between L∗ based on standardised morphological and agronomic descriptors
and sugar content (r = 0.6226). When comparing nutraceutical developed by the International Board for Plant Genetic Resources
compounds, four strong significant and positive correlations have been performed in eggplants, and have demonstrated that
were recorded between the combinations of DPPH vs. phenolics, they are suitable for providing very helpful information for
DPPH vs. flavonoids, DPPH vs. carotenoids, and phenolics eggplant breeders (Prohens et al., 2005; Muñoz-Falcón et al.,
and flavonoids, where the coefficient r ranged from 0.7955 2009; Boyaci et al., 2015). In view of the success of these surveys,
to 0.8322. Phenols vs. carotenoidsalso showed moderate and the characterisation of the selected valencian varieties was made
positive correlation (r = 0.6898). Related to sugar content, it was following IBPGR guidelines. Furthermore, nutraceutical quality
positively correlated with carotenoids content (r = 0.6302). also defines a relevant role in crop improvement (Jenks and
Bebeli, 2011), mainly due to eggplants’ antioxidant content
(Peschel et al., 2006), including polyphenols, ascorbic acid and
DISCUSSION carotenoids (Du et al., 2009), among others.
The PCA has been previously used to determine the most
The morphological diversity of eggplant landraces has been the important traits for landrace characterisation of different species,
subject of many studies (Furini and Wunder, 2004; Prohens such as sweet potato (Yada et al., 2010), spider plant (Wasonga
et al., 2005; Behera et al., 2006; Muñoz-Falcón et al., 2008, et al., 2015), African tomato landraces (Tembe et al., 2018)
2009; Özer et al., 2011; Kaushik et al., 2016). These surveys are and eggplant (Cericola et al., 2013; Uddin et al., 2015; Tembe
necessary since they provide germplasm banks with very useful et al., 2020). According to our results, when subjecting the
information, and they contribute to optimise plant breeding phenotypic data of the 31 landraces to the PCA analysis, nine
Frontiers in Plant Science | www.frontiersin.org 13 July 2021 | Volume 12 | Article 696272Martínez-Ispizua et al. Characterisation of Valencian Eggplant Landraces FIGURE 5 | Frequency distribution (%) of the fruit qualitative traits related to fruit colour in the 31 eggplant landraces in each group (G1, G2, G3, G4) and B7, B20, and B24. Measurements were taken when fruits reached the commercial maturity. Data for fruit traits were measured from 10 different fruits which were representative of the landrace. TABLE 5 | Linear correlation coefficient (r) and its significance between the quantitative traits used for phenotyping in the collection of the 31 eggplant landraces cultivated in Spain. Trait Fr Length Fr Weight Fr Width Lf Length Lf Width N◦ calix pickels N◦ Fl P Length P Width Fr L/W Calyx L/Fr L −0.6542*** 0.0154 0.262 0.0743 0.0846 0.3839* 0.3658* –0.2841 –0.0477 −0.557** Fr Length 0.124 –0.3517 0.1206 –0.0733 –0.0277 –0.1463 0.4281* 0.0742 0.7692*** Fr Weight 0.858*** 0.4650** 0.4088* 0.4721** –0.1219 –0.2166 0.4282* −0.4887** Fr Width 0.3590* 0.3974* 0.4208* –0.0322 −0.4110* 0.3886* −0.8218*** Lf Length 0.7177*** 0.0893 0.2532 –0.0024 0.248 –0.1921 Lf Width 0.2524 0.1997 −0.3580* 0.2219 –0.2662 N◦ calix pickels 0.0342 –0.3069 0.1363 −0.311 N◦ Fl –0.0549 –0.0874 –0.1027 P Length 0.3004 0.4856** P Width –0.1965 ***, **, * indicate significance at p < 0.001, p < 0.01, p < 0.05 for r. P, plant; Lf, leaf; Fl, flower; Fr, fruit; L/W, length/width ratio. These significant values have been highlighted in bold. principal components were established and corresponded to an in addition to the selection processes followed by farmers, 80% total variation. Of the nine components, none explained generated a differentiation in the eggplants of the same origin. more than 25% of the diversity among landraces. For this reason, Likewise, together with this diversification process, as eggplants from the PCA analysis we inferred a wide diversity among are generally self-pollinated plants (Pessarakli et al., 2004), the accessions, even if landraces belonged to the same Mediterranean genetic isolation of various eggplant populations may has been area. Muñoz-Falcón et al. (2008) suggested that local conditions, favoured. The mayor principal component that explained 23.3% Frontiers in Plant Science | www.frontiersin.org 14 July 2021 | Volume 12 | Article 696272
Martínez-Ispizua et al.                                                                                                               Characterisation of Valencian Eggplant Landraces

TABLE 6 | Fruit quality traits in three local eggplant landraces cultivated in Spain.

Trait                                                   B14                                                B16                                          B17

DW (%)                                           23.09 ± 4.60                                         21.87 ± 3.76                               24.38 ± 8.53                               ns
Pulp L*                                          72.74 ± 87.11b                                      73.22–77.23 ± b                             71.27 ± 88.48a                             **
Pulp a*                                          −5.57 ± −3.72b                                       −1.14 ± −1.05a                            −2.27 ± −0.61a                              ***
Pulp b*                                          17.23 ± 22.87a                                        9.57 ± 10.62b                               7.76 ± 12.27b                            ***
                                                                   a                                                 b
DPPH (%)                                         38.29 ± 11.03                                        19.75 ± 6.74                               21.71 ± 3.89b                              ***
Phe (mg g−1 FW)                                    4.47 ± 1.21a                                        2.53 ± 0.64b                                2.61 ± 0.65b                             ***
Flav (mg 100 g−1 FW)                               65.7 ± 23.90a                                      27.25 ± 11.64b                             26.10 ± 8.99b                              ***
Asc (mg 100 g−1 FW)                              10.95 ± 3.67a                                         4.82 ± 1.10b                              12.75 ± 3.46a                              ***
Car (µg g−1 FW)                                    3.88 ± 0.17a                                        1.65 ± 0.21b                                1.78 ± 0.16b                             ***
Sugars (g 100 g−1 FW)                              5.34 ± 1.21b                                        4.84 ± 0.28b                                6.48 ± 0.96a                              *

Values are the mean ± SD of n = 5 for dry weight and sugars, n = 20 for colour parameters and n = 10 for antioxidant traits. Different letters in a row indicate significant differences at p <
0.05 (LSD test). ***, **, * and ns denotes significance at p < 0.001, p < 0.01, p < 0.05 and non-significant values, respectively. DW, Dry Weight; L*, lightness value; a*, greenness/redness
value; b*, blueness/yellowness value; DPPH, Antioxidant capacity; Phe, Phenols; Flav, Flavonoids; Asc, Ascorbic acid; Car, Carotenoid concentration.

TABLE 7 | Linear correlation coefficient (r) and its significance between fruit quality traits (dry weight, pulp colour, nutraceutical compounds, and sugars) in the collection
of the three eggplant landraces (B14, B16, B17) cultivated in Spain.

Trait             Pulp L*            Pulp a*             Pulp b*              DPPH                   Phe                  Flav               Asc                  Car                Sugars

% DW             −0.2284              0.007               −0.03              −0.0694               −0.0077               −0.0203          −0.0677              −0.0969              −0.1582
Pulp L*                              −0.2432            −0.3297*              −0.136                −0.145               −0.1223           0.2949               0.2295               0.6226*
Pulp a*                                                   0.0245             −0.0267                0.0202               −0.0087          −0.3182             −0.9771***              0.088
Pulp b*                                                                     0.6327***              0.5864***          0.5769***            0.3631              0.9604***            −0.1974
DPPH                                                                                               0.8263***          0.8322***            0.1716              0.7955**             −0.2803
Phe                                                                                                                   0.8256***            0.1461               0.6898*             −0.3188
Flav                                                                                                                                       0.1289               0.4348              −0.3722
Asc                                                                                                                                                             0.5248               0.6302*
Car                                                                                                                                                                                  0.2121

***, **, * indicate significant at p < 0.001, p < 0.01, p < 0.05 values for r. DW, Dry Weight; L*, lightness value; a*, greenness/redness value; b* , blueness/yellowness value; DPPH,
Antioxidant capacity; Phe, Phenols; Flav, Flavonoids; Asc, Ascorbic acid; Car< Carotenoid concentration. These significant values have been highlighted in bold.

of the total variability correlated mainly with the fruit descriptors.                             width were positively and significantly correlated with the
This separation of accessions associated with fruit traits has                                     average fruit weight (r = 0.4650 and r = 0.4088) and width
also been described by other authors (Prohens et al., 2005;                                        (r = 0.359 and r = 0.3974). A larger foliar area can offer
Özer et al., 2011; Tembe et al., 2020), which confirms that                                        better accumulation of photosynthates in plants, to ultimately
the morphological variation in the organ for which a crop                                          produce heavier and larger fruits (Kumar et al., 2016). A
is selected widens during the domestication process (Meyer                                         statistically significant relation existed between the number
and Purugganan, 2013). Despite the genetic bottleneck that                                         of calyx prickles with fruit weight (r = 0.4721) and width (r
eggplant domestication has undergone (Lester and Hasan, 1991),                                     = 0.4208), while the absence of calyx prickles is desirable for
considerable diversity is found among landraces, unlike that seen                                  harvest processes or consumer handling. On the contrary,
in commercial varieties, especially in F1 hybrids (Muñoz-Falcón                                    a negative, but statistically significant, correlation occurred
et al., 2009). Although commercial hybrids have been selected for                                  between the calyx length ratio and fruit length (r = −0.6542).
traits like earliness, yield, lack of prickles or colour, the diversity                            Owning a short calyx (∼20%) is a desirable attribute from the
of other morphological characters has been narrowed (Prohens                                       phytosanitary point of view since it helps to prevent eggplants
et al., 2005).                                                                                     from white mites, Botrytis cinerea and several fungal diseases,
    The correlation analysis measures the degree of relation                                       whose presence is favoured by relative high humidity as petals
between the selected phenotypic quantitative traits,                                               are adhered between the calyx and fruit (Aramendiz et al.,
distinguishing remarkable characters for crop improvement                                          2006). On this matter, and in relation to this trait, slightly heavy
(Kranthi and Celine, 2013; Kumar et al., 2016). Of the obtained                                    and elongated fruits would be preferable. Flower number per
values, two clear trends were observed. The higher the plant                                       inflorescence was positively correlated with the calyx length
height value is, the longer and lighter fruits are, while the wider                                ratio (r = 0.3658), while showing a negative tendency toward
the plant is, the wider and heavier its fruits. Leaf length and                                    a relation with big and heavy fruit. Altogether would mean

Frontiers in Plant Science | www.frontiersin.org                                              15                                                   July 2021 | Volume 12 | Article 696272
You can also read