Parent Language Input Prior to School Forecasts Change in Children's Language-Related Cortical Structures During Mid-Adolescence
←
→
Page content transcription
If your browser does not render page correctly, please read the page content below
ORIGINAL RESEARCH
                                                                                                                                                published: 02 August 2021
                                                                                                                                         doi: 10.3389/fnhum.2021.650152

                                           Parent Language Input Prior to
                                           School Forecasts Change in
                                           Children’s Language-Related
                                           Cortical Structures During
                                           Mid-Adolescence
                                           Ö. Ece Demir-Lira 1,2,3* , Salomi S. Asaridou 4 , Collin Nolte 5 , Steven L. Small 6 and
                                           Susan Goldin-Meadow 7
                                           1
                                             Department of Psychological and Brain Sciences, University of Iowa, Iowa City, IA, United States, 2 DeLTA Center,
                                           University of Iowa, Iowa City, IA, United States, 3 Iowa Neuroscience Institute, University of Iowa, Iowa City, IA, United States,
                                           4
                                             Department of Experimental Psychology, University of Oxford, Oxford, United Kingdom, 5 Department of Biostatistics,
                                           University of Iowa, Iowa City, IA, United States, 6 School of Behavioral and Brain Sciences, University of Texas at Dallas,
                                           Richardson, TX, United States, 7 Department of Psychology, University of Chicago, Chicago, IL, United States

                                           Children differ widely in their early language development, and this variability has
                                           important implications for later life outcomes. Parent language input is a strong
                                           experiential factor predicting the variability in children’s early language skills. However,
                          Edited by:       little is known about the brain or cognitive mechanisms that underlie the relationship.
               Diana López-Barroso,        In addressing this gap, we used longitudinal data spanning 15 years to examine the
          University of Malaga, Spain
                                           role of early parental language input that children receive during preschool years in
                       Reviewed by:
             Anna Martinez-Alvarez,
                                           the development of brain structures that support language processing during school
            University of Padua, Italy     years. Using naturalistic parent–child interactions, we measured parental language input
                   Abdellah Fourtassi,     (amount and complexity) to children between the ages of 18 and 42 months (n = 23). We
      Aix-Marseille Université, France
                                           then assessed longitudinal changes in children’s cortical thickness measured at five time
                *Correspondence:
                  Ö. Ece Demir-Lira        points between 9 and 16 years of age. We focused on specific regions of interest (ROIs)
            ece-demirlira@uiowa.edu        that have been shown to play a role in language processing. Our results support the
                                           view that, even after accounting for important covariates such as parental intelligence
                   Specialty section:
        This article was submitted to      quotient (IQ) and education, the amount and complexity of language input to a young
               Speech and Language,        child prior to school forecasts the rate of change in cortical thickness during the 7-year
                a section of the journal
    Frontiers in Human Neuroscience
                                           period from 51/2 to 121/2 years later. Examining the proximal correlates of change in brain
         Received: 06 January 2021
                                           and cognitive differences has the potential to inform targets for effective prevention and
           Accepted: 04 June 2021          intervention strategies.
         Published: 02 August 2021
                                           Keywords: MRI, language acquisition, brain structure, parental language input, language development, cortical
                           Citation:       thickness
         Demir-Lira ÖE, Asaridou SS,
               Nolte C, Small SL and
     Goldin-Meadow S (2021) Parent
      Language Input Prior to School
                                           INTRODUCTION
      Forecasts Change in Children’s
Language-Related Cortical Structures
                                           Language skills are fundamental for children’s later life outcomes (e.g., Duncan et al., 2007;
            During Mid-Adolescence.        Marchman and Fernald, 2008; Bleses et al., 2016). Variability in children’s language skills early
   Front. Hum. Neurosci. 15:650152.        in life has been linked to variability in children’s home environments. Indeed, one of the best-
   doi: 10.3389/fnhum.2021.650152          established findings in the developmental literature is that variability in children’s early language

Frontiers in Human Neuroscience | www.frontiersin.org                               1                                            August 2021 | Volume 15 | Article 650152
Demir-Lira et al. Input and Child Cortical Structure
skill is influenced by the quantity and quality of language processing (Price, 2012), the SMG in phonological processing
input they receive from their parents (e.g., Huttenlocher et al., (Rodríguez-Fornells et al., 2009), and the IFG in speech
1991, 2002; Hart and Risley, 1995; Weizman and Snow, 2001; processing and lexical competition (Davis and Gaskell, 2009;
Hoff, 2003; Rowe and Goldin-Meadow, 2009; Rowe et al., 2009; Rodríguez-Fornells et al., 2009; Price, 2010, 2012; Fedorenko
Cartmill et al., 2013). Variability in early child language skills have and Thompson-Schill, 2014; Li et al., 2014). Brain structure
also been shown to predict variability in later structural brain in these regions of interest (ROIs) is related to children’s
differences in language areas. For example, vocabulary growth language skills. For example, left IFG, MTG and STG volumes
measured at age 14–58 months predicts cortical thickness in differentiate typically-developing children from children with
the left supramarginal gyrus (SMG) at age 8 to 10 years old language disorders (e.g., Badcock et al., 2012; Lee et al., 2020).
(Asaridou et al., 2017). However, less is known about the relation The focus of the current paper is on brain structure,
between children’s experiential factors early in life and change specifically, cortical thickness, because underlying cellular
in later brain structures. Here, we attempt to bridge this gap components of cortical thickness are amenable to change as a
using a unique longitudinal data set spanning 15 years. We ask result of postnatal experience and learning (Diamond et al.,
whether parental language input during preschool years predicts 1964; Black et al., 1990; Anderson et al., 1994; Kleim et al.,
changes in later (mid-adolescent) cortical structures that subserve 1996). Cortical thickness is measured by the distance between
language processing, over and above possible covariates such as the boundary of white and cortical gray matter, and gray matter
parental socioeconomic status (SES) or intelligence quotient (IQ). and the pia mater. Cortical thickness varies roughly between 2
and 4 mm, with frontal and occipital poles being thinnest and
temporal and insular cortices being thickest (Ribeiro et al., 2013).
PARENTAL LANGUAGE INPUT AND Although, as a general trend, cortical thickness decreases over
CHILD LANGUAGE DEVELOPMENT childhood and early adolescence, ultimately plateauing in early-
to mid-adulthood, development varies across cortical regions.
Previous behavioral work highlights the role of parental cognitive Some regions, such as temporal areas, exhibit less linear and more
stimulation, and the role of parental language input more quadratic patterns of development than other areas (Sowell et al.,
specifically, in shaping children’s cognitive outcomes. One of the 2003; Raznahan et al., 2011; Mutlu et al., 2013; Mills et al., 2016).
most frequently reported findings in the developmental literature
is the association between early parental language input and
language development (e.g., Huttenlocher et al., 1991, 2002; Hart PARENTAL LANGUAGE INPUT AND
and Risley, 1995; Weizman and Snow, 2001; Hoff, 2003; Rowe BRAIN AREAS ASSOCIATED WITH
and Goldin-Meadow, 2009; Rowe et al., 2009). Language input LANGUAGE DEVELOPMENT
more strongly predicts child language outcomes than SES or a
variety of other characteristics of parent–child interactions, such Discussions of the role that parental input plays in language
as parental affect. Measures of language input often focus on its development rarely include the underlying neural basis of this
quantity, such as the number of word tokens parents produce development. When experiential factors have been considered
(Huttenlocher et al., 1991; Hart and Risley, 1995; Weizman and in relation to the neurobiological basis of language processing,
Snow, 2001; Rowe, 2008, 2012; Barnes, 2011; Weisleder and parental SES (typically measured by family income, parental
Fernald, 2013; Demir-Lira et al., 2019; Rowe and Snow, 2020). educational attainment, and/or parental occupational prestige)
More recent research has also highlighted the complexity of has been the focus (Duncan and Magnuson, 2012). For example,
language input, such as parental use of rare words or talk about SES disadvantage has been associated with reduced volume (e.g.,
abstract topics, as a predictor (e.g., Demir et al., 2015; Rowe and Jednoróg et al., 2012; Hair et al., 2015), thickness (Mackey et al.,
Snow, 2020; see also Cartmill et al., 2013). In the current paper, to 2015), and surface area (Noble et al., 2015) in cortical regions
gain a comprehensive view of children’s input, we consider both underlying language comprehension, including perisylvian areas
the quantity and complexity of early parental input in predicting (e.g., STG) and ventrolateral prefrontal areas (e.g., IFG; Noble
later child brain structure. et al., 2012; Piccolo et al., 2016). SES-related differences are also
observed in white matter structures, and in functional brain
systems, involved in language processing (Raizada et al., 2008;
BRAIN AREAS ASSOCIATED WITH Gullick et al., 2016; Younger et al., 2019). However, parental
LANGUAGE DEVELOPMENT SES is a complex construct of many components (e.g., parental
income, education, and neighborhood characteristics). Any one
A wide set of networks in the brain supports language of these components of SES could be influencing children’s
development. One network, particularly specialized for language, academic outcomes via more day-to-day interactions, such as
includes (among other regions) the superior temporal gyrus parental language input.
(STG), superior temporal sulcus (STS), middle temporal gyrus A few recent studies have begun to examine the associations
(MTG), SMG, and inferior frontal gyrus (IFG; pars opercularis between parental language input and brain structure and
and pars triangularis) (Wilke et al., 2009; Friederici and Gierhan, function for language processing. Avants et al. (2015) found
2013). Among other roles, STG is thought to be involved in associations between HOME, an observational measure of the
speech perception (Hickok and Poeppel, 2007), MTG in semantic home environment, and later cortical thickness in areas central
Frontiers in Human Neuroscience | www.frontiersin.org 2 August 2021 | Volume 15 | Article 650152Demir-Lira et al. Input and Child Cortical Structure
to language processing. Using naturalistic recordings of parent– children already show great variability in language development.
child conversations in the home, Romeo et al. (2018a) showed We then assessed children’s brain structure at five different time
that, in 4 to 6-year-old children, the number of conversational points between 9 and 16 years of age. We focus on brain regions
turns with adults in the home environment (a measure of input that have been shown to play a particularly strong role in language
complexity), predicts left IFG activation during a story-listening processing. We also focus on cortical thickness as our measures
task completed at the same age, and that number of turns of brain structure. Cortical thickness is tied to the number of
mediates the relation between SES and children’s language skill, neurons in a cortical column, the amount of glial and capillary
as well as white matter connectivity in left arcuate and superior support, and dendritic branching (Rakic, 1988, 2009), all of which
longitudinal fasciculi, also at the same age (Romeo et al., 2018b). are amenable to change as a result of postnatal experience and
Building on this work, Merz et al. (2020) found that the greater learning and thus deem cortical thickness as particularly sensitive
the input quantity (number of adult words) and complexity to environmental experiences (Black et al., 1990; Anderson
(number of conversational turns) in 5- to 9-year-old children, the et al., 1994; Kleim et al., 1996). Our main research question
greater left perisylvian cortical surface area in these children at is how parental language input during preschool years relates
the same age. The input quantity and complexity measures were to changes during mid-adolescence in child brain structures
highly correlated and revealed similar associations. involved in language processing. Based on prior behavioral and
We add to this small but growing literature in several ways. neuroimaging literature, we hypothesize that parental language
First, previous investigations examined concurrent relations input will positively predict both average cortical thickness and
between parental input and child brain structure. However, changes in cortical thickness, controlling for parent background
to explore predictive relations, we need to examine parental variables, such as parent income, education and IQ.
input early in development, and child brain structure later in
development in the same children – the focus of this paper.
Second, previous studies measured brain structure at a single time MATERIALS AND METHODS
point, but parental input might have different effects on child
measures if those measures are taken longitudinally (e.g., Rowe Participants
et al., 2012, with respect to behavioral measures; Piccolo et al., Twenty-three children (12 female) participated in the study. All
2016, with respect to brain measures). Here, we assess changes were native speakers of American English and were studied
in brain structure over time during development. Third, existing over a 15-year period. The children were drawn from a sample
studies rely on recording devices (e.g., LENA devices) that of 64 children participating in a larger, longitudinal study of
provide automatized measures, but do not produce transcription children’s language development in the greater Chicago area
of audio recordings. Past studies leveraged conversational turns (see Goldin-Meadow et al., 2014). Participants were recruited
as a measure of input complexity, which is automatically from the Chicago area via mailings to families in targeted zip
calculated by LENA. However, conversational turns do not reveal codes and via an advertisement in a free parent magazine.
the specific linguistic features that are predicting later outcomes. A subset of the 64 children from the original sample agreed to
Here, we consider measures not only of input quantity, but participate in the neuroimaging component of the larger study
also of input complexity, which requires hand-coding. Fourth, (n = 23); these are the families described in this study. Each
the youngest children included in previous studies of parent parent gave written informed consent following the guidelines
language input–child brain structure relations were 4 years old; of the Institutional Review Boards for the Division of Biological
however, by 4, children already vary greatly in their language Sciences at The University of Chicago, and the Office of Research
skills (Fenson et al., 1994). Recent work shows that early at the University of California, Irvine, which approved the study.
parental input may predict later child outcomes better than input Children gave verbal assent. All participants reported normal
in later preschool years (Rowe et al., 2012). Here, we focus hearing and normal or corrected-to-normal vision. No parent
on parental input beginning at child age 18 months. Finally, reported any history of neurological or developmental disorders
we examine the relation of this early parental input to child in their child. Handedness was assessed using the Edinburgh
brain structure in mid-adolescence, a much later age than has handedness inventory (Oldfield, 1971).
typically been studied. Parent language input measures were collected at the 18, 30,
and 42 month behavioral visits (see procedure below). A total of
30 participants were tested in the Magnetic resonance imaging
CURRENT STUDY (MRI) component over the 5 years between 9 and 16 years of
age. Seven participants were excluded from the analyses because
Ours is the first study to examine predictive, longitudinal they did not have the early parental input data, resulting in a
relations between early parental language input and changes in final sample of 23 families. As described below, children were
child brain structure over time. We examine the relation between scanned a maximum of five times – a number of individual MRI
two measures of early parental input – quantity and complexity – sessions were excluded because the child failed to complete the
between child age 18 and 42 months, and changes in child cortical session or moved excessively (more than 10% of the total number
thickness between 9 and 16 years of age. To do so, we gathered of volumes).
a range of input measures collected directly from naturalistic According to parent report, 19 children were White, 2 were
interactions in the home at child age 18–42 months, when African–American, and 2 were of mixed race. In terms of
Frontiers in Human Neuroscience | www.frontiersin.org 3 August 2021 | Volume 15 | Article 650152Demir-Lira et al. Input and Child Cortical Structure
ethnicity, 3 of the children were reported to be Hispanic and 20 the number of word tokens, (2) number of rare words, and
were non-Hispanic. Parent education (in years) was coded on a (3) decontextualized utterances parents produced at child age
categorical scale (10 = less than high school degree, 12 = high 18, 30 and 42 months during the 90-min visits. Word tokens
school degree, 14 = some college or associate degree, 16 = college were the total number of words parents produced. Rare words
degree, 18 = more than college). In this sample of 23 children, were identified using the method described by Beals and Tabors
average parent education was 15.6 years (SD = 2.4, range = 10– (1995) (see also Weizman and Snow, 2001). We removed all non-
18) and average family income was $59,456 (SD = $30,738, dictionary words from the corpus of spoken parent words and
range = $7500–$100,000). For 22 children, mother was the the most common words (and all their inflected forms) known
primary caregiver; for 1 child, father was the primary caregiver. by fourth graders, as judged by teachers, and compiled in the
All but 3 of the families reported the education level of a Dale-Chall word list (Dale and Chall, 1948; Chall and Dale,
secondary caregiver as well. For these 20 families, education levels 1995). The remaining words in the parent input corpus were
for the primary and secondary caregivers were highly correlated, considered rare words. Decontextualized language utterances
r = 0.57, p = 0.008. Because family income and caregiver produced by parents and children were identified and coded as in
education were highly correlated, the two were combined using Rowe (2012). Categories of decontextualized language included
a principal components analysis (PCA), which returned a single narrative, pretend, and explanation (see Rowe, 2012; Demir et al.,
composite measure for SES. Correlation between SES composite 2015; for detailed definitions of each category). All utterances
and education is ρ = 0.86, and correlation between SES composite marked as narrative, pretend or explanation were considered
and income is ρ = 0.69. SES captured 47% of the variability decontextualized. Since effectiveness of specific input features
between education and income. varies by child age, we focused on features of the input that
have been shown to predict child language outcomes during
Behavioral Procedure the period observed (Rowe and Snow, 2020; Silvey et al., 2021).
The parental language input included in this study was collected We also excluded interactional aspects of the input, such as
as part of the larger longitudinal study described previously (see conversational turns, that might reflect broader characteristics
Goldin-Meadow et al., 2014). We coded videotapes of parents of the parent–child interactions, such as parent sensitivity or
interacting with their children for approximately 90 min during parent–child synchrony.
home visits that occurred every 4 months between child ages
14–58 months. Parents were not given any specific instructions Parent IQ
and were asked to engage in their normal daily activities. Typical Parent verbal IQ was measured using Wechsler Abbreviated
activities included toy play, book reading, and eating meals and Scale of Intelligence (WASI-II, Wechsler, 2011) when children
snacks. In the current study, three visits were chosen (visits at were in 5th grade. Average parent IQ was 113.5 (SD = 18.4,
child age 18, 30, and 42 months). We focused on these three time range = 80–149).
points for multiple reasons: (1) previous research using data from
the larger sample showed significant relations between input Child Peabody Picture Vocabulary Test
provided at these three time points and later child outcomes, To examine the impact of early parent language input on later
highlighting the role of children’s early experiences (Rowe et al., child brain imaging, above and beyond the child’s language skill at
2012); (2) the earlier the ages, the lower the possibility of children the time of imaging, we included a measure of children’s language
directing the input parents provide to them, (3) recent work has skill (Peabody Picture Vocabulary Test, PPVT III; Dunn and
shown that parents tend to be stable in their input in these early Dunn, 1997), administered at 4th grade during the period when
years (Silvey et al., 2021); and finally, (4) input in earlier preschool the imaging was done. The PPVT is a widely used measure of
years, compared to the entire preschool period up to 58 months, vocabulary comprehension with published norms. Average PPVT
reveals similar relations to later outcomes (Rowe et al., 2012). score was 113.61.
Behavioral Measures Neuroimaging Procedure
Parent Language Input Measures Children were scanned in five waves from 9 to 16 years of age. As
All parent and child speech in the videotaped sessions were in other large-scale studies focusing on brain development during
transcribed. Only speech directed to the child was used in the childhood, this age span was selected to capture a rapid period of
current analyses based on previous work suggesting that language brain development during late childhood and adolescence when
directed to the child might be more strongly related to child high individual variability is observed (e.g., Sowell et al., 2001,
language development than overheard speech (Shneidman et al., 2002; Casey et al., 2018). For a detailed summary of the number of
2013; Weisleder and Fernald, 2013). The unit of transcription children that participated in each year and their age, see Table 1.
was the utterance. An utterance was defined as any sequence Not all children participated in all scanning sessions and each
of words that was preceded and followed by a pause, a change child contributed 1–5 scans. Six children were scanned once, 3
in conversational turn, or a change in intonational pattern. children were scanned twice, 4 three times, 2 four times, and 8 five
Transcription reliability was established by having a second times. On average children were scanned 2.9 times, and we had a
individual transcribe 20% of the videotapes with a reliability total of 83 scans. Although the sample size is modest (n = 23),
criterion of 95% agreement on utterance transcription. Our it is important to highlight that, according to a recent review on
measures of input consisted of three different components: (1) neuroimaging studies on structural brain development, only 16
Frontiers in Human Neuroscience | www.frontiersin.org 4 August 2021 | Volume 15 | Article 650152Demir-Lira et al. Input and Child Cortical Structure
TABLE 1 | Descriptive statistics for child age at MRI scanning session. Given our overall modest sample size, we focused on six
ROIs that have been shown to play a particularly important
Age
role in language processing. Based on the previous literature
M (SD) Range n on neurobiological basis of language development and our own
work, which has found a relation between children’s own early
Year 1 9.31 (0.54) 8.66–10.29 16
language skills and their later cortical thickness in the children
Year 2 10.47 (0.60) 9.71–11.32 11
observed in this study (Asaridou et al., 2017), we examined
Year 3 11.44 (0.50) 10.79–12.19 13
cortical thickness in six ROIs in each hemisphere (12 regions
Year 4 13.94 (0.59) 13.21–15.29 19
in total): STG, STS, MTG, SMG, IFG (pars opercularis and
Year 5 15.97 (0.28) 15.48–16.40 14
pars triangularis) in each of the hemispheres (e.g., Price, 2010;
Descriptive statistics include mean age (M), standard deviation (SD), and sample Li et al., 2014).
size per year with valid measurements (n).
Statistical Analysis Plan
prior studies had on average more than 2 scans per participant, To address our research question, we built two sets of models. For
and only 3 prior studies had included three or more scans on the first set of models, we ran traditional, frequentist analysis of
average per participant (Vijayakumar et al., 2018). the data using linear mixed models. Given the sample size, we also
performed the model fitting process under a Bayesian paradigm
to complement the frequentist analyses (McNeish and Stapleton,
MRI Acquisition
2016). The second set of analyses can be found in Supplementary
The first to third waves of imaging data were acquired on
Tables 1, 2 and Supplementary Figure 1. The direction of
a 3T Siemens Trio scanner with a 32-channel head-coil at
effects for parameters of interest was consistent across the
Northwestern University’s Center for Translational Imaging
frequentist and Bayesian models. For the frequentist approach,
in Chicago. A T1-weighted structural scan was acquired for
linear mixed models were built in R using the lmer package (R
each participant (1 mm × 1 mm × 1 mm resolution;
Core Team, 2017). The dependent variable was cortical thickness.
sagittal acquisition). T1-weighted 3D spoiled gradient echo
We started with a parsimonious model of fixed effects including
(MP-RAGE) sequences were obtained with TR = 2,300 ms,
variables which, on theoretical grounds, we wanted to control for
TE = 2.91 ms, flip angle = 9◦ , inversion time = 900 ms,
independent of effect size. These variables included a measure for
and 256 contiguous slices (slice thickness = 1 mm, voxel
parent SES composite, maternal IQ, sex, age, and an indicator
size = 1 mm × 1 mm × 1 mm, matrix size = 256 × 256).
for the fMRI scanner used (which changed after the 3rd scan).
The fourth to fifth waves of imaging data were acquired on
As measures for body size were unavailable, a mean thickness
a 3T Siemens Prisma Scanner with a 32-channel head-coil,
from 5 occipital regions of the brain (middle occipital gyrus,
also at the Northwestern University Center for Translational
superior occipital, occipital pole, occipital sulcus, and parieto-
Imaging. A T1-weighted structural scan was acquired with
occipital sulcus), typically not associated with auditory language
a magnetization-prepared rapid gradient echo (MP-RAGE)
processing, were used to control for brain size (Price, 2010). As we
sequence (TR = 2300 ms, TE = 1.86 ms, flip angle = 7◦ ,
were interested in change in thickness over time, the minimum
Inversion Time = 1180 ms, 208 contiguous sagittal slices, slice
age value was subtracted from all ages, thus centering age at
thickness = 0.8 mm, voxel size = 0.8 mm × 0.8 mm × 0.8 mm,
the beginning of the first scan. Similar to other longitudinal
matrix size = 320 × 320). Head motion was minimized
studies, this was done so that the zero-time point (the beginning
using foam padding around the head, and scanner noise was
of first scan) was included in the range of the model, and so
minimized with earplugs.
that age-related coefficients could be interpreted as one-year
increases in age from the onset of the scans. Further, by doing
Freesurfer Processing: Cortical so, we can interpret the intercept term as cortical thickness at
Parcelation the beginning of the study. Additionally, exploratory analyses
Cortical reconstruction of white and pial surface models was suggested that the largest difference in mean thickness between
performed using Freesurfer version 5.3.01 (see Dale et al., 1999; high and low language input groups (partitioned by the sign of
Fischl et al., 1999). The cortical surface models were manually the first principal component) occurred at younger ages. Setting
reviewed and edited for technical accuracy. We also performed the adjusted age to start at zero allowed this time to serve as a
quality assurance using the Freesurfer QA Toolbox v1.2. Sulcal baseline for model covariates. Model covariates for IQ, language
and gyral structures were identified automatically (Fischl, 2004) input composite, SES composite, mean occipital thickness were
and parcellated using the Destrieux cortical atlas for anatomical all centered and scaled.
labeling (Destrieux et al., 2010). This parcelation scheme results Previous studies (e.g., Vijayakumar et al., 2016) indicate that
in 148 cortical regions (74 per hemisphere). Cortical thickness change in brain thickness during the 9–16 year period, especially
was estimated as the average distance between the white and the in the areas we focus on, could follow a quadratic pattern. Since
pial surface reconstructions (Fischl and Dale, 2000). our null hypothesis was that linguistic input does not have relate
to brain thickness over time, we included a quadratic interaction
1
See http://surfer.nmr.mgh.harvard.edu/ for details on the Freesurfer surface- between age and model covariates. Specifically, in addition to
based pipeline. the hypothesized quadratic change in thickness over age, we
Frontiers in Human Neuroscience | www.frontiersin.org 5 August 2021 | Volume 15 | Article 650152Demir-Lira et al. Input and Child Cortical Structure
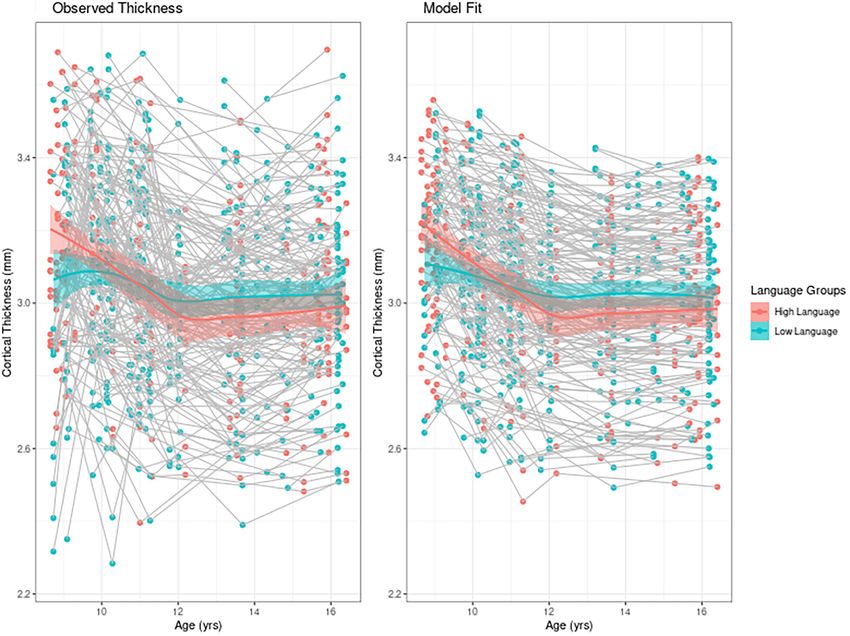
FIGURE 1 | Individual trajectories of cortical thickness (A) mean observed cortical thickness by group and (B) model fit by group. For visualization purposes only,
high and low language groups are separated by median language input PCA value. In both figures the solid line represents the Loess curve fit on the observation.
The six children who participated in only one MRI session are represented with a single point in the figure.
attempted to account for the fact that linguistic input itself (as included in this study only those children who took part in the
well as other covariates) may have a quadratic effect on cortical MRI study. The numbers for the subsample who were included
thickness. Inclusion of input for language, as well as quadratic in the study were representative of the results based on the full
interactions of all variables with age, were determined by Akaike sample discussed in other publications (e.g., Rowe, 2012). Parent
information criterion (AIC). Random effects for the model were input measures on our subsample at different time points were
used to account for correlation between observations, and were significantly correlated with each other, with correlations ranging
selected based on the restricted maximum likelihood (REML) from 0.19 to 0.74, and an average correlation of 0.48 – consistent
criterion. Random effects selected include random intercepts with our work with the full sample showing that parents are
for subject, brain region, and laterality. A residuals analysis relatively stable in their input over time (Silvey et al., 2021). See
was performed on the final models to verify the assumption of the Supplementary Materials for correlations between different
normality for the model error. Reported p-values were computed time points separately (Supplementary Table 3).
with Satterthwaite approximation in the R package lmerTest Because the primary goal of the current study was to gather an
(Kuznetsova et al., 2016). overall view of children’s early language input, we used PCA to
create a single composite measure of language input. The decision
to focus on a composite input measure was further justified by
RESULTS the high degree of collinearity between the different measures.
Measures of parental input were significantly correlated with
Descriptive Analyses each other (mean word tokens and decontextualized utterances,
Parents showed variability in the quantity and complexity of r = 0.81, p < 0.001; mean word tokens and rare words, r = 0.59,
language input at 18, 30, and 42 months (see Table 2). For p < 0.001; mean decontextualized utterances and rare words,
example, some parents produced no decontextualized utterances r = 0.45, p < 0.001). However, including rare words in the PCA
at all; others produced over 600 during their 90-min visits. We decreased the variance explained by the first principal component
Frontiers in Human Neuroscience | www.frontiersin.org 6 August 2021 | Volume 15 | Article 650152Demir-Lira et al. Input and Child Cortical Structure
TABLE 2 | Descriptive statistics for parental input measures including mean (M), standard deviation (SD), and min–max range (n = 23).
18 months 30 months 42 months
M (SD) Range
Word tokens 3.435 (2.176) 360–9.227 3.603 (1.825) 1.096–7.673 3.634 (1.923) 488–9.087
Decontextualized utterances 18.87 (22.23) 0–73 62.3 (67.01) 0–301 84.13 (133.09) 0–628
Rare words 25.57 (19.52) 1–83 30.09 (15.59) 10–76 37.35 (22.72) 6–100
to 32%, a net loss even after considering the addition of three Particularly relevant to our main question, we saw that
measures (one for each time point), suggesting that including rare language input interacted quadratically with age. Specifically, the
words increased noise that may, or may not, be related to our covariates indicate a concave upward parabola for children with
outcome of interest. We conducted analyses by combining mean greater language input during the early years than for children
word tokens and decontextualized utterances from the three time with less language input. This trend suggests that children with
points into a single composite input score. The first principal high language input had overall higher cortical thickness at the
component was highly correlated with each of these input beginning of the observed time period, i.e., around 9 years of
measures and accounted for 62% of the total variance in linguistic age. The signs and effect sizes of the linear and quadratic terms
input. Consequently, we focused on the principal component suggest that children with higher language input experienced
including word tokens and decontextualized utterances. We larger decreases in cortical thickness in the 9–16 age range,
replicated the analysis with models using a principal component compared to children with lower language input, who exhibited
that also included rare word types. These models revealed similar a more attenuated change. Although our sample size is modest,
results, though with a higher AIC, i.e., a worse fit. The results the direction of effects for parameters of interest is consistent
using the measure of parental input that also included rare words across the frequentist and Bayesian models (see Supplementary
are included in the Supplementary Table 4. Table 5). Further, the directions of effects for parameters for
age are also consistent with prior studies (Vijayakumar et al.,
2016, 2018). Importantly, the results remained unchanged when
analyses were repeated on the subsample of 17 children who
Linear Mixed Model Approach had at least two or more scans and we could directly assess
To find the best fitting model for cortical thickness, we first
change over time (see Supplementary Materials 5). Since SES
present an empirical plot of children’s cortical thickness between
and language input composite are both centered and scaled,
9 and 16 years. Figure 1A is a plot of the observed individual
it is possible to compare the effect of the two factors in the
trajectories of cortical thickness for each participant. Please
model. The estimates suggest that the effect size of language
note that language input was measured continuously for the
statistical analyses. For visualization purposes only, we divided
the observations into high/low language input groups separated
by the median language input PCA value. Superimposed on TABLE 3 | Results of a linear mixed model analysis for the relationship between
parental language input PCA (word tokens and decontextualized utterances) and
both of these plots is a solid line for each group representing
cortical thickness.
the Loess curves fit to the values. Children who participated
in only one MRI session (n = 6) are represented with a single Estimate Std. Error 95% L 95% U p-value
point in the figure. We see that children with higher language
Intercept 3.1692 0.1615 2.8527 3.4857 < 0.001*
input had higher values for cortical thickness than their lower
Age −0.0293 0.0188 −0.0662 0.0077 0.1208
language input peers, while also exhibiting steeper change within
Age2 0.0018 0.0024 −0.0029 0.0064 0.4593
the time period observed. Figure 1B represents the model fit
Mean occipital thickness 0.0872 0.008 0.0716 0.1029Demir-Lira et al. Input and Child Cortical Structure
input and age on cortical thickness is comparable to (slightly To the extent that previous studies explore the relations between
larger) than the effect size of SES on cortical thickness. Finally, parental language input and child brain structure, they focused
to examine the specificity of the relations of later input to later on concurrent relations between input and brain structure. In
child cortical thickness, we included children’s PPVT scores contrast, we examined predictive relations between early parental
as a covariate in our model; the results were unchanged (see language input and later child brain structure. The strength of our
Supplementary Table 6). approach is that we modeled change in later brain structure using
longitudinal data with multiple observations.
Region-Specific Relations We found unique relations between early parental input and
Given our modest sample size, we refrain from making strong change in later child cortical thickness, which were stronger than
conclusions about region-specific effects. For completeness, we relations between early parental input and the average level of
report exploratory analyses including intercept, linear, and later child cortical thickness. Finding stronger relations between
quadratic terms for each ROI as fixed factors. The values for non- parent input and change over time in child brain structure than
region relevant covariates, such as age, SES, and sex matched to values at a single time-point dovetails with previous work
the previous main models. Previous analyses did not reveal showing that the trajectory of cortical thickness, rather than
strong laterality differences and thus cortical thickness for the its value at a given time point, is a good index of individual
left and right were averaged per region. IFG pars opercularis variability in performance (Sowell et al., 2001). We found that
showed the strongest relation to language input and STG and STS the greater the early parental language input, the steeper the
revealed non-significant trending associations. No significant change in child cortical thickness years later. In other words,
relations were observed in other regions such as IFG pars change was slower for children at the lower end of the parent
triangularis or SMG. For these former three regions, as in the input continuum. Our findings are also consistent with studies
main model, language input was positively related to thickness showing extended growth trajectories in children from higher
at baseline, negative to slope and positive to quadratic term. SES families (Hanson et al., 2013), continued cortical thinning in
In other words, children with greater early input had a higher children from higher SES families throughout late adolescence,
intercept (indicating higher cortical thickness at the beginning of and early plateauing in children from lower SES families (e.g.,
the study), and a steeper change over the observed time period Piccolo et al., 2016), which is considered a sign of accelerated
than children with less early input. The tentative conclusion that development in children from lower SES families (LeWinn et al.,
language input might have a particular impact on IFG, STG, 2017). With respect to cortical thickness, children from higher
and STS is supported by previous evidence (e.g., Romeo et al., SES backgrounds show steady age-related decreases, particularly
2018a). See Supplementary Materials for region-specific linear in regions related to language processing (e.g., left STG); in
mixed-model analysis (Supplementary Table 7), region-specific contrast, children from lower SES backgrounds begin to plateau
cortical thickness change trajectories (Supplementary Figure 2), during late adolescence (Piccolo et al., 2016; McDermott et al.,
and region-specific Bayesian analysis (Supplementary Table 2). 2019). We extend previous work by identifying, for the first time,
a direct measure – early parental language input – that predicts
later change in child cortical thickness, over and above SES.
DISCUSSION Why might children who have been exposed to a higher
quantity and complexity of language input early in development
Our results reveal, for the first time, that early parental language exhibit continued change in cortical thickness, whereas low
input prior to school predicts changes in children’s language- input children plateau? Certain enriching experiences might keep
related cortical structures during the school years in mid- the window for structural brain development open, allowing
adolescence. Cortical thickness decreases during childhood, for additional cortical thinning. In contrast, developmental
particularly from mid-childhood to adolescence (Mills et al., thinning might be sped up for individuals who are not as
2014; Wierenga et al., 2014; Vijayakumar et al., 2016; Tamnes frequently exposed to enriching experiences, resulting in an
et al., 2017). Even though there is a general decline in thickness, earlier-closing window and less thinning overall. Literature on
the trajectory of change displays substantial individual variability, severe environmental adversity, such as traumatic childhood
and the trajectories vary by region. Vijayakumar et al. (2016) experiences, supports the notion that damaging early life
reported a negative quadratic pattern of cortical thickness change experiences can derail brain development, specifically leading
in temporal areas, which is similar to the pattern observed to accelerated maturation and narrower windows of plasticity
here. Individual variability is largest in temporal and frontal (Gur et al., 2019; Miskolczki et al., 2019). Here, we focused
regions across the lifespan (Frangou et al., 2020). These structural on only the role of enriching experiences and variability within
variations can be linked to a wide range of child internal the normative range. However, within the normative range, our
factors. For example, Asaridou et al. (2017) showed, in the results suggest a comparable profile of extended change for
sample studied here, that differences in children’s early language children exposed to richer experiences, and of restricted change
development predict differences in later brain structure. The for children with more impoverished input. Future work is
structural variations can also be linked to a wide range of needed to explore whether negative and positive experiences are
experiential factors. For example, SES and parental cognitive part of the same continuum with respect to brain development.
stimulation predict variability in child brain regions supporting Another possible explanation for the differences we find between
language processing (e.g., Luby et al., 2013; Merz et al., 2020). children coming from homes that provide high versus low
Frontiers in Human Neuroscience | www.frontiersin.org 8 August 2021 | Volume 15 | Article 650152Demir-Lira et al. Input and Child Cortical Structure levels of cognitive enrichment is that children exposed to more contribution of the child in eliciting parental input (Silvey et al., language input might have resources to spare, as evidenced by 2021), which we are currently applying to neuroimaging data. their overall greater cortical thickness early in development, Finally, whether it is early parental input that predicts later which might lead to continued thinning. In other words, more change in child brain structures (which would be consistent parental input might lead to thicker cortex to begin with, with sensitive period hypotheses, Newport et al., 2001), or which then supports more protracted thinning. Overall, the whether parents must continue to provide rich input to computational properties of a network might be better revealed their children to trigger later change needs to be examined by considering its developmental origins and change over time in future studies. together (Dündar-Coecke and Thomas, 2019). A number of limitations should be considered when Three developmental theories have been proposed to explain interpreting our results. First, our findings are correlational. apparent cortical thinning in the age range examined: pruning, Although we accounted for important covariates, such as parental myelination and cortical morphology, but not to neuron education and IQ, we cannot make claims about causation. generation or loss (Vandekar et al., 2015; Vijayakumar et al., Second, we have a modest sample size, which limits our ability 2016). Synapse elimination, pruning and myelination continues to derive strong conclusions. We also observed multicollinearity well into adulthood (Huttenlocher, 2009). Important underlying between some covariates. For example, children with greater cellular changes include changes in the number of neurons in language input were more likely to be male and from higher a cortical column, the amount of glial and capillary support, SES homes, giving us few observations with which to isolate and dendritic branching (Rakic, 1988, 2009). More recent either of these covariates. Despite the uncertainty in our evidence supports the hypothesis that the cortical thinning models (frequentist and Bayesian), the parameter fits from during childhood is primarily due to increased myelination. the observed data largely match the background literature and The observed thinning is considered to be due to increased support our hypotheses. Further, we focused on a single factor, myelination altering the contrast between gray and white parental language input, following previous work emphasizing matter in MRI images, which in turn affects the apparent the role of early parental input in predicting later child cortical boundary (Natu et al., 2019). Experiential factors behavioral outcomes, and also its role in predicting structural have been shown to predict myelination (e.g., Hensch, 2004; differences in brain areas subserving language processing at Knudsen, 2004). Myelination is also important for concluding the same age. One could argue that language input might be of periods of plasticity (Hensch, 2004; Hensch and Bilimoria, correlated with other factors that predict brain structure – 2012). Taken together, reduced environmental stimulation might some of these include general cognitive stimulation, toxins, be associated with early narrowing of plasticity associated sleep differences, and even stress and glucocorticoids during with overall lower myelination which might then result in pregnancy (Kaufman and Charney, 2001; Davis et al., 2013). We smaller subsequent changes in cortical thickness, whereas attempted to account for other general differences in children’s higher input might keep windows of plasticity longer and environments by controlling for overall parental SES, as well thus might be associated with larger subsequent changes as parental IQ. However, we cannot rule out the possibility (Tooley et al., 2021). that there were unique but related factors that contributed The behavioral mechanisms by which early parental input to differences in later child brain structure. Future work is relates to later child brain development remains an open needed to compare and contrast the role of other experiential question. One possibility is that simply being exposed to rich factors on later changes in child cortical structure. Finally, language input influences efficiency of language processing (e.g., although our study might be underpowered and recent reports Fernald et al., 2013), which, in turn, is associated with changes suggest that replicable brain-behavior correlations with fMRI at the neural level. Another possibility is that, when parents may require larger sample sizes (Yarkoni and Braver, 2010; produce rich language, children engage in rich conversations Marek et al., 2020) than the one used here, our results and it is children producing language that is associated with are valuable in that they generate hypotheses to be tested differences in brain structure (Romeo et al., 2018a). The two with larger samples. possibilities are not mutually exclusive, and it is also possible In sum, our study leverages a unique longitudinal dataset that the relation between early parental input and later child combining naturalistic observations of parent–child interactions behavioral and neurological development varies depending on and structural neuroimaging measures during a period spanning the specific brain region considered. We did not have early 15 years. For the first time, we show that early parental language measures of children’s general cognitive development, such input prior to school predicts changes in child cortical structure as their memory or attention. Measures of general cognitive in mid-adolescence, over and above the contributions of SES development would be needed to establish the specificity of or parental IQ. Our results are consistent with previous work the relation between early parental language input and later examining SES-related differences in brain structure, and move child neurological development, and to explore whether parental the literature forward by contributing to our understanding input might relate to later child outcomes via broader aspects of the mechanisms underlying individual differences in brain of cognitive development. Although we emphasize the role of development. Pinpointing specific experiential factors that parental input, children are active participants in this interaction predict brain structure has the potential to inform prevention and might drive the input in different ways. Our recent and intervention strategies designed to draw upon and integrate work presents novel statistical models that account for the early home support. Frontiers in Human Neuroscience | www.frontiersin.org 9 August 2021 | Volume 15 | Article 650152
Demir-Lira et al.                                                                                                                                Input and Child Cortical Structure

DATA AVAILABILITY STATEMENT                                                                   Health and Human Development (NICHD) under Grant P01
                                                                                              HD040605 (SG-M and SS are PIs) and the National Institute of
The raw data supporting the conclusions of this article will be                               Deafness and other Communication Disorders (NIDCD) under
made available by the authors, without undue reservation.                                     Grant R01 DC003378.

ETHICS STATEMENT
                                                                                              ACKNOWLEDGMENTS
The studies involving human participants were reviewed and
approved by the University of Chicago BSD/UCMC Institutional                                  The support of the funder is gratefully acknowledged. We also
Review Boards and the Office of Research at the University of                                 wish to thank Kristi Schonwald for her coordination of the
California, Irvine. Written informed consent to participate in this                           entire project, Jodi Khan and Jason Voigt for administrative and
study was provided by the participants’ legal guardian/next of kin.                           technical assistance, Christine Bascetta, Karyn Brasky, Megan
                                                                                              Broughan, Laura Chang, Elaine Croft, Kristin Duboc, Sam Engel,
                                                                                              Jennifer Griffin, Sarah Gripshover, Kelsey Harden, Lauren King,
AUTHOR CONTRIBUTIONS                                                                          Max Masich, Carrie Meanwell, Erica Mellum, Molly Nikolas,
                                                                                              Jana Oberholtzer, Lilia Rissman, Becky Seibel, Meredith Simone,
SS and SG-M conceived the longitudinal project. ÖD-L and SA                                   Calla Trofatter, Kevin Uttich, Julie Wallman, Kristin Walters, and
were involved in the neuroimaging data collection and analysis.                               Virginia Li for help in collecting and transcribing the data. We
ÖD-L was involved in parental language input coding and                                       gratefully acknowledge efforts of the children and families who
drafted the manuscript. ÖD-L and CN analyzed the data for the                                 participated and who sacrificed their personal time to help us
current manuscript in consultation with SA, SS, and SG-M. All                                 learn about the neurobiology of language development.
authors critically edited, extensively contributed to the project,
and approved the final submitted version of the manuscript.
                                                                                              SUPPLEMENTARY MATERIAL
FUNDING
                                                                                              The Supplementary Material for this article can be found
This research was supported by two institutes of the National                                 online at: https://www.frontiersin.org/articles/10.3389/fnhum.
Institutes of Health (NIH) – the National Institute of Child                                  2021.650152/full#supplementary-material

REFERENCES                                                                                    Casey, B. J., Cannonier, T., Conley, M. I., Cohen, A. O., Barch, D. M., Heitzeg,
                                                                                                 M. M., et al. (2018). The adolescent brain cognitive development (ABCD) study:
Anderson, B. J., Li, X., Alcantara, A. A., Isaacs, K. R., Black, J. E., and Greenough,           imaging acquisition across 21 sites. Dev. Cogn. Neurosci. 32, 43–54.
   W. T. (1994). Glial hypertrophy is associated with synaptogenesis following                Chall, J. S., and Dale, E. (1995). Readability Revisited: The New Dale-Chall
   motor-skill learning, but not with angiogenesis following exercise. Glia 11,                  Readability Formula. Cambridge: Brookline Books.
   73–80. doi: 10.1002/glia.440110110                                                         Dale, A. M., Fischl, B., and Sereno, M. I. (1999). Cortical surface-based analysis I.
Asaridou, S. S., Demir-Lira, Ö. E., Goldin-Meadow, S., and Small, S. L. (2017). The              Segmentation and surface reconstruction. Neuroimage 9, 179–194.
   pace of vocabulary growth during preschool predicts cortical structure at school           Dale, E., and Chall, J. S. (1948). A formula for predicting readability: instructions.
   age. Neuropsychologia 98, 13–23. doi: 10.1016/j.neuropsychologia.2016.05.018                  Educ. Res. Bull. 27, 37–54.
Avants, B. B., Hackman, D. A., Betancourt, L. M., Lawson, G. M., Hurt, H.,                    Davis, E. P., Sandman, C. A., Buss, C., Wing, D. A., and Head, K. (2013). Fetal
   and Farah, M. J. (2015). Relation of childhood home environment to cortical                   glucocorticoid exposure is associated with preadolescent brain development.
   thickness in late adolescence: specificity of experience and timing. PLoS One                 Biol. Psychiatry 74, 647–655. doi: 10.1016/j.biopsych.2013.03.009
   10:e0138217. doi: 10.1371/journal.pone.0138217                                             Davis, M. H., and Gaskell, M. G. (2009). A complementary systems account of word
Badcock, N. A., Bishop, D. V., Hardiman, M. J., Barry, J. G., and Watkins, K. E.                 learning: neural and behavioural evidence. Philos. Trans. R. Soc. B Biol. Sci. 364,
   (2012). Co-localisation of abnormal brain structure and function in specific                  3773–3800. doi: 10.1098/rstb.2009.0111
   language impairment. Brain Lang. 120, 310–320. doi: 10.1016/j.bandl.2011.10.               Demir, Ö. E., Rowe, M. L., Heller, G., Goldin-Meadow, S., and Levine, S. C. (2015).
   006                                                                                           Vocabulary, syntax, and narrative development in typically developing children
Barnes, J. (2011). The influence of child-directed speech in early trilingualism. Int.           and children with early unilateral brain injury: early parental talk about the
   J. Multiling. 8, 42–62. doi: 10.1080/14790711003671861                                        “there-and-then” matters. Dev. Psychol. 51, 161–175. doi: 10.1037/a0038476
Beals, D., and Tabors, P. (1995). Arboretum, bureaucratic and carbohydrates:                  Demir-Lira, Ö. E., Applebaum, L. R., Goldin-Meadow, S., and Levine, S. C. (2019).
   preschoolers’ exposure to rare vocabulary at home. First Lang. 15, 57–76.                     Parents’ early book reading to children: relation to children’s later language
Black, J. E., Isaacs, K. R., Anderson, B. J., Alcantara, A. A., and Greenough,                   and literacy outcomes controlling for other parent language input. Dev. Sci.
   W. T. (1990). Learning causes synaptogenesis, whereas motor activity causes                   22:e12764.
   angiogenesis, in cerebellar cortex of adult rats. Proc. Natl. Acad. Sci. U.S.A. 87,        Destrieux, C., Fischl, B., Dale, A., and Halgren, E. (2010). Automatic parcellation
   5568–5572. doi: 10.1073/pnas.87.14.5568                                                       of human cortical gyri and sulci using standard anatomical nomenclature.
Bleses, D., Makransky, G., Dale, P. S., Højen, A., and Ari, B. A. (2016). Early                  Neuroimage 53, 1–15. doi: 10.1016/j.neuroimage.2010.06.010
   productive vocabulary predicts academic achievement 10 years later. Appl.                  Diamond, M. C., Krech, D., and Rosenzweig, M. R. (1964). The effects of an
   Psycholinguist. 37, 1461–1476. doi: 10.1017/s0142716416000060                                 enriched environment on the histology of the rat cerebral cortex. J. Comp.
Cartmill, E. A., Armstrong, B. F., Gleitman, L. R., Goldin-Meadow, S., Medina,                   Neurol. 123, 111–119. doi: 10.1002/cne.901230110
   T. N., and Trueswell, J. C. (2013). Quality of early parent input predicts child           Duncan, G. J., Dowsett, C. J., Claessens, A., Magnuson, K., Huston, A. C., Klebanov,
   vocabulary 3 years later. Proc. Natl. Acad. Sci. U.S.A. 110, 11278–11283. doi:                P., et al. (2007). School readiness and later achievement. Dev. Psychol. 43,
   10.1073/pnas.1309518110                                                                       1428–1446.

Frontiers in Human Neuroscience | www.frontiersin.org                                    10                                             August 2021 | Volume 15 | Article 650152
You can also read