Overview of the Olifants Catchment - (2014) 53 AWARD
←
→
Page content transcription
If your browser does not render page correctly, please read the page content below
AWARD
53     Tech Report
       Series

Overview of the
Olifants Catchment
(2014)

Sharon Pollard & Ariane Laporte
March 2014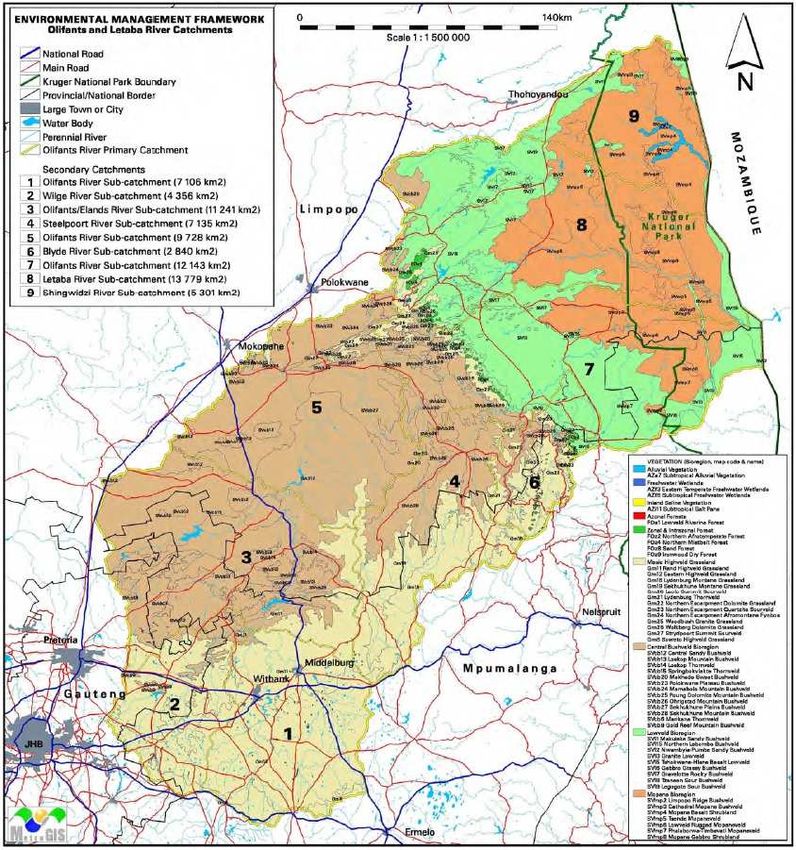
Acknowledgements
The USAID: RESILIM-O project is funded by the U.S. Agency for International Development under
USAID/Southern Africa RESILIENCE IN THE LIMPOPO BASIN PROGRAM (RESILIM). The RESILIM-O
project is implemented by the Association for Water and Rural Development (AWARD), in
collaboration with partners. Cooperative Agreement nr AID-674-A-13-00008.

© Association for Water and Rural Development (AWARD)

Authors
Sharon Pollard & Ariane Laporte

March 2014

Association for Water and Rural Development (AWARD)
P O Box 1919
Hoedspruit 1380
Limpopo, South Africa
T 015-793 0503
W award.org.za

Company Reg. No. 98/03011/08

                                  Overview of the Olifants Catchment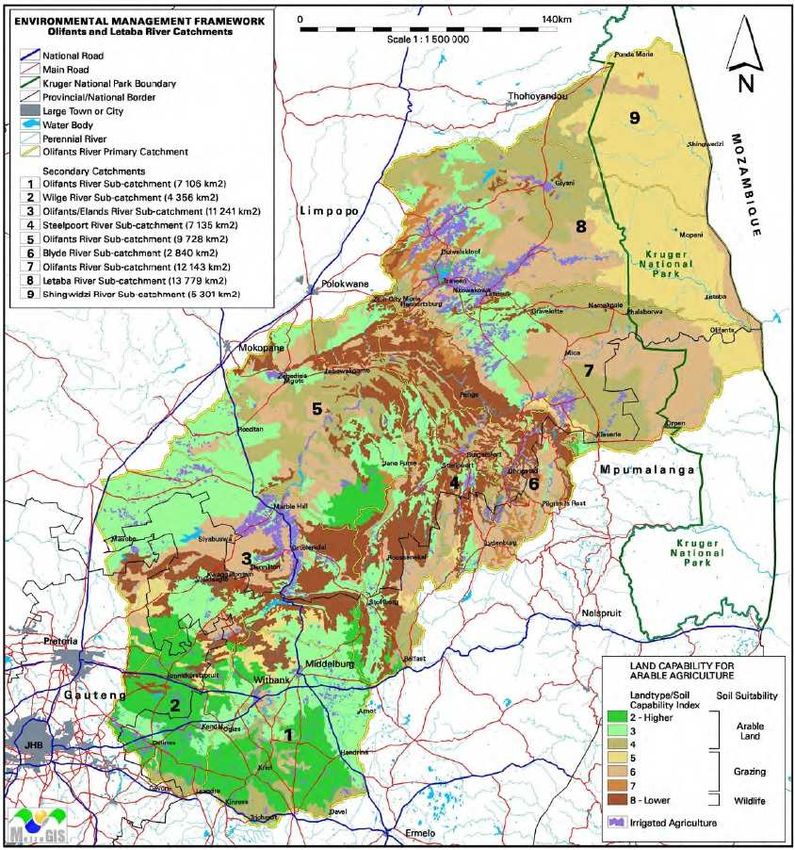
Table of Contents
List of Figures ......................................................................................................... 3
List of Tables .......................................................................................................... 4

1      Biophysical overview ......................................................................................... 5
    1.1 Bio-physical general overview of the Olifants catchment in South Africa ......................... 5
    1.2 The Physical Environment in Olifants catchment in South Africa ................................... 5
             1.2.1 Geology............................................................................................ 5
             1.2.2 Topography ....................................................................................... 7
             1.2.3 Soils and soil suitability for agriculture ..................................................... 9
    1.3 The Biological Environment in the Olifants Catchment in South Africa ........................... 13
             1.3.1 Biomes ............................................................................................ 13
             1.3.2 Vegetation types ............................................................................... 14
             1.3.3 Centres of endemism .......................................................................... 17
             1.3.4 Threatened ecosystems ....................................................................... 19
    1.4 Summarized overviews of secondary catchments in the Olifants Catchment in South Africa 20

             1.4.1 Upper Olifants River sub-catchment ........................................................ 20
             1.4.2 Wilge River sub-catchment ................................................................... 20
             1.4.3 Upper Olifants/Elands River sub-catchment............................................... 21
             1.4.4 Steelpoort River sub-catchment ............................................................. 21
             1.4.5 Middle Olifants River sub-catchment ....................................................... 22
             1.4.6 Blyde River sub-catchment ................................................................... 22
             1.4.7 Lower Olifants River sub-catchment ........................................................ 23
2      Water resources ............................................................................................. 24
    2.1 Water resources overview of the Olifants catchment in South Africa ............................ 24

             2.1.1 Surface Water: quality and quantity ........................................................ 24
             2.1.2 River characteristics ........................................................................... 28
             2.1.3 Wetlands ......................................................................................... 33
             2.1.4 Groundwater .................................................................................... 34
    2.2 Water resources overview of the Olifants catchment in Mozambique ............................ 36

             2.2.1 River characteristics: water quality and quantity ........................................ 36

Overview of the Olifants Catchment                                                                                      |1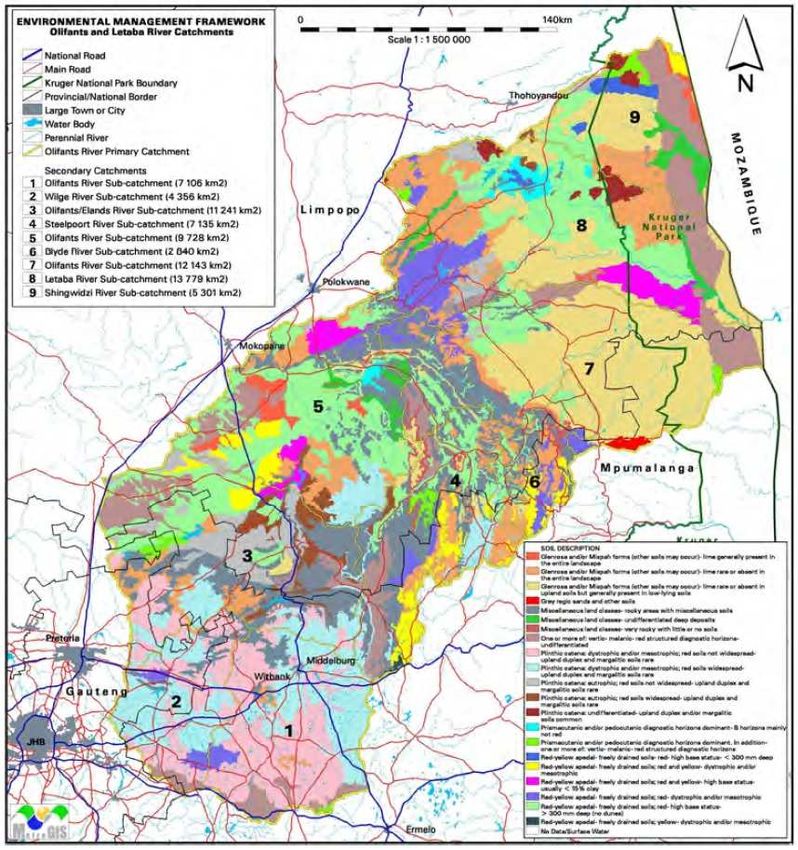
3      Demographic & social overview ........................................................................... 39
    3.1 Demographic & social overview of the Olifants Catchment in South Africa ..................... 39
             3.1.1 Demographic information: population distribution and density ....................... 39
             3.1.2 Education ........................................................................................ 41
             3.1.3 Health ............................................................................................ 42
             3.1.4 Household profile: household size, gender & age of head of household ................. 42
    3.2 Demographic and social overview of the Olifants Catchment in Mozambique ................... 46

             3.2.1 Demographic information: population distribution and density ....................... 46
             3.2.2 Education ........................................................................................ 47
             3.2.3 Health ............................................................................................ 48
4      Socio-economic overview .................................................................................. 49

    4.1 Socio-economic overview of the Olifants Catchment in South Africa ........................... 49
             4.1.1 Employment Status............................................................................. 49
             4.1.2 Employment per sector........................................................................ 50
             4.1.3 Household Income .............................................................................. 52
             4.1.4 Grants ............................................................................................ 54
5      Economic overview .......................................................................................... 57

    5.1 Economic overview of the Olifants Catchment in South Africa..................................... 57
             5.1.1 Background ...................................................................................... 57
             5.1.2 Economic Scenario by Secondary Catchment.............................................. 59
    5.2 Economic overview of the Olifants Catchment in Mozambique .................................... 61

             5.2.1 Background ...................................................................................... 61
             5.2.2 Economic Scenario by District................................................................ 62
             5.2.3 Conclusion ....................................................................................... 65
6      Reference list ................................................................................................ 66

Appendices ........................................................................................................... 71
    Appendix 1: Geological terms ................................................................................. 71
    Appendix 2: Description of geological rocks ................................................................ 72

Overview of the Olifants Catchment                                                                                    |2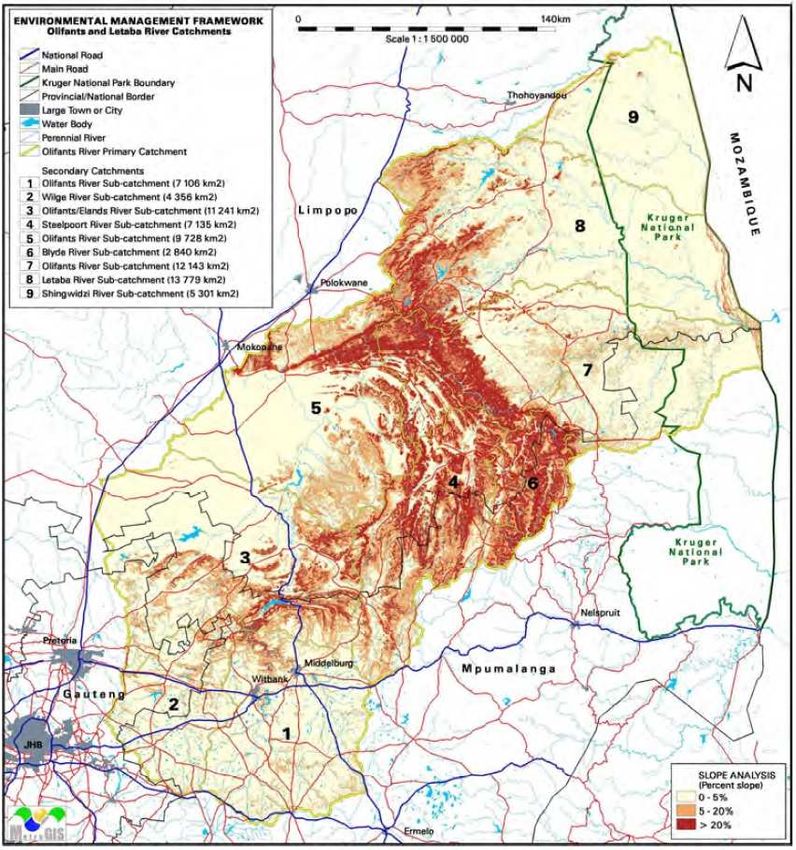
List of Figures
Figure 1: Map of the major geological systems of the Olifants catchment ............................... 6
Figure 2: Map of slopes within the Olifants catchment........................................................ 8
Figure 3: Map of the physical geography of the Olifants catchment ........................................ 9
Figure 4: Map of the soils within the Olifants catchment. ................................................... 11
Figure 5: Map indicating land capability for arable agriculture within the Olifants catchment ...... 12
Figure 6: Map of the vegetation bioregions within the Olifants catchment .............................. 14
Figure 7: Map of the threatened ecosystems within the Olifants catchment ............................ 19
Figure 8: Olifants Catchment: Mean Annual Runoff per sub-quaternary catchment. .................. 26
Figure 9: Location of EWR sites in the Olifants catchment in South Africa ............................... 27
Figure 10: River Ecoregional classification in the Olifants catchment in South Africa. ................ 28
Figure 11: Present Ecological State of the rives in the Olifants catchment in South Africa. .......... 31
Figure 12: Present Ecological State and Freshwater Ecosystem Priority Areas of the rivers in the
   Olifants catchment in South Africa ........................................................................... 32
Figure 13: Wetlands in the Olifants catchment in both South Africa and Mozambique ................. 33
Figure 14: Average borehole yield (l/sec) in the Olifants catchment in South Africa. ................. 35
Figure 15: Distribution of average monthly river flows in the Limpopo River within the Chokwe area ... 37
Figure 16: Predominant zones considered for characterizing the groundwater potential in the
   Olifants Catchment in Mozambique .......................................................................... 38
Figure 17: Urban and rural population in each secondary catchment in the Olifants catchment in
   South Africa. ..................................................................................................... 39
Figure 18: Population density in the Olifants catchment in South Africa ................................ 40
Figure 19: Population pyramid of the Olifants catchment in South Africa ................................ 41
Figure 20: Household size (1 to 10 and more people) in each secondary catchment in the Olifants
   catchment in South Africa. .................................................................................... 43
Figure 21: Gender of head of household in each secondary catchment in the Olifants catchment in
   South Africa ...................................................................................................... 44
Figure 22: Percentage of head of households aged between 10-19 and 70 or more in each secondary
   catchment in the Olifants catchment in South Afrcia .................................................... 45
Figure 23: Population density in the Olifants catchment in Mozambique ................................. 46
Figure 24: Population pyramid of the Limpopo Basin in Mozambique based on Census data 1997 .. 47
Figure 25: Employment Status within the ORC ................................................................. 49
Figure 26: Employment Status per Secondary Catchment. ................................................. 50
Figure 27: Employment per Sector for entire Catchment. .................................................. 51
Figure 28: Employment by Sector for MPL and Lim for 2012 ............................................... 51
Figure 29: Comparison of income spread per household p.a. .............................................. 53
Figure 30: Income differences between Upper- & Middle- Olifants sub catchments .................... 54
Figure 31: Olifants Catchment: Amount of population receiving grants vs not receiving grants ..... 54
Figure 32: Olifants Catchment: Different Social Grants weighted according to make-up of total
   amount of grants handed out ................................................................................. 55
Figure 33: Percentage of grants handed out per province, tracking the changes from 2005-2013 .. 56
Figure 34: GDP contribution per sector in the ORC (%) ....................................................... 58
Figure 35: Imports/Exports for Limpopo Province for 2007-2011 ........................................... 58

Overview of the Olifants Catchment                                                                                    |3
List of Tables
Table 1: Soils that occur in the Olifants EMF area ............................................................ 10
Table 2: Land capability of arable agriculture ................................................................. 12
Table 3: Conservation status and coverage of vegetation in the Olifants catchment in South Africa .... 15
Table 4: Natural Mean Annual Runoff and Ecological Reserve requirements in the Olifants WMA... 25
Table 5: Environmental Water Requirements (EWR) information based on previous Reserve studies in
   the Olifants catchment in South Africa ...................................................................... 27
Table 6: Characteristics of the river ecoregions within the Olifants catchment in South Africa ..... 29
Table 7: The number, distribution and area of the different wetlands types present in the Upper
   Olifants secondary catchment in South Africa ............................................................. 34
Table 8: Population in the Olifants catchment with no schooling, having achieved Grade 12 and
   tertiary education ............................................................................................... 41
Table 9: Average household size for each secondary catchment in the Olifants catchment in South
   Africa and for the Limpopo and Mpumalanga provinces .................................................. 42
Table 10: Age of head of households in each secondary catchment in the Olifants catchment ........... 45
Table 11: Illiteracy rate amongst adults in Gaza province in 1997 and 2007 ............................. 47
Table 12: Employment by Sector for ORC in 200, combined with the growth of Mpumalanga’s
   employment by sector from 2001-2012...................................................................... 52
Table 13: Comparison of SA GDP per sector to ORC .......................................................... 57

Overview of the Olifants Catchment                                                                                   |4
1 Biophysical overview
1.1 Bio-physical general overview of the Olifants catchment
in South Africa
The upper part of the Olifants River catchment forms part of the Highveld and is composed of
undulating plains and pans, and a large open flat area, referred to as the Springbok Flats. These
areas are divided from the Lowveld by the escarpment, which consists of various hills and
mountainous terrain. The Lowveld consists mainly of plains and undulating plains. The catchment
contains all three basic rock types which are sedimentary, igneous and metamorphic. There is also
a wide variety of soil types distributed throughout the catchment. Within the South African part of
the catchment three terrestrial biomes occur, namely savanna, forest and grassland, while
Mozambique contains savannah, forest and Indian Ocean Coastal belt biomes. The three biomes
within South Africa contain 52 vegetation types. The grassland mainly comprises the Highveld as
well as the southern and western part of the escarpment, the savanna biome comprises the greater
part of the Springbok Flats and the Lowveld, as well as the north-eastern parts of the escarpment,
and the forest biome covers a small portion of the catchment and is more or less centred on the
escarpment. There are two centres of endemism within the Olifants catchment, namely the
Sekhukhuneland and Wolkberg Centres of Endemism in South Africa. Each centre has unique
characteristics and vegetation composition found nowhere else.
1.2 The Physical Environment in Olifants catchment in
South Africa
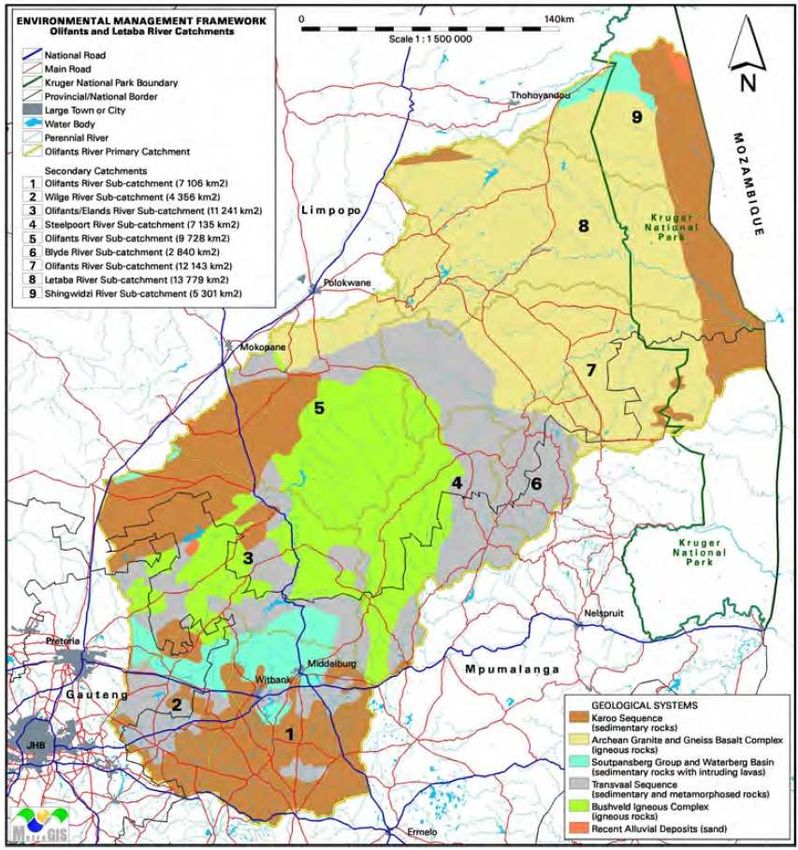
1.2.1 Geology
The geology of the study area is widely varied. The area contains exposed rocks from the early
Precambrian Era 4600 million years ago (MY) all the way through to the Cenozoic Era 1.65 MY.
Archaean Granite and Gneiss Basal Complex is the oldest exposed rock formations in the area. This
igneous rock was formed around 4600 MY to 2500 MY (see Fig. 1). It forms the basement rock
complex for other rock systems. It occurs in the eastern Lowveld part of the study area and consist
mainly of old Granite and Gneis formations and primitive groups of schistose rocks including
metamorphosed sediments such as phyllites, banded ironstone, quartzite, conglomerate and
limestone, together with rocks of igneous origin such as amphibolites, greenstone lavas, and
chlorite-schists. The most important economic potential lies in the mining of granite and gneiss for
use as polished stone and the occurrence of gold and other minerals in the greenstone lavas.
Overview of the Olifants Catchment |5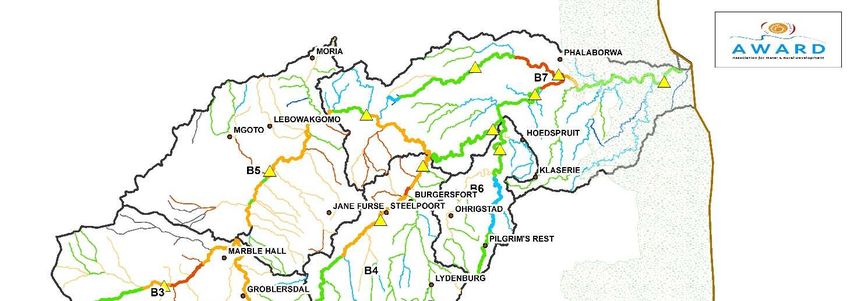
Figure 1: Map of the major geological systems of the Olifants catchment (including Shingwedzi and
                          Letaba catchments) in South Africa (source: EMF, 2009).

The Transvaal Sequence was formed around 2400 MY to 1800 MY. It consists of sedimentary rock
laid down in a basin. There are igneous intrusions in places as well as fault lines, which caused the
formation of metamorphic rock. In the study area it consists of the so-called Pretoria Series (after
its typical form in the Pretoria area) composed of three quartzite layers (Timeball Hill, Daspoort
and Magalies) with intervening shales and lavas. It forms the mountains of Sekhukhuneland (eastern
Bankenveld) at the edge of the Bushveld Basin as well as the bold escarpment of the Transvaal
Drakensberg consisting of Black Reef Quartzite where the dramatic change in topography gives rise
to dramatic scenic views and vistas.

Overview of the Olifants Catchment                                                                       |6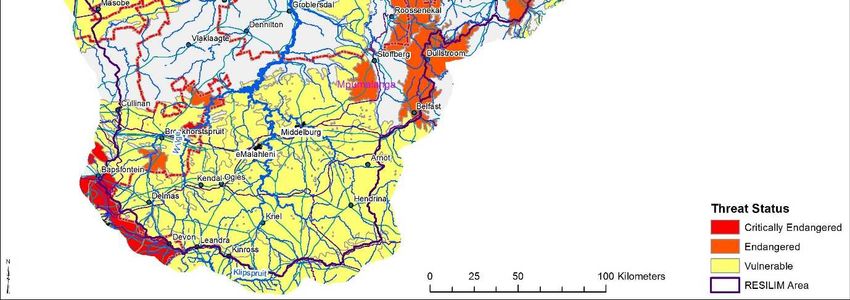
The Bushveld Igneous Complex was formed in a series of magma surges around 2100 MY to 1800 MY.
It is spread over the central part of the Transvaal basin. The area contains Red Granites and the
Rooiberg Series in the central parts, as well as Norite in the east. The Bushveld Igneous Complex
contains important minerals such as large quantities of platinum, small quantities of gold and silver
and a variety of base metals.
The rocks of the Soutpansberg Group and Waterberg Basin were formed around 1800 MY. The rocks
of the Soutpansberg Group are mostly sedimentary, but may have intrusive volcanic rocks in places.
The Waterberg Basin is also composed mostly of sedimentary rocks and is covered in several localities by
outliers of Karoo rocks. Intrusive volcanic rocks may also be present in the Waterberg Basin.
The Karoo Sequence was formed around 400 MY to 120 MY. It consists mainly of sedimentary rocks
deposited horizontally in a vast basin, with a few satellite basins to the north. It is a relatively
young plateau system that is in the slow process of being removed by erosion from the sub-Karoo
surface. The Karoo Sequence contains bands of coal within the central sedimentary layers.
Karoo-related volcanic and intrusive rocks are found in the Mozambique part of the Olifants. They
consist mafic and felsic extrusive rocks which are associated with and represent the capping
stratigraphic units of the seaward-dipping volcanic succession of the Lebombo Monocline. The
Lebombo mountain range along the border of Mozambique and South Africa is mostly composed of a
bimodal association of rhyolitic ash-flow tuffs and ignimbrites and basaltic to andesitic lava flows.
Alluvial Deposits in the area have been formed as recently as 65 MY. They consist of sand created
by the weathering of older rocks. The composition of these small loose grains varies depending on
the source of rock (DEA, 2009).
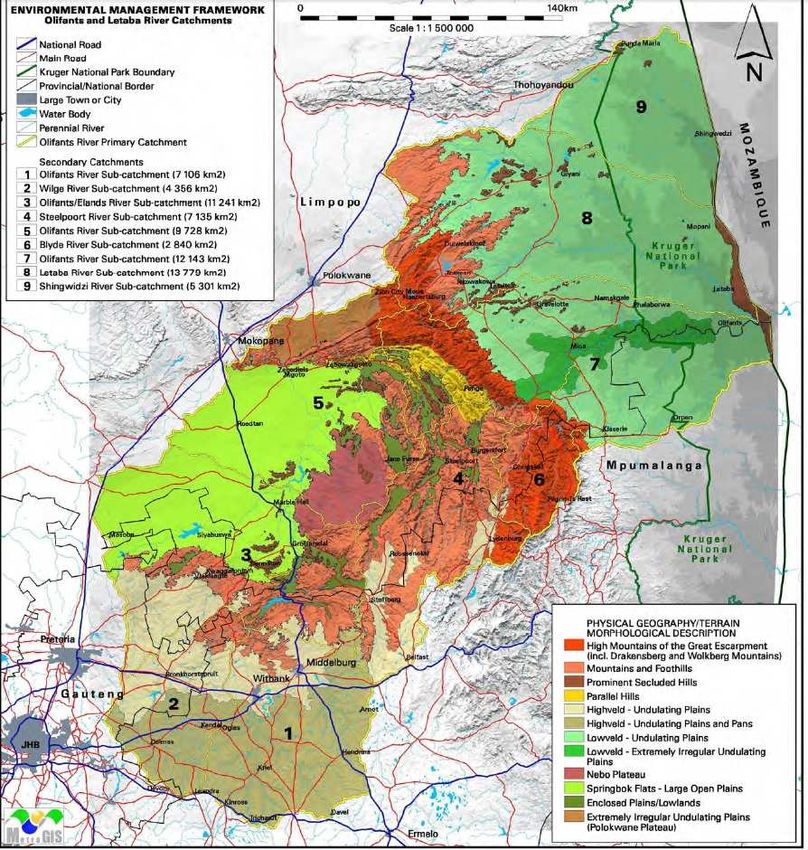
1.2.2 Topography
Topographically, on the basis mainly of altitude and relief, the catchment can be divided into four
zones within South Africa, and two zones within Mozambique namely:
- The Highveld in the south at 1200 – 1800 m above sea level (South Africa)
- The Springbok Flats in the west at 900 – 1 200 m above sea level (South Africa)
- The escarpment zone in the centre of the basin at 1 500 – 2 400 m above sea level
(South Africa)
- The Lowveld in the east at 150– 900 m above sea level (South Africa and Mozambique)
- The Mozambican coastal plain adjoining the Indian Ocean in the east, at 0 – 150 m above
sea level (Mozambique)
The Highveld is composed of undulating plains and pans, and the Springbok Flats is a large, open
and flat area. These areas are divided from the Lowveld by the escarpment, which consists of
various hills and mountain terrain (Fig. 2). The Lowveld consists mainly of plains with undulating
plains found along the Olifants river course. The higher western parts (600 – 900 m) of these plains
form the piedmont zone adjoining the escarpment, and consist of eroded foot slopes. Prominent
secluded hills are also found in the north-western part of the Lowveld section of the catchment
(Fig. 3) (DEA, 2009).
Overview of the Olifants Catchment |7
The general decrease in altitude towards the east continues across the Lowveld plains up to the
Lebombo Mountains/Hills. This range of mountains separates the South African and Mozambican
Lowveld plains, and is formed by a cuesta, or a tilted plateau with a steep escarpment in the west
and a gradual dipslope of about 5 percent descending east into the coastal plains of Mozambique.
The Mozambican Coastal plain is composed of beach ridge dunes and sandy plains with swampy
swales, or sandy depressions adjacent to the coast. This area also contains the extensive Limpopo
river coastal floodplain.

     Figure 2: Map of slopes within the Olifants catchment (including Shingwedzi and Letaba catchments)
                                     in South Africa (source: EMF, 2009).

Overview of the Olifants Catchment                                                                        |8
Figure 3: Map of the physical geography of the Olifants catchment (including Shingwedzi and
Letaba catchments) in South Africa (source: EMF, 2009).
1.2.3 Soils and soil suitability for agriculture
The soils that occur in the catchment are closely related to the geology and landforms of the area,
except for the Mozambican coastal plain. Within the South African side of the catchment there is a
wide variety of soil types distributed throughout (Fig. 4). Soils common in the Mozambican coastal
plain are hydromorphic soils, which are poorly drained and swampy soils characterised by sandy
texture and wetness, and organic peat soils, which are very young soils characterised by little or no
soil formation. The land use for various activities is dependent on the soil type. The soils are listed
in the table below (DEA, 2009).
Overview of the Olifants Catchment |9TABLE 1: SOILS THAT OCCUR IN THE OLIFANTS EMF AREA (INCLUDING SHINGWEDZI AND
LETABA CATCHMENTS) (DEA, 2009).
SOIL DESCRIPTION AREA (km2) PERCENTAGE(% )
Glenrosa and/or Mispah forms (other soils may occur)- lime generally 697.01 0.95%
present in the entire landscape
Glenrosa and/or mispah forms (other soils may occur)- lime rare or absent 7 601.97 10.33%
in the entire landscape
Glenrosa and/or Mispah forms (other soils may occur)- lime rare or absent 11 831.19 16.07%
in upland soils but generally present in low-lying soils
Grey regic sands and other soils 126.36 0.17%
Miscellaneous land classes- rocky areas with miscellaneous soils 8 766.57 11.91%
Miscellaneous land classes- undifferentiated deep deposits 1 158.20 1.57%
Miscellaneous land classes- very rocky with little or no soils 498.33 0.68%
One or more of: vertic- melanic- red structured diagnostic horizons- 6 768.32 9.19%
undifferentiated
Plinthic catena: dystrophic and/or mesotrophic; red soils not widespread- 6 160.34 8.37%
upland duplex and margalitic soils rare
Plinthic catena: dystrophic and/or mesotrophic; red soils widespread- 6 974.62 9.47%
upland duplex and margalitic soils rare
Plinthic catena: eutrophic; red soils not widespread- upland duplex and 2 484.12 3.37%
margalitic soils rare
Plinthic catena: eutrophic; red soils widespread- upland duplex and 1 159.25 1.57%
margalitic soils rare
Plinthic catena: undifferentiated- upland duplex and/or margalitic soils 541.70 0.74%
common
Prismacutanic and/or pedocutanic diagnostic horizons dominant- b horizons 514.00 0.70%
mainly not red
Prismacutanic and/or pedocutanic diagnostic horizons dominant. In 608.33 0.83%
addition- one or more of: vertic- melanic- red structured diagnostic
horizons
Red-yellow apedal- freely drained soils- red- high base status- < 300 mm 335.64 0.46%
deep
Red-yellow apedal- freely drained soils; red and yellow- dystrophic and/or 1 846.66 2.51%
mesotrophic
Red-yellow apedal- freely drained soils; red and yellow- high base status- 1 378.58 1.87%
usually < 15% clay
Red-yellow apedal- freely drained soils; red- dystrophic and/or mesotrophic 2 621.67 3.56%
Red-yellow apedal- freely drained soils; red- high base status- > 300 mm 11 479.37 15.59%
deep (no dunes)
Red-yellow apedal- freely drained soils; yellow- dystrophic and/or 37.37 0.05%
mesotrophic
No data/surface waterlime generally present in the entire landscape 33.39 0.05%
Total 73 622.98 100.00%
Overview of the Olifants Catchment |10Figure 4: Map of the soils within the Olifants catchment (including Shingwedzi and Letaba catchments)
in South Africa (source: EMF, 2009).
The soil type of a specific area has a large influence on the potential of agricultural- and other land
tenure activities (Fig. 5). The following table specifically summarises the land capability for arable
agriculture in the Olifants in South Africa. It is important to note that land capability is of course a
composite of various factors which may influence this, including amongst other soil, slope/
topography, and climate. In Mozambique the Limpopo river floodplain is very important for
agriculture.
Overview of the Olifants Catchment |11Figure 5. Map indicating land capability for arable agriculture within the Olifants catchment (including
Shingwedzi and Letaba catchments) in South Africa (source: EMF, 2009)
Overview of the Olifants Catchment |12TABLE 2: LAND CAPABILITY OF ARABLE AGRICULTURE (DEA, 2009)
LAND TYPE/SOIL CAPABILITY INDEX SURFACE AREA IN (km2) PERCENTAGE %
ARABLE LAND (CLASSES BELOW)
Higher capability for arable agriculture 7255.460 9.85%
Medium capability for arable agriculture 17760.296 24.12%
Lower capability for arable agriculture 13380.454 18.17%
Higher capability for grazing 10122.695 13.75%
Medium capability for grazing 14727.933 20.00%
Lower capability for grazing 1081.910 1.47%
Wildlife 9263.952 12.58%
Water (included in dataset) 35.850 0.05%
Total area 73628.550 100.00
Irrigated agriculture (agriculture field 1571.934
boundaries)
1.3 The Biological Environment in the Olifants Catchment in
South Africa
1.3.1 Biomes
Three of the major nine terrestrial biomes in South Africa occur in the Olifants river catchment
area, namely grassland, savanna and forest. The Mozambican part of the catchment is also
composed of three major biomes namely savannah, forest and Indian Ocean Coastal belt. The
grassland mainly comprises the Highveld as well as the southern and western part of the
escarpment. The mesic Highveld grassland covers much of the Mpumalanga section of the
catchment (SANBI, 2013). The grass canopy cover decreases with lower rainfall.
Sweet grass occurs in drier regions, while the wetter areas (rainfall > 625 mm per annum) are
characterised by sour grass. Trees are uncommon, although they do occur in the high altitude areas
east of the escarpment.
The savanna biome comprises the greater part of the Springbok Flats and the Lowveld (on both the
South African and Mozambican sides), as well as the north-eastern parts of the escarpment. The
vegetation consists of graminoid hemi-cryptophytes and perennial woody plants. These plants are
well adapted to withstand both drought and fire.
The forest biome, mainly composed of Afro-montane forest (or Afro-temperate forest) covers a
small portion of the catchment and is more or less centred on the escarpment. The vegetation
consists mainly of evergreen woody plants. A multi-layered structure can be distinguished, with
perennial woody plants and herbaceous species as the understorey, while epiphytes, ferns and
lianas comprise the sub-canopy cover. Outside of the escarpment the forest biome further includes
smaller patches of Lowveld Riverine forest along the major rivers, as well as mangrove forest at the
mouth of the Limpopo river. There are also four azonal vegetation types namely subtropical alluvial
vegetation, subtropical freshwater wetlands, subtropical salt pans and the Eastern temperate
freshwater wetlands (DEA, 2009).
Overview of the Olifants Catchment |13Figure 1. Map of the vegetation bioregions within the Olifants catchment (including Shingwedzi and
Letaba catchments) in South Africa (source: EMF, 2009).
1.3.2 Vegetation types
There are 52 vegetation types occurring within the Olifants and Letaba catchments in South Africa.
Of these, 29 occur in the Savanna Biome, 13 in the Grassland Biome and 5 in the Forest Biome.
There are also 4 wetland vegetation types that are considered to be azonal or not limited to a
single biome (Fig. 6). For the portion of the Olifants catchment based in Mozambique, Mopane and
undifferentiated (mixed thorn & broadleaf) savanna woodlands cover extensive areas. Parallel to
the Mozambican coast the Indian Ocean Coastal belt biome is found which is composed of a mosaic
of vegetation types that include dune forest, savannah woodland, grassland and mangrove forest
(MICOA, 2009). This area also contains the extensive Limpopo river floodplain with its associated
vegetation. The biomes and vegetation types occurring within the Olifants Letaba EMF area in South
Africa are summarised in Table 3 below (the table also contains their conservation status).
Overview of the Olifants Catchment |14TABLE 1. CONSERVATION STATUS AND COVERAGE OF VEGETATION IN THE OLIFANTS CATCHMENT IN
SOUTH AFRICA (INCLUDING SHINGWEDZI AND LETABA CATCHMENTS) (SOURCE: DEA, 2009)
VEGETATION TYPE BIOME COVERAGE COVERAGE CONS. PROTECTED REMAIN CONSERVATION
(KM2) IN % TARGET STAT
CATHEDRAL Savanna 180.633 0.245 19% 100% 99.60% Least threatened
MOPANE BUSHVELD
CENTRAL SANDY Savanna 7 906.65 10.738 19% 75.90% 2.4% Vulnerable
BUSHVELD (+2.2%)
EASTERN HIGHVELD Grassland 6 264.644 8.508 24% 0.30% 56% Endangered
GRASSLAND Biome
EASTERN Azonal 49.263 0.067 24% 4.60% 85.10% Least threatened
TEMPERATE vegetation
FRESHWATER
WETLANDS
GABBRO GRASSY Savanna 219.909 0.299 19% 95.9% 99.60% Least threatened
BUSHVELD Biome (+3.7%)
GOLD REEF Savanna 58.474 0.079 24% 22.1% 84.60% Least threatened
MOUNTAIN Biome (+1.2%)
BUSHVELD
GRANITE LOWVELD Savanna 8 470.518 11.504 19% 17.5% 79.20% Vulnerable
Biome (+17.3%)
GRAVELOTTE Savanna 309.489 0.42 19% 0% 85.50% Least threatened
ROCKY BUSHVELD Biome (+6.9%)
IRONWOOD DRY Forests 3.986 0.005 100% 77.80% 99.90% Critically
FOREST endangered
LEGOGOTE SOUR Savanna 124.243 0.169 19% 1.6% 50.40% Endangered
BUSHVELD Biome (+2.3%)
LEOLO SUMMIT Grassland 20.344 0.028 24% See text Vulnerable
SOURVELD Biome
LIMPOPO RIDGE Savanna 0.463 0.0006 19% 18.1% 99.10% Least threatened
BUSHVELD Biome (+1.8%)
LOSKOP MOUNTAIN Savanna 2 044.407 2.777 24% 14.5% 97.60% Least threatened
BUSHVELD Biome (+1.9%)
LOSKOP Savanna 759.911 1.032 19% 11.30% 75.80% Vulnerable
THORNVELD Biome
LOWVELD RIVERINE Forests 5.528 0.008 100% 50% 97.60% Critically
FOREST (+3%) endangered
LOWVELD RUGGED Savanna 3 154.105 4.284 19% 34.4% 80.20% Least threatened
MOPANEVELD Biome (+5.6%)
LYDENBURG Grassland 2 122.306 2.882 24% 2.5% 77.70% Vulnerable
MONTANE Biome (+5.9%)
GRASSLAND
LYDENBURG Grassland 1 207.783 1.64 24% 1.90% 78.70% Vulnerable
THORNVELD Biome
Overview of the Olifants Catchment |15MAKHADO SWEET Savanna 370.419 0.503 19% 0.80% 72.80% Vulnerable
BUSHVELD Biome
MAKULEKE SANDY Savanna 512.62 0.696 19% 31.50% 73.30% Vulnerable
BUSHVELD Biome
MAMABOLO Savanna 395.141 0.537 24% 7.60% 93.90% Least threatened
MOUNTAIN Biome
BUSHVELD
MARIKANA Savanna 1.456 0.002 19% 0.7% 52.10% Endangered
THORNVELD Biome (+1.5%)
MOPANE BASALT Savanna 2 761.235 3.75 19% 100% 99.60% Least threatened
SHRUBLAND Biome
MOPANE Savanna 310.462 0.422 19% 100% 99.70% Least threatened
GABBROSHRUBLAND Biome
NORTHERN forests 1.22 0.002 31% 28.8% 98.50% Least threatened
AFROTEMPERATE (+2.8%)
FOREST
NORTHERN Grassland 8.108 0.011 27% 56.1% 99.30% Least threatened
ESCARPMENT Biome (+5.8%)
AFROMONTANE
FYNBOS
NORTHERN Grassland 449.866 0.611 27% 2.1% 47.70% Endangered
ESCARPMENT Biome (+8.5%)
DOLOMITE
GRASSLAND
NORTHERN Grassland 654.765 0.889 27% 15.3% 61.60% Vulnerable
ESCARPMENT Biome (+9.2%)
QUARTZITE
SOURVELD
NORTHERN Savanna 548.704 0.745 24% 98.80% 99.80% Least threatened
LEBOMBO Biome
BUSHVELD
NORTHERN Forests 280.783 0.831 30% 10% 83.70% Least threatened
MISTBELT FOREST (+25.2%)
NWAMBYIA-PUMBE Savanna 94.438 0.1283 19% 98.70% 99.60% Least threatened
SANDY BUSHVELD Biome
OHRIGSTAD Savanna 1 998.128 2.714 24% 7.6% 90.70% Least threatened
MOUNTAINBUSHVEL Biome (+4.2%)
D
PHALABORWA- Savanna 2 225.556 3.023 19% See text 95.10% Least threatened
TIMBAVATI Biome
MOPANEVELD
POLOKWANE Savanna 1147.28 1.558 19% 1.4% 83.20% -
PLATEAU BUSHVELD Biome (+0.7%)
POUNG DOLOMITE Savanna 846.795 1.15 24% 9.9% 94.10% Least threatened
MOUNTAIN Biome (+6.2%)
BUSHVELD
RAND HIGHVELD Grassland 6 027.493 8.186 24% 0.90% 58.50% Endangered
GRASSLAND Biome
SAND FOREST Forests 6.736 0.009 100% 42.10% 98.50% Critically
endangered
Overview of the Olifants Catchment |16SEKHUKHUNE Grassland 1 381.194 1.876 24% 72% Vulnerable MONTANE Biome GRASSLAND SEKHUKHUNE Savanna 2 316.118 3.146 24% (+0.4%) 86.30% Least threatened MOUNTAIN Biome BUSHVELD SEKHUKHUNE Savanna 2 522.240 3.425 19% 0.8% 74.50% Vulnerable PLAINS Biome (+1%) BUSHVELD SOWETO HIGHVELD Grassland 704.58 0.957 24% 0.20% 52.70% Endangered GRASSLAND Biome SPRINGBOKVLAKTE Savanna 5 341.311 7.254 19% 1% 50.70% Endangered THORNVELD Biome (+2.6%) STRYDPOORT Grassland 184.877 0.251 24% 17.2% 99.40% Least threatened SUMMIT SOURVELD Biome (+1.7%) SUBTROPICAL Azonal 166.448 0.226 31% See text 84.50% Least threatened ALLUVIAL Vegetation VEGETATION SUBTROPICAL Azonal 12.939 0.176 24% 40%-50% 96.40% Least threatened FRESHWATER Vegetation (+10.5%) WETLANDS SUBTROPICAL SALT Azonal 2.972 0.004 24% 42% 89.50% Least threatened PANS Vegetation TSENDE Savanna 5 274.542 7.164 19% 63.3% 88.40% Least threatened MOPANEVELD Biome (+4.8%) TSHOKWANE-HLANE Savanna 463.24 0.629 19% 64.4% 83.50% Least threatened BASALT Biome (+3.4%) LOWVELD TZANEEN SOUR Savanna 3 123. 146 4.242 19% 1.3% 59.20% Endangered BUSHVELD Biome (+2.1%) WOLKBERG Grassland 260.845 0.354 27% 48.6% 96.70% Least threatened DOLOMITE Biome (+6.2%) GRASSLAND WOODBUSH Grassland 331.682 0.45 27% 0% - Critically GRANITE Biome (+14.9%) endangered GRASSLAND 1.3.3 Centres of endemism There are two Centres of Endemism that occur within the Olifants River catchment, namely the Sekhukhuneland and Wolkberg Centres of Endemism within South Africa. The Sekhukhuneland Centre of Endemism is entirely within the catchment. Approximately half of the Wolkberg Centre of Endemism is within the catchment. These Centres of Endemism contain high levels of diversity with many species restricted entirely to these areas. As such they are of high priority in terms of conservation. The centres of Endemism found within the study area are of special concern. The high biodiversity and the many unique plant species restricted to these areas means that they are particularly vulnerable (DEA, 2009). Overview of the Olifants Catchment |17
Wolkberg Centre The Wolkberg Centre is extremely floristically rich, with more than 40 species endemic/near endemic to the dolomites and more than 90 to the quartz- and shale-derived substrates within in the area. These figures are conservative, with more taxa likely to be added as knowledge of the flora improves. The three families with the largest number of endemics on the quartzitic and related rock types are the Asteraceae, Iridaceae and Liliaceae. The asteraceous genus Helichrysum, with 10 species being the most prolific in producing endemics. Gladiolus has more than ten species endemic to the region as a whole. The Liliaceae is the family with the largest number of dolomite endemics to the region as a whole, followed by the Euphorbiaceae, Lamiaceae and Acanthaceae. For mosses, the Wolkberg Centre is one of the main southern African centres of diversity and a secondary centre of endemism. Significantly, nearly all the endemics (notably the quartzitic ones) are grassland species. Most of the taxa endemic to the Wolkberg Centre appear to be palaeoendemics. The Wolkberg Centre, especially the arid dolomite areas, shares many species with the adjacent Sekhukhuneland Centre, several of which are endemic to the combined region (DEA, 2009). Threats The high-rainfall grasslands of the Wolkberg Centre are seriously threatened by mainly commercial afforestation. Efforts to conserve the flora of the Wolkberg Centre have hitherto focused mainly on the protection of the patches of floristically poor Afromontane Forest, while the endemic-rich grasslands have been destroyed at an alarming rate, particularly by the timber industry. The little grassland that remains is also being threatened by invader alien plants (mainly from plantations) as well as lack of frequent burning, particularly in plantation areas. Frequent fires are essential for maintaining grassland structure and phytodiversity. Less than 1% of the montane grasslands, the vegetation type richest in Wolkberg Centre endemics, is conserved (DEA, 2009). Sekhukhune Centre The vegetation of the Sekhukhuneland Centre has never been studied in detail. It is usually mapped as Mixed Bushveld. However, floristically the bushveld of Sekhukhuneland Centre is quite unique and certainly deserves recognition as a separate type. The Kirkia wilmsii, a species that is relatively rare in other parts of the Mixed Bushveld is a characteristic tree of this area. Vegetation differences between the north- and south-facing aspects of the mountains are often striking. Intriguing vegetation anomalies associated with heavily eroded soils are present throughout the region. The flora of the Sekhukhuneland Centre is still poorly known, with many apparently endemic species awaiting formal description. Families particularly rich in Sekhukhuneland Centre endemics include the Anacardiaceae, Euphorbiaceae, Liliaceae, Lamiaceae and Vitaceae. A still-to- be-described monoptypic genus of the Alliaceae is endemic also. The area around Burgersfort is reputed to have the highest concentration of Aloe species in the world. The Leolo Mountains harbour relic patches of Afromontane Forest, Fynbos-type vegetation and several Sekhukhuneland Centre endemics. There are also some rare wetlands in the summit area (DEA, 2009). Threats The natural biodiversity of the Sekhukhuneland Centre of Endemism provides diverse important goods and services to the rural communities, such as traditional medicine, grazing and browse, fuel, food, housing materials. Its grassland ecosystems play an important role in the preservation of agricultural biodiversity. The area is however under threat from factors such as mining for heavy metals, inappropriate land management, rural sprawl and unsustainable use of natural resources. This affects the level of goods and services provided by the ecosystem (Victor et al, 2005). Overview of the Olifants Catchment |18
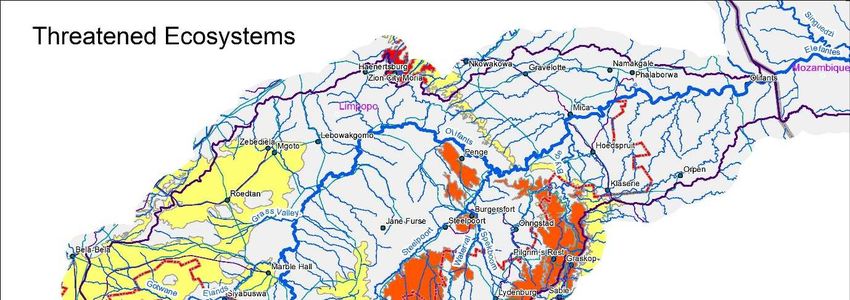
1.3.4 Threatened ecosystems
Several areas within the catchment have been classified as critically endangered, endangered or
vulnerable ecosystems at the South African level (NBA, 2011). Systematic biodiversity assessments
have also been conducted at the provincial level in SA, which include the following categories
(MBCP, 2007):
Protected areas: already managed for biodiversity protection;
Irreplaceable: 100% irreplaceable – no other options available to meet targets;
Highly significant: 50 – 99% irreplaceable – very limited options available to meet targets;
Important & necessary: lower irreplaceable value, less than 50% but still required to meet
targets;
Least concern: areas of natural habitat that could be used to meet some targets but not needed
now, as long as other areas are not lost;
No natural habitat remaining: virtually all natural habitat has been irreversibly lost as a result
of cultivation, timber plantations, mining, urban development.
Geological systems
Figure 7: Map of the threatened ecosystems within the Olifants catchment (including Shingwedzi and
Letaba catchments) in South Africa (source: EMF, 2009).
Overview of the Olifants Catchment |191.4 Summarized overviews of secondary catchments in the
Olifants Catchment in South Africa
1.4.1 Upper Olifants River sub-catchment
Geological Karoo sequence (sedimentary rocks)
systems
Predominantly arenaceous rocks (sandstone, quartzitic sandstone, feldspathic sandstone,
Lithology arkose, shale and grit); partly basic intrusive rocks (diabase & dolerite) and
(Rock acid/intermediate/alkaline/intrusive & extrusive rocks
Topography Comprises the Highveld with undulating plains and pans
Predominantly plinthic catena- dystrophic and/or mesotrophic; red soils not widespread-
Soils upland duplex and margalitic soils rare
Biome Grassland Biome
Bioregion Mesic Highveld Grassland Bioregion
1.4.2 Wilge River sub-catchment
Geological Karoo sequence (sedimentary rocks
systems
Predominantly arenaceous rocks (sandstone, quartzitic sandstone, feldspathic sandstone,
Lithology arkose, shale and grit); predominantly diamictite; basic intrusive rocks (diabase &
(Rock dolerite); predominantly carbonate rocks (limestone & dolomite); basic intrusive rocks
(diabase & dolerite); predominantly meta-argillaceous rocks
Topography Highveld undulating plains and pans
Plinthic catena: dystrophic and/or mesotrophic; red soils not widespread- upland duplex
and margalitic soils rare; Plinthic catena: dystrophic and/or mesotrophic; red soils
Soils widespread- upland duplex and margalitic soils rare; Red-yellow apedal- freely drained
soils- red- high base status- < 300 mm deep
Biome Grassland Biome
Bioregion Mesic Highveld Grassland Bioregion
Overview of the Olifants Catchment |201.4.3 Upper Olifants/Elands River sub-catchment
Geological Karoo sequence (sedimentary rocks); Bushveld Igneous Complex (Igneous rocks) and
systems Transvaal sequence (sedimentary and metamorphosed rocks)
Acid/intermediate/alkaline intrusive rocks (various granitoids & syenite);
Lithology
acid/intermediate/alkaline intrusive & extrusive rocks (rhyolite, andesite, tuff,
(Rock types) volcanic brecia, felsite & quartz porphyry)
Topography Springbok Flats – large open plains; Nebo plateau; Mountains and Foothills
Glenrosa and/or Mispah forms; miscellaneous land classes; red-yellow apedal-freely
Soils drained soils; Prismacunatic and/or pedocunatic diagnostic horizons and Plinthic catena
Biome Savanna Biome
Bioregion Central Bushveld Bioregion
1.4.4 Steelpoort River sub-catchment
Geological Soutpansberg Group and Waterberg Basin (sedimentary rocks with intruding lavas) and
systems Bushveld Igneous Complex
Lithology Intermediate/basic/ultra basic & mafic intrusive rocks and undifferentiated rocks &
(Rock types) various mixed lithologies
Topography Mountains and foothills; high mountains of the escarpment
Red-yellow apedal- freely drained soils; Glenrosa and/or Mispah forms; Prismacunatic
Soils and/or pedocunatic diagnostic horizons; Plinthic catena
Biome Savanna & Grassland Biome
Bioregion Central Bushveld Bioregion
Overview of the Olifants Catchment |211.4.5 Middle Olifants River sub-catchment
Bushveld Igneous Complex (igneous rocks); Karoo sequence (sedimentary rocks);
Geological
Transvaal sequence (sedimentary and metamorphosewd rocks) and Archean granite and
systems Gneiss Basalt complex (sedimentary rocks with intruding lava)
Intermediate/basic/ultra basic & mafic intrusive rocks; Acid/intermediate/alkaline
Lithology
intrusive rocks (various granitoids and syenite); basic/intermediate/mafic extrusive
(Rock types) rocks (basalt & andesitic lava); argillaceous & arenaceous rocks
Topography Springbok Flats – large open plains
Glenrosa and/or Mispah forms; Grey regic; Miscellaneous land classes; vertic-melanic-
Soils
red structured diagnostic horizons; Red-yellow apedal; Plinthic catena
Biome Savanna Biome
Bioregion Central Bushveld Bioregion
1.4.6 Blyde River sub-catchment
Geological Transvaal sequence (sedimentary and metamorphosed rocks) and Archean granite and
systems Gneiss Basalt complex (sedimentary rocks with intruding lava)
Undifferentiated rocks and various mixed lithologies; predominantly carbonate rocks
Lithology (limestone and dolomite); predominantly meta-arenaceous rocks (quartzite, gneiss &
(Rock types) migmatite); alluvium (clay, sand, gravel & boulders) and basic/intermediate/mafic
extrusive rocks (basalt & andesitic lava)
High mountains of the Great Escarpment (incl. Drakensberg and Wolkeberg Mountains);
Topography mountains and Foothills; Lowveld (undulating plains & extremely irregular undulating
plains)
Glenrosa and/or Mispah forms; Miscellaneous land classes- rocky areas with
miscellaneous soils; Red-yellow apedal- freely drained soils- red- high base status- < 300
Soils mm deep; Red-yellow apedal- freely drained soils; red and yellow- dystrophic and/or
mesotrophic
Biome Contains savannah, grassland and forest Biomes
Bioregion Lowveld, Mesic Highveld Grassland and Zonal & intrazonal Forest Bioregions
Overview of the Olifants Catchment |221.4.7 Lower Olifants River sub-catchment
Geological
Archean granite and Gneiss Basalt complex (sedimentary rocks with intruding lava)
systems
Predominantly meta-arenaceous rocks (quartzite, gneiss & migmatite); cid/
intermediate/alkaline intrusive rocks (various granitoids and syenite); predominantly
Lithology
(banded) iron formation; predominantly carbonate rocks (limestone & dolomite);
(Rock types) predominantly pyroclastic rocks (tuff & agglomerate); intermediate/basic/ultra basic &
mafic intrusive rocks)
High Mountains of the Great Escarpment; Mountains & Foothills; Prominent secluded
Topography hills; Parallel Hills; Lowveld (undulating & extremely irregular undulating plains)
Glenrosa and/or Mispah forms (other soils may occur)- lime rare or absent in upland
soils but generally present in low-lying soils; Grey regic sands and other soils;
Soils Miscellaneous land classes; Red-yellow apedal- freely drained soils; red and yellow-
dystrophic and/or mesotrophic; Red-yellow apedal- freely drained soils; Red and
yellow- high base status- usually < 15% clay
Biome Savanna
Bioregion Lowveld & Mopane Bioregions
Overview of the Olifants Catchment |232 Water resources
2.1 Water resources overview of the Olifants catchment in
South Africa
2.1.1 Surface Water: quality and quantity
Water quality
The key pressure on water quality in the Upper Olifants (B1) and Wilge (B2) secondary catchments
is caused by intensive coal mining activities, where the discharge of mine effluents into the natural
streamflow result in general acidification of the system, heavy metal concentrations, sulphates and
other contaminants via acid mine drainage (Dabrowski and De Klerk, 2013; Hobbs et al., 2008; DWA,
2010). The water quality is under threat from past and present coal mining activities. Currently, it
appears that acid mine drainage seeping from old abandoned coal mines are having a significant
impact on the river system and is the most important source of metal concentrations in the river
(Bell et al., 2001; CSIR, 2013). More specifically, badly affected tributaries of the Olifants River
from AMD pollution include the Klipspruit, Blesbok Spruit, Kromdraai Spruit and Saalklap Spruit.
During prolonged dry periods and winter seasons, the potential for the Olifants and Wilge rivers to dilute
this AMD pollution can be significantly reduced and limited. Although current operational mines are not
contributing as much to heavy metal concentrations in the river system in comparison to old abandoned
mines, it will be important to develop appropriate management plans at mine closure in order to
prevent further increase in AMD. Approximately 62 million m3/a of contaminated water is predicted to
decant from mines post closure in the Upper Olifants (DWAF, 2004).
Furthermore, water quality issues in these two secondary catchments also rise due to a
combination of other anthropogenic activities such as coal-fired power generation (Williams et al.,
2010), industrial activities (e.g. chemical manufacturers), irrigated agriculture (Dabrowski and De
Klerk, 2013) and poorly operating wastewater treatment works (Oberholster et al., 2013). As a result,
most of the water pollution in the Olifants WMA occurs in the Upper basin. These multiple sources of
water pollution have led to raising concerns about ecological and human health risks in the Upper
Olifants as well as further downstream in the catchment. Most of this contaminated water from the
Upper catchment eventually reaches the Loskop dam, which acts as a sink from upstream pollutants
(Oberholster et al., 2010; CSIR, 2013), before it flows further down to the Kruger National Park and
into Mozambique. However, the study by Oberholster et al. (2010) suggested that the aquatic system
of the Loskop dam is becoming hypertrophic and has been occasionally experiencing massive toxic blue-
green algae blooms since 2008. The high concentration of metals, sulphates and nutrient and the
change in trophic status has had adverse effect on the aquatic biodiversity (CSIR, 2013). For example,
tumour formation and high concentrations of aluminium and iron were in fish organs as well as and
severe liver necrosis in certain fish species in Loskop Dam (Oberholster et al., 2012).
In the Elands (B3), Steelpoort (B4) and Middle Olifants (B5) secondary catchments, water quality
issues are primarily related to salinity, eutrophication, toxicity and sediment (DWAF, 2004). Mining
activities and irrigated agriculture near the Steelpoort area are the main cause for salinity and
eutrophication problems. Toxicity problems have been associated with the use pesticides and
herbicides however this needs to be verified by further monitoring (DWA, 2010). Land degradation,
poor agricultural practices and overgrazing in the rural areas within the Middle Olifants are
responsible for sediment pollution (DWAF, 2004).
Overview of the Olifants Catchment |24Moreover, this production of sediment causes operational problems at the downstream Phalaborwa
Barrage. Sediment-laden water releases from the Phalaborwa Barrage into the KNP have been the
cause for massive fish kills (Buermann et al., 1995; DWAF, 2004).
In the Lower Olifants (B7) secondary catchment, the major water quality issue is caused by
discharges from the mining activities around Phalaborwa in the Ga-Selati River (DWAF, 2004; DWA,
2010). Consequently, the poor quality acidic water in the Ga-Selati River eventually impacts on the
Olifants River in the KNP. However, the good water quality coming from the Blyde River (in Blyde
secondary catchment) along with the Mohlapitse River (in Lower Olifants secondary catchment) help
improve the water quality in the Olifants River, keeping the water quality at an acceptable quality for
the KNP. The Blyde River is recognised as a relatively pristine river and is classified in a ‘good to
natural’ ecological state (Ballance et al., 2001). Moreover, it has been shown that the Blyde River’s
contribution to diluting water pollution in the Olifants River results in important reduction in sulphate
levels (Villiers and Mkwelo, 2009).
Finally, there is a large network of DWA water-quality monitoring sites across the Olifants WMA.
More specifically, there is a moderate to good distribution of these monitoring sites in the Upper
and Lower Olifants sub-catchments but a poor distribution in the Middle Olifants, especially in the
former homeland areas (DWA, 2010).
Water quantity
The mean annual runoff is the amount of water on the surface of the land that can be utilised in a
year, it is calculated as an average over several years (Nel et al., 2011). Therefore, areas with high
mean annual runoff play an important role to the overall water supply of the system. The estimated
total mean annual runoff (MAR) for the Olifants WMA is 2 042 million m3/a (DWAF, 2004). Most the
surface runoff originates from the higher rainfall southern and mountainous areas parts of the
catchment (DWAF, 2003). Moreover, the preliminary estimations of ecological Reserve requirement
is 460 million m3/a (DWAF, 2004). The natural Mean Annual Runoff and requirements for the
Ecological Reserve (million m3/a) for the Upper, Middle, Lower Olifants and Steelpoort area are
listed in Table 4 (delineation of sub-areas based on DWA, 2004).
TABLE4: NATURAL MEAN ANNUAL RUNOFF AND ECOLOGICAL RESERVE REQUIREMENTS (million m3/a)
IN THE OLIFANTS WMA (DWAF, 2004)
The National Freshwater Ecosystem Priority Areas project identified sub-quaternary catchments
with high water yield areas. These high water yield areas are defined as areas where the mean
annual run-off (MAR) is at least three times more than the average for the related primary catchment
(Nel et al., 2011). Although these high water yield areas are not all considered FEPAs, it is important
to maintain them in a good ecological condition as they contribute to the sustainable development
of water resources in the catchment.
Overview of the Olifants Catchment |25Figure 8 shows the area with the highest water yield in the Olifants catchment (shown on the map
as >500% MAR) is within the Blyde sub-catchment. Furthermore, the southern part of the Steelpoort
sub-catchment and the mountainous areas in the Lower Olifants sub-catchment are also considered
high water yield areas (shown on the map as >300% MAR).
Figure 8: Olifants Catchment: Mean Annual Runoff per sub-quaternary catchment expressed as a
percentage of the average of the primary catchment. Sub-quaternary catchment areas with a
mean annual runoff about 300% are considered high water yield areas.
Since 2001, several Reserve studies have been carried out in the Olifants catchment. More
specifically, a comprehensive determination of the Reserve was undertaken from 2001 to 2003 with the
aim of quantifying environmental water requirements (EWR) in order to maintain and protect the
aquatic ecosystem in such a way that they can continue to provide the goods and services to society
(DWAF, 2001). This study selected 16 EWR sites which are located on the main stem of the Olifants
river and its major tributaries (Figure 9 and Table 5). Additional Reserve determination studies
have been carried out throughout the last few years in order to provide further information (DWA,
2011a). Table 5 lists all 16 EWR sites from the comprehensive Reserve study in the Olifants
catchment.
Overview of the Olifants Catchment |26Figure 9: Location of EWR sites in the Olifants catchment in South Africa
TABLE 5: ENVIRONMENTAL WATER REQUIREMENTS (EWR) INFORMATION BASED ON PREVIOUS RESERVE
STUDIES IN THE OLIFANTS CATCHMENT IN SOUTH AFRICA (TABLE ADAPTED FROM DWA, 2011A)
EWR SITE RIVER SECONDARY MEAN ANNUAL % EWR LEVEL
CATCHMENT RUNOFF (106M3)
EWR1 Olifants Upper Olifants (B1) 184.52 18.6 Comprehensive
EWR2 Olifants Elands (B3) 500.63 23.8 Comprehensive
EWR3 Klein Olifants Upper Olifants (B1) 81.54 27.0 Comprehensive
EWR4 Wilge Wilge (B2) 175.50 29.9 Comprehensive
EWR5 Olifants Elands (B3) 570.98 19.1 Comprehensive
EWR6 Elands Elands (B3) 60.30 17.9 Comprehensive
EWR7 Olifants Middle Olifants (B5) 726.52 12.7 Comprehensive
EWR8 Olifants Lower Olifants (B7) 813.04 15.2 Comprehensive
EWR9 Steelpoort Steelpoort (B4) 120.17 15.2 Comprehensive
EWR10 Steelpoort Steelpoort (B4) 336.63 12.1 Comprehensive
EWR11 Olifants Lower Olifants (B7) 1321.80 13.7 Comprehensive
EWR12 Blyde Blyde (B6) 383.70 34.5 Comprehensive
EWR13 Olifants Lower Olifants (B7) 1760.70 23.6 Comprehensive
EWR14A Ga-Selati Lower Olifants (B7) 52.20 31.2 Comprehensive
EWR14B Ga-Selati Lower Olifants (B7) 72.74 24.8 Comprehensive
EWR16 Olifants Lower Olifants (B7) 1916.90 21.6 Comprehensive
Overview of the Olifants Catchment |272.1.2 River characteristics
The main tributaries of the Olifants River in South Africa are the Wilge, Elands and Ga-Selati Rivers
on the left bank and the Klein Olifants, Steelpoort, Blyde, Klaserie and Timbavati Rivers on the
right bank (DWA, 2011b).
River ecoregional classification
River ecoregional classification groups rivers according to similarities generally based on attributes
such as physiography, climate, rainfall, geology and potential natural vegetation. At a very broad
scale, thirty-one ecoregions (Level 1) have been defined and described for South Africa (Kleynhans
et al., 2005). Of these, 9 ecoregions occur in the Olifants WMA (Figure 10 and Table 6). Moreover,
the dominant ecoregions are the Highveld in the Upper Olifants, the Bushveld and Eastern
Bankenveld in the Middle Olifants and the Lowveld in the Lower Olifants (Figure 10). The
characteristics of the 9 different river ecoregions in the Olifants catchment are described in Table 6.
Figure 10: River Ecoregional classification in the Olifants catchment in South Africa.
Overview of the Olifants Catchment |28You can also read