Overview of the Genetic Diversity of African Macrotermes (Termitidae: Macrotermitinae) and Implications for Taxonomy, Ecology and Food Science
←
→
Page content transcription
If your browser does not render page correctly, please read the page content below
insects
Article
Overview of the Genetic Diversity of African Macrotermes
(Termitidae: Macrotermitinae) and Implications for Taxonomy,
Ecology and Food Science
Bronwyn Egan 1 , Zwannda Nethavhani 2 and Barbara van Asch 2, *

                                          1   Department of Biodiversity, University of Limpopo, Private Bag X1106, Mankweng 0727, South Africa;
                                              bronwyn.egan@ul.ac.za
                                          2   Department of Genetics, University of Stellenbosch, Private Bag X1, Matieland 7602, South Africa;
                                              20998880@sun.ac.za
                                          *   Correspondence: bva@su.ac.za

                                          Simple Summary: Macrotermes are fungus-growing termites known as ecosystem engineers for their
                                          role in cellulose recycling and soil conditioning. Macrotermes termites are also important as edible
                                          insects and are widely consumed throughout Africa. Accurate identification of Macrotermes species is
                                          challenging because of few and unreliable morphological differences among taxonomic groups. Due
                                          to this limitation, the diversity of African Macrotermes is incompletely described. Genetic data has
                                          provided new insights, but vast geographic regions remain unsurveyed. We generated COI data for
                                          specimens collected in Limpopo, South Africa, where Macrotermes termites are commonly consumed
                                          by local populations, and assessed their diversity in the context of publicly available sequences. We
                                identified 17 genetic groups that most likely represented distinct species, in contrast with the 13

                                          Macrotermes species currently described in Africa. The specimens collected in Limpopo belonged
Citation: Egan, B.; Nethavhani, Z.;
                                          to four genetic groups, suggesting a high diversity of Macrotermes in the region. Our results also
van Asch, B. Overview of the Genetic
                                          showed that Macrotermes species names and genetic groups do not match in most cases, likely due to
Diversity of African Macrotermes
                                          inaccurate identification of specimens. We propose that the genetic groups that are identified here be
(Termitidae: Macrotermitinae) and
                                          used as a background to guide future studies of African Macrotermes with a positive impact on food
Implications for Taxonomy, Ecology
and Food Science. Insects 2021, 12,
                                          science, ecology, taxonomy, phylogeography and phylogenetics.
518. https://doi.org/10.3390/
insects12060518                           Abstract: Macrotermes termites play important ecological roles and are consumed by many communi-
                                          ties as a delicacy and dietary complement throughout Africa. However, lack of reliable morphological
Academic Editor: Michael Rust             characters has hampered studies of Macrotermes diversity in a wide range of scientific fields including
                                          ecology, phylogenetics and food science. In order to place our preliminary assessment of the diversity
Received: 6 May 2021                      of Macrotermes in South Africa in context, we analysed a comprehensive dataset of COI sequences
Accepted: 28 May 2021                     for African species including new and publicly available data. Phylogenetic reconstruction and
Published: 3 June 2021
                                          estimates of genetic divergence showed a high level of incongruity between species names and
                                          genetic groups, as well as several instances of cryptic diversity. We identified three main clades
Publisher’s Note: MDPI stays neutral
                                          and 17 genetic groups in the dataset. We propose that this structure be used as a background for
with regard to jurisdictional claims in
                                          future surveys of Macrotermes diversity in Africa, thus mitigating the negative impact of the present
published maps and institutional affil-
                                          taxonomic uncertainties in the genus. The new specimens collected in Limpopo fell into four distinct
iations.
                                          genetic groups, suggesting that the region harbours remarkable Macrotermes diversity relative to
                                          other African regions surveyed in previous studies. This work shows that African Macrotermes have
                                          been understudied across the continent, and that the genus contains cryptic diversity undetectable by
                                          classic taxonomy. Furthermore, these results may inform future taxonomic revisions in Macrotermes,
Copyright: © 2021 by the authors.
                                          thus contributing to advances in termitology.
Licensee MDPI, Basel, Switzerland.
This article is an open access article
distributed under the terms and
                                          Keywords: cryptic species; genetic divergence; mitochondrial markers; termites
conditions of the Creative Commons
Attribution (CC BY) license (https://
creativecommons.org/licenses/by/
4.0/).

Insects 2021, 12, 518. https://doi.org/10.3390/insects12060518                                              https://www.mdpi.com/journal/insects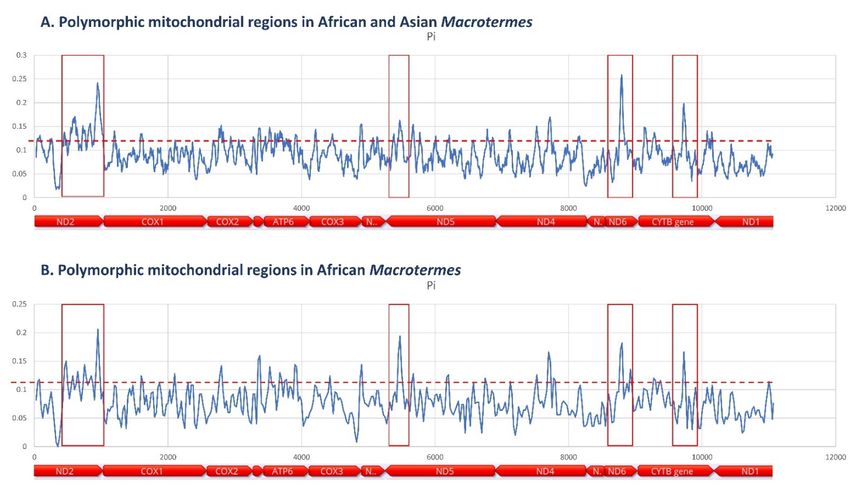
Insects 2021, 12, 518                                                                                              2 of 16

                        1. Introduction
                              Termites (Blattodea) are the second most consumed insect group in the world, sur-
                        passed only by grasshoppers, crickets and locusts [1]. More than 1000 termite species have
                        been recorded in Africa, all of which make vital environmental contributions by maintain-
                        ing long-term soil yields and restoring unproductive soil [2]. Africa is also the hotspot
                        of global termite consumption, with reported utilization of termites as food, medicine,
                        livestock feed and for spiritual practices in 19 countries across the continent, in contrast
                        with only five countries in both America and Asia, the closest competitors for edible termite
                        diversity [1].
                              The family Termitidae is divided into five subfamilies, and the subfamily Macroter-
                        mitinae consists of approximately 330 species in 14 genera [3]. All Macrotermitinae have an
                        obligate mutualism with Termitomyces fungi [4]. Macrotermes is the most preferred and well-
                        known of the edible termite genera, likely due to their comparatively large size and high
                        protein and lipid content [1]. The genus Macrotermes is presently divided into 47 species, of
                        which 13 exist in the Afrotropical region [3]. However, this taxonomic structure may not
                        reflect the real diversity of Macrotermes species because termites are notoriously difficult to
                        identify due to their lack of reliable morphological characters [5]. Alates of M. falciger [6],
                        M. subhyalinus [7], M. michaelseni [8], M. bellicosus [9], M. natalensis [10], M. vitrialatus [11]
                        and M. nigeriensis [12] have been reported to be widely consumed in Africa [1,13,14]. Con-
                        sumption of non-reproductive termite castes (i.e., workers and soldiers) is less extensively
                        documented, and the most recorded species on the continent are M. falciger, M. michaelseni
                        and M. nigeriensis [15].
                              Termites are increasingly threatened by changes in land use from communal pas-
                        tureland to organized orchards and intensification of agricultural practices [16]. Due to
                        their role as ecosystem engineers, which includes the ability to modify the physical and
                        chemical distribution of soils and to influence their nutrient and moisture profiles, termite
                        decline can have deleterious effects on the landscape and on organisms throughout the
                        food cycle [17]. Termite colonies can persist in areas richly populated by people, albeit
                        in lower densities [17], and are therefore an important component of functional ecosys-
                        tems within an anthropogenically influenced arena. The role of non-reproductive termite
                        castes in food security is noteworthy, as many other edible insects rely on particular host
                        plant species or a narrow habitat range and are not as robust in their population size and
                        persistence [18,19].
                              In South Africa, termites are the second most consumed insect, particularly in the
                        KwaZulu-Natal and Limpopo provinces, where they are considered by local communities
                        as a delicacy [20]. In the Venda region, alate termites are the most harvested, but the soldier
                        and worker castes are also well appreciated and commonly found for sale [15]. Soldiers
                        and workers can be harvested throughout the year, making them a more consistent food
                        resource than alates [15]. Indeed, many villagers pour water over the dry mounds in winter,
                        which results in easier capture of the soldiers and workers due to the mimicking of spring
                        rains when termites are more active [21]. Due to their year-round availability, soldiers and
                        workers are a promising source of insect protein. In Limpopo, soldier and worker termites
                        are available in numbers, often within people’s yards in more rural areas, and even in
                        towns they can be found on sidewalks.
                              Ethnospecies (i.e., vernacular names used by people in their locality) do not strictly
                        converge with taxonomic classifications [22], although there can be strong links between
                        vernacular and scientific names [13]. Generally, termites are named according to their
                        utilitarian use or known by the damage they cause [22]. Thus, different castes of the
                        same scientific taxon may be known by different vernacular names [22,23]. Although
                        ethnospecies and scientific names do not overlap precisely, the knowledge of local termite
                        experts is vitally important in the recognition of edible species, as well as their collection,
                        preparation for consumption and processing for storage [22]. The species consumed
                        depend on localized indigenous knowledge and personal taste and therefore not all edible
                        termite species are utilized over the entire distribution range of each species [13].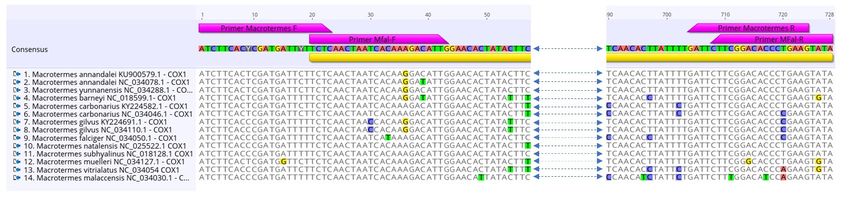
Insects 2021, 12, 518                                                                                                          3 of 16

                                         Despite the ecological and nutritional relevance of termites, food science and other
                                    scientific fields have been negatively impacted by taxonomic uncertainties due to a lack of
                                    reliable morphological characters for species identification. This work provides the most
                                    comprehensive overview to date of African Macrotermes diversity using new and publicly
                                    available COI sequences. Furthermore, we performed a preliminary assessment of the
                                    genetic diversity of termites called “Majeje” or “Makeke”, a traditional food resource in
                                    Limpopo, South Africa.

                                    2. Materials and Methods
                                    2.1. Specimen Collection
                                         Soldiers, workers and alate termites were haphazardly collected at four sites in the
                                    Limpopo Province of South Africa between February and December of 2020 (Table 1,
                                    Figure 1C). Alates (n = 15) were found in house yards, and soldiers and workers (n = 19)
                                    were collected from a single mound at each site. Specimens were euthanized by freezing
                                    within a few hours of collection from the field, and individually stored in 100% ethanol at
                                    room temperature until downstream analyses. DNA was extracted from termite legs using
                                    a standard phenol-chloroform method [24].

      Table 1. Specimens of African Macrotermes collected in the Limpopo Province of South Africa for preliminary assessment of
      species diversity in the region based on COI sequences.

   Specimen             Caste           Site         Collection Date   Municipality       Village            GPS Coordinates
      FT01              Alate        House yard     28-November-2020   Thohoyandou        Lufule 2       −22.96386       30.51733
      FT02              Alate        House yard     28-November-2020   Thohoyandou        Lufule 2       −22.96386       30.51733
      FT03              Alate        House yard     28-November-2020   Thohoyandou        Lufule 2       −22.96386       30.51733
      FT04              Alate        House yard     28-November-2020   Thohoyandou        Lufule 2       −22.96386       30.51733
      FT05              Alate        House yard     28-November-2020   Thohoyandou        Lufule 2       −22.96386       30.51733
      FT06              Alate        House yard     28-November-2020   Thohoyandou        Lufule 2       −22.96386       30.51733
      FT07              Alate        House yard     28-November-2020   Thohoyandou        Lufule 2       −22.96386       30.51733
      FT08              Alate        House yard     10-December-2020      Giyani         Ka-Homu         −23.33400       30.77300
      FT09              Alate        House yard     10-December-2020      Giyani         Ka-Homu         −23.33400       30.77300
      FT10              Alate        House yard     10-December-2020      Giyani         Ka-Homu         −23.33400       30.77300
      FT11              Alate        House yard     10-December-2020      Giyani         Ka-Homu         −23.33400       30.77300
      FT12              Alate        House yard     10-December-2020      Giyani         Ka-Homu         −23.33400       30.77300
      FT13              Alate        House yard     10-December-2020      Giyani         Ka-Homu         −23.33400       30.77300
      FT14              Alate        House yard     10-December-2020      Giyani         Ka-Homu         −23.33400       30.77300
      FT15              Alate        House yard     10-December-2020      Giyani         Ka-Homu         −23.33400       30.77300
     MF01          Soldier/worker   Termite mound    19-August-2020      Tzaneen         Moleketla       −23.68000       30.28000
     MF02          Soldier/worker   Termite mound    19-August-2020      Tzaneen         Moleketla       −23.68000       30.28000
     MF03          Soldier/worker   Termite mound    19-August-2020      Tzaneen         Moleketla       −23.68000       30.28000
     MF04          Soldier/worker   Termite mound    19-August-2020      Tzaneen         Moleketla       −23.68000       30.28000
     MF05          Soldier/worker   Termite mound    19-August-2020      Tzaneen         Moleketla       −23.68000       30.28000
     MF06          Soldier/worker   Termite mound    19-August-2020      Tzaneen         Moleketla       −23.68000       30.28000
     MF07          Soldier/worker   Termite mound    19-August-2020      Tzaneen         Moleketla       −23.68000       30.28000
     MF08          Soldier/worker   Termite mound    19-August-2020      Tzaneen         Moleketla       −23.68000       30.28000
     MF09          Soldier/worker   Termite mound    19-August-2020      Tzaneen         Moleketla       −23.68000       30.28000
     MF10          Soldier/worker   Termite mound    19-August-2020      Tzaneen         Moleketla       −23.68000       30.28000
     MF39          Soldier/worker   Termite mound   30-November-2020   Thohoyandou        Lufule 2       −22.96386       30.51733
     MF40          Soldier/worker   Termite mound   30-November-2020   Thohoyandou        Lufule 2       −22.96386       30.51733
     MF41          Soldier/worker   Termite mound   30-November-2020   Thohoyandou        Lufule 2       −22.96386       30.51733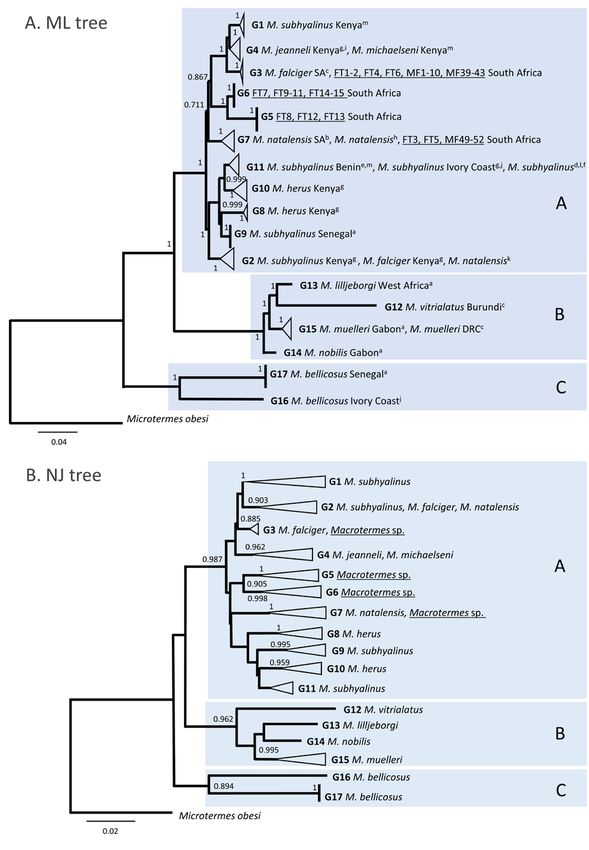
Insects 2021, 12, 518 4 of 16
Table 1. Cont.
Specimen Caste Site Collection Date Municipality Village GPS Coordinates
MF42 Soldier/worker Termite mound 30-November-2020 Thohoyandou Lufule 2 −22.96386 30.51733
MF43 Soldier/worker Termite mound 30-November-2020 Thohoyandou Lufule 2 −22.96386 30.51733
MF49 Soldier/worker Termite mound 14-February-2020 Tzaneen Ga-Mmamatsha −24.012259 29.81153
MF50 Soldier/worker Termite mound 14-February-2020 Tzaneen Ga-Mmamatsha −24.012259 29.81153
MF51 Soldier/worker Termite mound 14-February-2020 Tzaneen Ga-Mmamatsha −24.012259 29.81153
Insects 2021,
MF52 12, x Soldier Termite mound 14-February-2020 Tzaneen Ga-Mmamatsha −24.012259 4 of 16
29.81153
Figure 1.
Figure 1. (A) Map
Map ofof South
South Africa.
Africa. (B) Genetic
Genetic groups
groups of
of African
African Macrotermes
Macrotermes species.
species. (C) Approximate
Approximate location of the
the
collection sites of Macrotermes termites in the Limpopo Province of South Africa, and their mitochondrial genetic groups.
The size
The size of
of the
the circles
circles is
is proportional
proportionalto
tothe
thenumber
numberofofsequences.
sequences.
2.2. DNA Extraction, PCR Amplification and Sequencing
A total
total of
of34
34specimens
specimenswerewere sequenced
sequencedforfor
thethe
standard COICOI
standard barcoding region
barcoding (702
region
(702 bp). PCR
bp). PCR amplifications
amplifications were were performed
performed usingusing
a pairaofpair of species-specific
species-specific primersprimers de-
designed
signed
in this in this study,
study, basedbased
on theoncomplete
the complete mitochondrial
mitochondrial genome
genome M.M.falciger
of of falciger(NC_034050).
(NC_034050).
50 -TCTCAACTAATCATAAAGACATTG-30 and Mfal-R 5′-
The new PCR primers (Mfal-F 5′-TCTCAACTAATCATAAAGACATTG-3′ 50 -
TATACTTCGGGGTGTCCGAAG-3 0
TATACTTCGGGGTGTCCGAAG-3′)) were were manually
manually designed
designed to anneal to the same COI
regions as the universal arthropod
arthropod primers HLO/LCO [25] whilst avoiding the production
primers HLO/LCO
of non-specific amplicons. PCR amplifications
amplifications were performed
performed in a total volume of 5 µL μL
containing 1x of QIAGEN Multiplex PCR Kit (QIAGEN), 0.2 μM µM of each primer, 1.0 µL μL of
MilliQ H2O
MilliQ H2O and
and 0.5
0.5 µL
μL of
of template
template DNA.
DNA. The
The thermal
thermal cycling
cycling program
program was was asas follows:
follows:
15 ◦ C; 35 cycles of 30 s at 94 ◦ C; 90 s at 56 ◦ C; 90 s at 72 ◦ C; and 10 min at 72 ◦ C.
15 min
min atat 95
95 °C; 35 cycles of 30 s at 94 °C; 90 s at 56 °C; 90 s at 72 °C; and 10 min at 72 °C.
PCR products
PCR products were
were sequenced
sequenced unidirectionally
unidirectionally with
with the
the Mfal-F
Mfal-F primer,
primer, using
using the
the BigDye
BigDye
Terminator v3.1 Cycle Sequencing Kit (Applied Biosystems, Waltham,
Terminator v3.1 Cycle Sequencing Kit (Applied Biosystems, Waltham, MA, USA) MA, USA) as per the
as per
manufacturer’s protocol. Capillary electrophoresis was performed at the Central
the manufacturer’s protocol. Capillary electrophoresis was performed at the Central An- Analytical
FacilitiesFacilities
alytical of Stellenbosch University,
of Stellenbosch South Africa.
University, South Africa.
2.3. DNA Sequence Analyses
2.3. DNA Sequence Analyses
Genetic clustering and genetic divergences were calculated using the new sequences
Genetic clustering and genetic divergences were calculated using the new sequences
generated in this study and COI sequences taxonomically assigned to Macrotermes species
generated in this study and COI sequences taxonomically assigned to Macrotermes species
available on GenBank as of 1 April 2021. The initial dataset (n = 278) was subsequently
filtered for (a) sequences identified to the species level, (b) species recorded in Africa, and
(c) sequences longer than 500 bp and with maximum overlap with the standard COI bar-
coding region. The final dataset included 229 sequences of African Macrotermes retrieved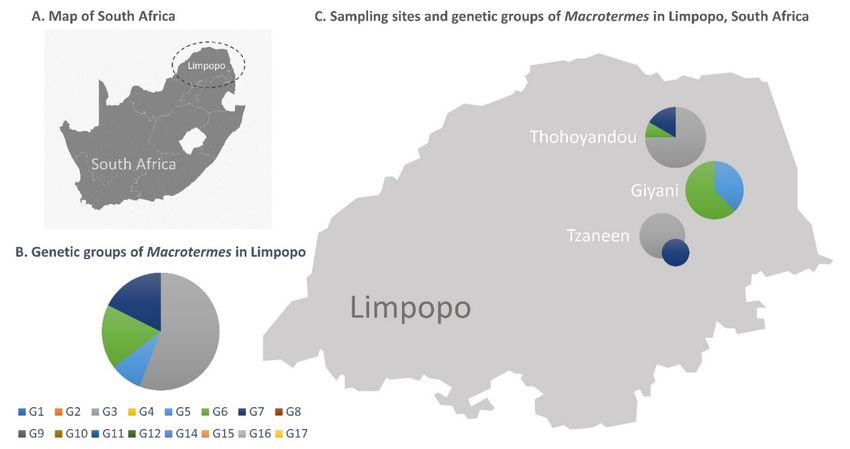
Insects 2021, 12, 518                                                                                              5 of 16

                        available on GenBank as of 1 April 2021. The initial dataset (n = 278) was subsequently
                        filtered for (a) sequences identified to the species level, (b) species recorded in Africa,
                        and (c) sequences longer than 500 bp and with maximum overlap with the standard COI
                        barcoding region. The final dataset included 229 sequences of African Macrotermes re-
                        trieved from GenBank representing 11 species, and 34 new sequences generated in this
                        study. Multiple sequence alignments were performed using the MAFFT algorithm [26]
                        in Geneious Prime v2021.1 (https://www.geneious.com) (accessed on 2 May 2021). Ge-
                        netic clustering of sequences was assessed using a maximum likelihood (ML) tree, with
                        Microtermes obesi (NC_034072) as the outgroup. The tree was run on the PHYML online
                        server (http://www.atgc-montpellier.fr/phyml/) (accessed on 2 May 2021) [27], using the
                        Smart Model Selection [28] and the Fast likelihood-based test (aLERT) [29]. The final tree
                        was drawn using FigTree v1.4.4 (http://tree.bio.ed.ac.uk/) (accessed on 2 May 2021). The
                        dataset was also used to build a Neighbour-joining (NJ) tree in MEGAX [30], under the
                        Kimura 2-parameter (K2P) model [31].
                              Genetic divergences were estimated as percentage of maximum pairwise distances
                        (maximum p-distance, %) in MEGA X, under the K2P model. Intraspecific maximum
                        p-distances were calculated for species groups (i.e., sequences were grouped according to
                        species names), and intragroup maximum p-distances were calculated according to genetic
                        groups (i.e., sequences were grouped according to the clusters recovered on the ML tree,
                        disregarding the names of the sequences).
                              Polymorphic mitochondrial regions were identified on an alignment of 12 Macrotermes
                        mitogenomes (M. annandalei, NC034078; M. barneyi, NC018599; M. carbonarius, NC034046;
                        M. falciger, NC034050; M. gilvus, NC034110; M. malaccensis, NC034030; M. muelleri, NC034127;
                        M. natalensis, NC025522; Macrotermes sp. A TB-2017, KY224531; Macrotermes sp. B TB-2017,
                        KY224525; M. subhyalinus, NC018128; and M. vitrialatus, NC034054) using the DNA Poly-
                        morphism function of DNAsP6 with a 50-bp sliding window and 25-bp step size [32]. The
                        alignment excluded tRNA and rRNA genes, and the AT-rich region.

                        3. Results and Discussion
                        3.1. Overview of the Genetic Diversity of African Macrotermes
                             Morphological identification of termites is notoriously challenging, and taxonomic
                        revisions in Blattodea are necessary to solve the high prevalence of uncertainties [33]. In
                        the face of the limitations of classic taxonomy in this group, DNA sequences may provide
                        a useful tool to solve long-standing issues of species identification in Macrotermes. Several
                        studies have reported incongruencies between genetic data and species names, and it is
                        possible that incorrect identification of Macrotermes species has been affecting results and
                        conclusions in a wide range of scientific fields. In an effort to contribute to solving this
                        problem, we performed a naïve DNA-based approach for inferring genetic groups that
                        potentially correspond to species, using new and publicly available COI sequences for
                        African Macrotermes.

                        3.1.1. Sequence Data for African Macrotermes Are Sparse and Unevenly Distributed
                             In spite of the wide distribution of Macrotermes in Africa, available DNA barcodes
                        showed limited geographic coverage for the genus as sequences were only available for
                        eight countries (Figure 2A). The coverage was also geographically biased: 72% of the
                        sequences originated from Kenya, two countries (Burundi and Benin) were represented by
                        a single sequence (Figure 2B) and South Africa was only represented by three sequences
                        prior to this study. A total of eleven species were represented in the dataset, which
                        comprised mostly sequences identified as M. subhyalinus (77%), followed by M. michaelseni
                        (10%). Other species were represented by a minority of sequences, namely M. falciger and
                        M. herus (3%); M. bellicosus, M. jeanneli and M. natalensis (2%); and M. lilljeborgi, M. muelleri,
                        M. nobilis and M. vitrialatus (1%) (Figure 2C).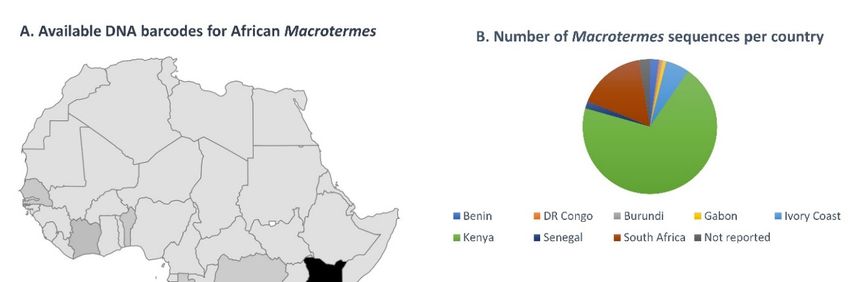
Insects 2021, 12, x 6 of 16
Insects 2021, 12, 518 6 of 16
Figure 2. (A) Distribution of DNA barcodes for Macrotermes species in African countries, as determined using the complete
Figuredataset
2. (A)of sequences available on GenBank as of April 2021, and the new sequences generated in this study. (B) Number of
Distribution of DNA barcodes for Macrotermes species in African countries, as determined using the complete
DNA barcodes available per species, as of April 2021 (including the new sequences generated in this study). (C) Number of
dataset of sequences available on GenBank as of April 2021, and the new sequences generated in this study. (B) Number
sequences available per species (not including new data generated in this study).
of DNA barcodes available per species, as of April 2021 (including the new sequences generated in this study). (C) Number
of sequences available per species (not including new data generated in this study).
3.1.2. Sequences of African Macrotermes Fall into Three Main Clades and Seventeen
Genetic Groups
3.1.2. Sequences of recovered
The ML tree African Macrotermes Fall into Three
three main phylogenetic cladesMain
(A, BClades
and C), and Seventeen
which is in agree-Ge-
netic Groups
ment with previous works [34–37], although a shorter 536-bp of the COI gene, representing
the maximum
The ML treesequence
recovereddataset
threeoverlap, was analysed in
main phylogenetic our study
clades (A, B(Figure
and C), 3A). This is
which broad
in agree-
division into three main clades is also in agreement with the broad topology
ment with previous works [34–37], although a shorter 536-bp of the COI gene, represent- obtained
ingusing a region of the COII gene [38]. The majority of the nodes in the ML tree had high
the maximum sequence dataset overlap, was analysed in our study (Figure 3A). This
statistical support except for the deep split between clade C and the other two clades. Poor
broad division into three main clades is also in agreement with the broad topology ob-
recovery of deep phylogenies using short mitochondrial DNA regions is expected but this
tained using does
limitation a region of thethe
not affect COII gene [38].
conclusions of The majority
our work, of the
which nodes
aimed in the ML
to identify tree had
genetic
high statistical support except for the deep split between clade C and the
groups within the dataset and not to reconstruct the phylogeny of Macrotermes. Sequences other two clades.
Poor
wererecovery
optimally of grouped
deep phylogenies
based on theusing short
topology of mitochondrial
the tree, and on theDNA regions
level is expected
of divergence
but(maximum
this limitation does not
p-distance) affect
within the the conclusions
groups (Table 2), of
i.e.,our work,
groups of which
sequencesaimedthatto
wereidentify
closely related on the tree and for which the intragroup maximum p-distance
genetic groups within the dataset and not to reconstruct the phylogeny of Macrotermes. was lower
than 3% were
Sequences wereconsidered
optimally as a geneticbased
grouped group.onThis
theapproach
topologyallowed
of the for theand
tree, identification
on the level of
of 17 genetic groups (G1 to G17) across the three main clades after testing for all possible
divergence (maximum p-distance) within the groups (Table 2), i.e., groups of sequences
groups (Table S1).
that were closely related on the tree and for which the intragroup maximum p-distance
was lower than 3% were considered as a genetic group. This approach allowed for the
identification of 17 genetic groups (G1 to G17) across the three main clades after testing
for all possible groups (Table S1).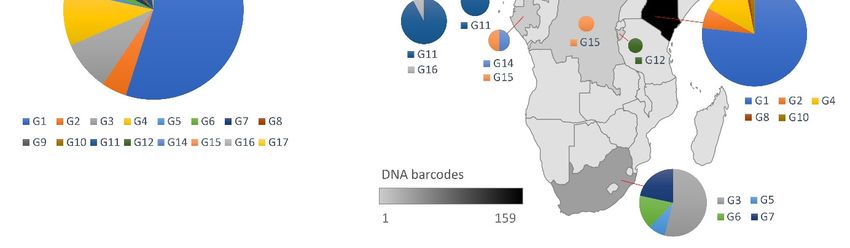
Insects 2021, 12, 518                                                                                                                      7 of 16

      Figure 3. Phylogenetic trees of 228 COI sequences (536 bp) of African Macrotermes. The letters A, B and C on the ML
      and NJ trees represent the main clades in the phylogeny. G1 to G17 represent the different genetic groups in the dataset
      (intragroup maximum p-distances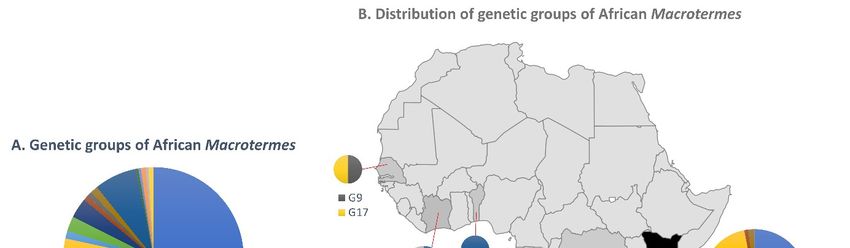
Insects 2021, 12, 518                                                                                               8 of 16

                        Table 2. Pairwise distances among different genetic groups of African Macrotermes. Species—
                        sequences were grouped according to species names. Genetic groups—sequences were grouped
                        according to phylogenetic clusters.

                                                                Maximum             Mean p-Distance
                                     Species                                                                 SE
                                                              p-Distance (%)             (%)
                              Macrotermes bellicosus                8.17                  6.17               0.98
                               Macrotermes falciger                 4.44                  0.54               0.20
                                Macrotermes herus                   4.46                  2.04               0.47
                               Macrotermes jeanneli                 0.00                  0.00               0.00
                              Macrotermes lilljeborgi               n.a.                  n.a.               n.a.
                              Macrotermes michaelseni               0.22                  0.00               0.00
                               Macrotermes muelleri                 1.08                  1.41               0.54
                              Macrotermes natalensis                3.72                  2.04               0.54
                                Macrotermes nobilis                 n.a.                  n.a.               n.a.
                             Macrotermes subhyalinus                6.59                  0.95               0.22
                              Macrotermes vitrialatus               n.a.                  n.a.               n.a.
                                  Genetic group
                                        G1                          0.55                  0.03               0.01
                                        G2                          0.51                  0.18               0.13
                                        G3                          0.33                  0.04               0.03
                                        G4                          1.19                  0.20               0.09
                                        G5                          0.00                  0.00               0.00
                                        G6                          0.00                  0.00               0.00
                                        G7                          2.15                  0.67               0.25
                                        G8                          0.15                  0.00               0.00
                                        G9                          0.00                  0.00               0.00
                                       G10                          1.71                  1.07               0.39
                                       G11                          1.50                  0.40               0.12
                                       G12                          n.a.                  n.a.               n.a.
                                       G13                          n.a.                  n.a.               n.a.
                                       G15                          1.08                  1.41               0.49
                                       G14                          n.a.                  n.a.               n.a.
                                       G16                          n.a.                  n.a.               n.a.
                                       G17                          0.11                  0.00               0.00

                        Clade A: M. subhyalinus, M. jeanneli, M. michaelseni, M. natalensis, M. herus, and M. falciger
                              Clade A represented 96% of the total dataset and had the highest number of species
                        (six), and the highest number of genetic groups (G1 to G11). Clade A also had a high level of
                        incongruity between species groups and genetic groups involving four species (M. falciger,
                        M. herus, M. natalensis and M. subhyalinus) and 84.5% of the sequences in the clade (Figure 3).
                        The most striking case was that of M. subhyalinus, the species that represented 77% of the
                        GenBank sequence dataset. Macrotermes subhyalinus had an intraspecific maximum p-
                        distance of 6.59% (Table 2), and the sequences were distributed in four genetic groups
                        (G1, G2, G9 and G11) in clade A. The sequences in G1 reportedly represent a tentative
                        identification of specimens collected in Kenya [39]. Macrotermes subhyalinus also was part of
                        three other genetic groups: G9 (intragroup maximum p-distance = 0.00%), which included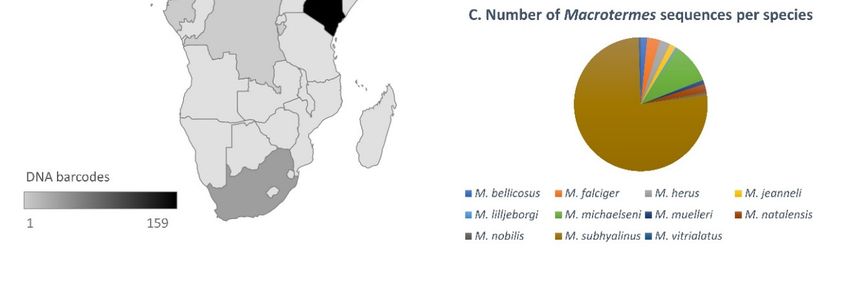
Insects 2021, 12, 518                                                                                            9 of 16

                        M. subhyalinus sequences from Senegal [34]; G11 (intragroup maximum p-distance = 1.50%),
                        which included one M. subhyalinus from the Ivory Coast [37,40] and Benin (Hausberger et al.,
                        2011); in contrast, G2 (intragroup maximum p distance = 0.51%) included M. subhyalinus
                        and M. falciger sampled from Kenya in the same study [40], and one M. natalensis of
                        unreported geographic origin [41]. Therefore, it is likely that the sequences of M. subhyalinus
                        represent four distinct species, in addition to the known differences between M. subhyalinus
                        from East Africa and West Africa [38,40].
                             Macrotermes jeanneli and M. michaelseni formed a group of very similar sequences (G4;
                        intragroup maximum p-distance = 1.76%) suggesting that G4 is composed of conspecific
                        individuals. G4 was closely related to G1 (M. subhyalinus Kenya), which is similar to
                        previous findings using a COII-based tree [38]. Macrotermes michaelseni is a tentative
                        identification of specimens from Kenya based on the assumption that M. michaelseni build
                        mounds with closed ventilation shafts, in contrast with the open ventilation shafts built
                        by M. subhyalinus [39]. Macrotermes jeanneli was reported from Kenya in two different
                        studies [36,40], suggesting consistent identification of specimens.
                             Macrotermes falciger had an intraspecific maximum p-distance of 4.44% suggesting non-
                        conspecificity of the sequences. Macrotermes falciger from South Africa [42] clustered with
                        20 of the new sequences from South Africa in G3 (intragroup maximum p-distance = 0.33%).
                        In G2 (intragroup maximum p-distance = 0.51%), M. falciger from Kenya [40] clustered with
                        M. subhyalinus from Kenya [40] and one M. natalensis of unknown geographic origin [41].
                             Macrotermes natalensis had a maximum intraspecific p-distance of 3.72% and clustered
                        in two genetic groups. As described above, G7 included M. natalensis from South Africa [34],
                        M. natalensis from unreported geographic origin [43] and six of the new sequences from
                        South Africa, and G2 included M. natalensis of unreported geographic origin [41] and
                        M. falciger and M. subhyalinus from Kenya [40]. The existence of two species in M. natalensis
                        has been noted previously in specimens collected in South Africa and Malawi [38].
                             Macrotermes herus was sampled in Kenya [40] and had an intraspecific maximum
                        p-distance of 4.46%. The sequences clustered in two groups: G8 (intragroup maximum
                        p-distance = 0.15%) and G10 (intragroup maximum p-distance = 1.71%), indicating that
                        they represent two distinct species. G8 and G10 represent respectively M. herus from west
                        of the Rift Valley in Kenya and M. herus within the Rift Valley that were hypothesized to
                        represent distinct species in a previous study [40].

                        Clade B: M. lilljeborgi, M. muelleri, M. nobilis and M. vitrialatus
                             Clade B included four species (n = 5) sampled in West Africa and Burundi [34,42], three
                        of which were represented by a single sequence (M. lilljeborgi, M. muelleri and M. nobilis).
                        The sequences in G15 were reported as M. muelleri in two independent studies, and likely
                        represent the same species (maximum intragroup p-distance = 1.08%).

                        Clade C: M. bellicosus
                              Clade C was highly diverged from clades A and B, as noted in previous works [34–38]
                        and included only M. bellicosus (n = 3). The high intraspecific maximum p-distance (8.17%)
                        of M. bellicosus indicated that a division of the sequences into two groups was appropri-
                        ate; therefore, G17 (maximum intragroup p-distance = 0.11%) and G16 likely represent
                        distinct species under the name M. bellicosus. High sequence divergence within speci-
                        mens identified as M. bellicosus has been previously noted and hypothesized to reflect
                        geographic variation or cryptic species diversity [44]. G16 was sampled in the Ivory
                        Coast [37] and G17 in Senegal [34], and most likely belong to a genus other than Macroter-
                        mes. Macrotermes bellicosus was formerly assigned to Bellicositermes [45], and Brandl et al.
                        (2017) have noted that the high genetic divergence between M. bellicosus and the other
                        African Macrotermes was correlated with biological differences: minor workers were the
                        main mound builders in M. bellicosus, whereas this task was performed by major workers
                        in all other species surveyed in the Ethiopian region.
Insects 2021, 12, 518 10 of 16
3.2. Inference of Macrotermes Species in the New Sequences from South Africa
In the light of the current taxonomic challenges, we did not attempt to seek expert
Insects 2021, 12, x assistance for morphological identification of the specimens analysed in this study. Hence, 10 of 16
the following results are exclusively based on the genetic groups inferred from the total
dataset. Our sequences indicated a high diversity of Macrotermes species in South Africa
relative to surveys conducted in other countries (Figure 4). The haphazard sampling
individuals
of 34 individualsat four atsites
fourrecovered four distinct
sites recovered genetic genetic
four distinct groups groups
(G3, G5,(G3,G6 and
G5, G7), two
G6 and
of which
G7), two (G5 and G6)
of which (G5 areand
reported
G6) arehere for the first
reported heretime. Thefirst
for the soldier andThe
time. worker termites
soldier and
fell in two genetic groups (G3 and G7), and specimens from
worker termites fell in two genetic groups (G3 and G7), and specimens from the same the same mound belonged to
the same group, as expected. Alates collected at two sites (Giyani
mound belonged to the same group, as expected. Alates collected at two sites (Giyani and and Thohoyandou) be-
longed to four genetic
Thohoyandou) belonged groups
to four(G3, G5, G6,
genetic G7). (G3,
groups Remarkably,
G5, G6, G7).the three studies the
Remarkably, thatthree
con-
tributed 72% of the sequences in the total dataset yielded only five
studies that contributed 72% of the sequences in the total dataset yielded only five genetic genetic groups, with
limited overlap
groups, with species
with limited overlapnames. A survey
with species of Macrotermes
names. A survey of diversity in thediversity
Macrotermes Tsavo Eco- in
system
the Tsavo inEcosystem
southern Kenya at eight
in southern Kenyadifferent
at eightsavanna
differentand shrubland
savanna habitats recovered
and shrubland habitats
two sympatric
recovered two species
sympatric in aspecies
total ofin141 individuals,
a total which were which
of 141 individuals, tentatively
wereidentified
tentatively as
M. subhyalinus (G1) and M. michaelseni (G4) based on patterns of COI
identified as M. subhyalinus (G1) and M. michaelseni (G4) based on patterns of COI sequence sequence similarity
[39]. Another
similarity [39].survey
Another of Macrotermes colonies at colonies
survey of Macrotermes 11 Kenyan at sites reported
11 Kenyan sitesfour speciesfour
reported that
can be divided
species that can into four genetic
be divided groups
into four genetic withgroups
imperfect
withoverlap
imperfect with species
overlap names:
with M.
species
herus (G8
names: M.andherusG10),
(G8M. andjeanneli
G10), M.(G4,jeanneli
which(G4, includes
which M.includes
michaelseni sequences) sequences)
M. michaelseni and M. fal-
cigerM.
and and M. subhyalinus
falciger (G2 in both
and M. subhyalinus (G2cases)
in both [40]. Interestingly,
cases) the same the
[40]. Interestingly, study
samealso sur-
study
veyed
also one site one
surveyed in thesiteIvory Coast
in the Ivory where
Coastthey wherealsothey
identified M. subhyalinus,
also identified but thesebut
M. subhyalinus, se-
quences fall in a different genetic group (G11). Another example
these sequences fall in a different genetic group (G11). Another example of taxonomic of taxonomic incon-
sistency is M. is
inconsistency bellicosus sampled
M. bellicosus in Senegal
sampled (G16) (G16)
in Senegal [34] and
[34]M. bellicosus
and in the in
M. bellicosus Ivory Coast
the Ivory
(G17) (G17)
Coast [37], which likely likely
[37], which belongbelong
to different species.
to different species.
Figure 4. (A)
Figure 4. (A) Relative
Relative proportions
proportions ofof the
the genetic
genetic groups
groups of African Macrotermes
of African Macrotermes found
found in
in this
this study.
study.(B)
(B) Distribution
Distributionof
of the
the
genetic groups in African countries. The size of the circles is proportional to the number of sequences for each
genetic groups in African countries. The size of the circles is proportional to the number of sequences for each genetic genetic group.
group.
Considering the overall results for the total dataset, i.e., the high level of incongruity
between species names
Considering and genetic
the overall resultsgroups,
for thethe species
total identity
dataset, of high
i.e., the our specimens could not
level of incongruity
be inferred from the sequences (Figure 5). Our G7 sequences could represent
between species names and genetic groups, the species identity of our specimens could M. natalensis,
if
notthebespecimens at thethe
inferred from origin of the sequences
sequences (Figure 5).named
Our G7 M.sequences
natalensis could
(MK591923, AY818067
represent M. na-
and AY818088)
talensis, [35,41,43] were
if the specimens correctly
at the identified
origin of by the authors
the sequences named of M.those studies.
natalensis Similarly,
(MK591923,
AY818067 and AY818088) [35,41,43] were correctly identified by the authors of those stud-
ies. Similarly, our G3 sequences could represent specimens of M. falciger [42]. In contrast,
G5 and G6 are here reported for the first time as they form unique genetic groups that
may represent two closely related species (maximum p-distance G5 + G6 = 2.89%) (Table
S1).Insects 2021, 12, 518 11 of 16
our G3 sequences could represent specimens of M. falciger [42]. In contrast, G5 and G6 are
Insects 2021, 12, x here reported for the first time as they form unique genetic groups that may represent
11 two
of 16
closely related species (maximum p-distance G5 + G6 = 2.89%) (Table S1).
Figure 5. Representative specimens of Macrotermes termites collected in Limpopo, South Africa. G3, G5, G6 and G7 repre-
Figure 5. Representative specimens of Macrotermes termites collected in Limpopo, South Africa. G3, G5, G6 and G7 represent
sent the genetic groups found in the region (specimen code in parenthesis).
the genetic groups found in the region (specimen code in parenthesis).
3.3. Mitochondrial
3.3. Mitochondrial Genetic
Genetic Groups
Groups as as AA Background
Backgroundfor forFuture
FutureStudies
StudiesininAfrican
AfricanMacrotermes
Macrotermes
The high level of incongruency between genetic clustering and species names, and
between The intraspecific
high level ofand incongruency
intragroup maximumbetween genetic clustering
p-distances and aspecies
indicates names,
high level and
of taxo-
between intraspecific and intragroup maximum p-distances
nomic inconsistencies and/or misidentifications in the Macrotermes sequences available indicates a high level of tax-
onomic inconsistencies and/or misidentifications in the
on GenBank. This result is not surprising because the taxonomy and phylogeny of theMacrotermes sequences available
on GenBank.
genus This result
Macrotermes have posedis notsignificant
surprisingchallenges
because the and taxonomy and phylogeny
few characters can be used of for
the
genus Macrotermes
species identification have posedItsignificant
[45,46]. is widely challenges
acknowledged and few thatcharacters
a paucity can be used for
of informative
species identification
morphological [45,46].
characters It is widely
hampers termiteacknowledged
studies, andthat a paucity ofworking
termitologists informative mor-
on West
phological
African characters
species recently hampers
convened termite studies,
to start and termitologists
addressing the problemworking[33]. Theon West were
results Afri-
can speciesas
staggering recently
only 10% convened to startwere
of specimens addressing the problem
unambiguously [33]. The
identified toresults werelevel,
the species stag-
agering as only
proportion 10%
that of specimens
increased to 25%were by theunambiguously
end of the workshop, identified to the
after longspecies level, a
deliberations.
proportion that
Interestingly, M.increased
bellicosus and to 25%M. by the end of
subhyalinus weretheidentified
workshop, after longacross
identically deliberations.
experts,
aInterestingly,
result that was M. bellicosus
only achieved and M.for subhyalinus
five species were
outidentified
of 70. It is identically
possible across
that the experts,
expertsa
result
did notthat was only
analyse achieved
specimens for five
of the species
different out ofgenetic
known 70. It islineages
possibleofthateachtheofexperts
those two did
not analyse
species. specimens
However, the of the different
possibility known
remains thatgenetic lineages of each
the morphological of those
markers two species.
employed by
the expertsthe
However, failed to detectremains
possibility differencesthat that are evident at the
the morphological DNA employed
markers level [36,38,40].
by theAsex- a
result, M. bellicosus and M. subhyalinus were classified as unambiguous
perts failed to detect differences that are evident at the DNA level [36,38,40]. As a result, species and were
not listed for taxonomic
M. bellicosus revision [33].
and M. subhyalinus were classified as unambiguous species and were not
listedWeforpropose
taxonomic thatrevision [33]. of genetic diversity of Macrotermes presented here is
the structure
a useful scaffold that
We propose for framing
the structuresequence data generated
of genetic diversity ofinMacrotermes
future studies. This baseline
presented here is a
structure can befor
useful scaffold reassessed and expanded
framing sequence to accommodate
data generated in futureadditional
studies. Thisgenetic groups
baseline as
struc-
the geographic coverage of Macrotermes diversity and the
ture can be reassessed and expanded to accommodate additional genetic groups as the availability of sequence data
increases.
geographicAcoveragepossibleoffirst-line
Macrotermesapproach for analysing
diversity future COIofdatasets
and the availability sequence in data
African in-
Macrotermes could consist of (1) retrieving the sequence dataset
creases. A possible first-line approach for analysing future COI datasets in African Macro- compiled in this study
(Tables S2 andconsist
termes could S3), (2)ofaligning this dataset
(1) retrieving with the dataset
the sequence new sequences,
compiled (3)inbuilding
this study an NJ tree,
(Tables
(4)
S2 identifying
and S3), (2)the position
aligning ofdataset
this the newwith sequences
the new on sequences,
the NJ tree,(3) which should
building anfall
NJwithin
tree, (4) a
known genetic group or appear as a new group, and (5) using
identifying the position of the new sequences on the NJ tree, which should fall within a maximum p-distances to
reassess the genetic
known genetic group divergence
or appear within groups
as a new that include
group, and (5) new usingsequences.
maximumNJ trees are not
p-distances to
reassess the genetic divergence within groups that include new sequences. NJ trees are
not adequate for recovering deeper nodes but are much less computationally demanding
than ML trees. In our analyses, the three main clades and the 17 genetic groups identified
in the ML tree were correctly recovered in the NJ tree, albeit with low statistical supportInsects 2021, 12, 518 12 of 16
Insects 2021, 12, x 12 of 16
adequate for recovering deeper nodes but are much less computationally demanding than
ML trees. In our analyses, the three main clades and the 17 genetic groups identified in
and a different order of the deeper nodes, as expected (Figure 3B). Thus, this methodolog-
the ML tree were correctly recovered in the NJ tree, albeit with low statistical support and
ical pipeline may be useful in future surveys of Macrotermes, as it will allow for a first
a different order of the deeper nodes, as expected (Figure 3B). Thus, this methodological
overview of the total dataset that can inform subsequent analyses.
pipeline may be useful in future surveys of Macrotermes, as it will allow for a first overview
The use of mitochondrial DNA, particularly the COI gene for phylogenetic recon-
of the total dataset that can inform subsequent analyses.
struction and identification of new species has raised legitimate concerns [47]. However,
The use of mitochondrial DNA, particularly the COI gene for phylogenetic recon-
phylogenetic reconstructions in termites using solely mitochondrial markers or combina-
struction and identification of new species has raised legitimate concerns [47]. However,
tions of mitochondrial
phylogenetic and nuclear
reconstructions markers
in termites have
using beenmitochondrial
solely largely consistent, withor
markers nocombina-
overlaps
of intra- and intergroup sequence variability, and sequence clusters could
tions of mitochondrial and nuclear markers have been largely consistent, with no overlaps be defined un-
ambiguously [44]. Patterns of COI sequence clustering and divergence are
of intra- and intergroup sequence variability, and sequence clusters could be defined un- useful to detect
cryptic species
ambiguously diversity,
[44]. Patternsbut average
of COI p-distance
sequence values
clustering andshould be interpreted
divergence are usefulwith cau-
to detect
tion. For
cryptic example,
species a DNA
diversity, butbarcode
averagelibrary wasvalues
p-distance generated
shouldforbe
Trioza erytreae,
interpreted thecaution.
with psyllid
For example, a DNA barcode library was generated for Trioza erytreae, the psyllid vectorana-
vector for African citrus greening disease, under the assumption that all specimens for
lysed belonged
African to the same
citrus greening species
disease, under[48].
theRe-analyses
assumption ofthatthat
allsequence
specimensdataset
analysedusing a fine-
belonged
scale
to thephylogenetic
same speciesapproach and maximum
[48]. Re-analyses p-distances
of that sequence showed
dataset theapresence
using fine-scaleofphyloge-
four ge-
netically distinct groups likely representing different species that were not
netic approach and maximum p-distances showed the presence of four genetically distinct detected in the
originallikely
groups study,representing
which relieddifferent
on broad-scale phylogenetic
species that were not reconstruction
detected in theand average
original p-
study,
distances
which [49].
relied on broad-scale phylogenetic reconstruction and average p-distances [49].
3.4. Mitochondrial Markers for African Macrotermes
Difficulties in obtaining consistent PCR amplification of COI in termites termites hashas been
been
noted as a reason
reason toto favour
favour COII
COII for
for species
species identification
identification [33].
[33]. However,
However, the the increasing
increasing
availability of complete mitogenomes greatly facilitates the design of optimal primers for
PCR amplification and Sanger sequencing. Utilizing taxon-specific primers can also con-
tribute to
to reducing
reducingthe thegeneration
generationofof non-specific
non-specific PCR products
PCR andand
products nuclear mitochondrial
nuclear mitochon-
sequences (NUMTs)
drial sequences [50]. In
(NUMTs) the In
[50]. beginning of thisof
the beginning study, we designed
this study, primersprimers
we designed specifically
spe-
for M. falciger
cifically for M.(Mfal-F
falciger and Mfal-R),
(Mfal-F which proved
and Mfal-R), which to be robust
proved to beinrobust
the other genetic
in the other groups
genetic
of African
groups Macrotermes
of African present present
Macrotermes in our samples (Figure 6).
in our samples This primer
(Figure 6). Thispair seems
primer pairtoseems
have
potential for use in other termite groups, as we also used it to generate high
to have potential for use in other termite groups, as we also used it to generate high quality quality se-
quences for Hodotermes sp. (data not shown). In hindsight, it would have
sequences for Hodotermes sp. (data not shown). In hindsight, it would have been preferablebeen preferable
to
to utilize
utilize generic
genericprimers
primerswith
withpotential
potentialtotoamplify
amplifya awider
widerrange
range Macrotermes,
of of Macrotermes, including
includ-
the Asian species, such as the theoretical primer pair Macrotermes-F
ing the Asian species, such as the theoretical primer pair Macrotermes-F and Macro- and Macrotermes-R
shown
termes-R in shown
Figure 6. in Figure 6.
Figure 6.
Figure 6. Alignment
Alignmentof ofCOI
COIsequences
sequencesextracted
extractedfrom
from1414complete
complete mitochondrial genomes
mitochondrial genomesof of
Macrotermes available
Macrotermes on
available
GenBank.
on GenBank.TheThe
primers Mfal-F
primers andand
Mfal-F Mfal-R are are
Mfal-R specific for for
specific M. M.
falciger andand
falciger were designed
were for for
designed PCR amplification
PCR andand
amplification se-
quencing ofofthe
sequencing thestandard
standardDNA
DNAbarcoding
barcodingregion
region(709
(709 bp)
bp) in African Macrotermes.
in African Macrotermes. Macrotermes-F
Macrotermes-F and
and Macrotermes-R
Macrotermes-R
represent theoretical universal primers for DNA barcoding (724 bp) of African and Asian Macrotermes.
represent theoretical universal primers for DNA barcoding (724 bp) of African and Asian Macrotermes.
Generating informative
Generating informativedata
dataininaddition
additiontotothe
the commonly
commonly used
used COICOI sequence
sequence maymaybe
be necessary for higher resolution of genetic groups, and it has been suggested that
necessary for higher resolution of genetic groups, and it has been suggested that COII could COII
could
be be an adequate
an adequate candidate.
candidate. This recommendation
This recommendation seems toseems
stem to stem
from thefrom the perception
perception that the
PCR amplification of COII is more successful than that of COI, and that COIIand
that the PCR amplification of COII is more successful than that of COI, that COII
provides the
provides
best the best
taxonomic taxonomic
resolution resolution
[33]. [33]. As
As explained explained
above, above, optimization
optimization of primers thatofperform
primers
that perform robustly across taxa is attainable because of the current availability of many
mitochondrial genomes in practically all insect orders and families. This availability alsoInsects 2021, 12, 518 13 of 16
Insects 2021, 12, x 13 of 16
robustly across taxa is attainable because of the current availability of many mitochondrial
genomes in practically all insect orders and families. This availability also allows for
allows
informed for decisions
informed decisions on the selection
on the selection of informative
of informative markers markers (i.e., mitochondrial
(i.e., mitochondrial regions
regions
with high levels of polymorphism) by comparing sequences among taxa oftaxa
with high levels of polymorphism) by comparing sequences among of inter-
interest [51].
est [51]. Informative
Informative mitochondrial
mitochondrial regions
regions may varymay vary between
between taxa andtaxa and taxonomic
taxonomic levels,
levels, i.e., they
i.e.,
maythey fall may fall on different
on different genes for genes for different
different taxonomictaxonomic
groups.groups. Therefore,
Therefore, it is advis-
it is advisable to
able
perform preliminary assessments of potential target regions in the taxa of interest. interest.
to perform preliminary assessments of potential target regions in the taxa of Protein-
Protein-coding regionsbeshould
coding regions should be preferred
preferred overand
over transfer transfer and RNA
ribosomal ribosomal
genesRNA
and thegenes and
AT-rich
the AT-rich region. This is justifiable because these regions contain repetitive
region. This is justifiable because these regions contain repetitive stretches of nucleotides stretches of
nucleotides
and are prone andtoare prone to sequencing
generating generating sequencing
artifacts thatartifacts
cannot that cannot be
be detected bydetected
translationby
translation
during sequenceduringquality
sequence quality
control. Thecontrol. The of
alignment alignment of all
all available available mitogenome
mitogenome for African
for
andAfrican and Asian Macrotermes
Asian Macrotermes showed thatshowed
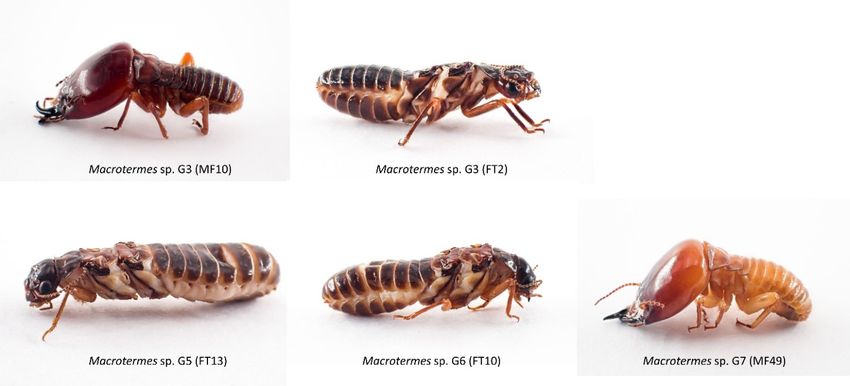
the mostthat the most mitochondrial
informative informative mitochondrial
regions that can re-
gions that can be used to complement standard COI barcoding sequences
be used to complement standard COI barcoding sequences are located in the ND1, ND5, are located in
the ND1, ND5, ND6 and
ND6 and CYTB genes (Figure 7). CYTB genes (Figure 7).
7. Polymorphic
Figure 7.
Figure regions with
Polymorphic regions with potential utility as
potential utility as genetic
genetic markers
markers for
for phylogenetic
phylogenetic andand species
species diversity
diversity studies in
studies in
Macrotermes identified
identified in
in the
the alignments
alignments of
of mitochondrial
mitochondrial genomes
genomesof
of (A)
(A) African
African (n
(n == 5) and (B) African and Asian species
(n = 12).
4. Conclusions
4. Conclusions
The absence
The absence of ofreliable
reliablemorphological
morphologicalcharacters
charactershas hashampered
hamperedtermite
termitestudies
studiesforfor
a
a long time, and it is now apparent that DNA sequence data can provide
long time, and it is now apparent that DNA sequence data can provide much needed clar- much needed
clarifications
ifications [44].[44]. The level
The high highoflevel of taxonomic
taxonomic incongruity
incongruity evidencedevidenced in our
in our study study is
is concern-
concerning
ing and
and casts castson
doubt doubt on the reliability
the reliability of the identification
of the identification of Macrotermes
of Macrotermes speciesspecies
reportedre-
ported in a wide range of research fields including phylogenetics, ecology
in a wide range of research fields including phylogenetics, ecology and food science. Our and food science.
Our results
results confirm
confirm that DNA-based
that DNA-based analyses
analyses shouldshould complement
complement the current
the current methods
methods of
of spe-
species identification in Macrotermes as classic taxonomy and ecological
cies identification in Macrotermes as classic taxonomy and ecological information are in- information are
insufficient
sufficient forfor accuratelycataloguing
accurately cataloguingspecies
speciesdiversity.
diversity.TheThestructure
structureofof genetic
genetic groups
groups ofof
African Macrotermes that we propose was based on the analysis of the
African Macrotermes that we propose was based on the analysis of the most comprehen- most comprehensive
dataset
sive currently
dataset available.
currently ThisThis
available. depiction is likely
depiction incomplete
is likely incompleteandandthethe
identification
identificationof
new
of genetic
new genetic groups
groups andandfurther
furthercryptic
crypticdiversity AfricanMacrotermes
diversityininAfrican Macrotermes may may challenge
challenge
our conclusions. Nonetheless, the low geographic coverage and small amount of data gen-
erated so far provide a good opportunity to establish a background for future studies.Insects 2021, 12, 518 14 of 16
our conclusions. Nonetheless, the low geographic coverage and small amount of data
generated so far provide a good opportunity to establish a background for future studies.
Supplementary Materials: The following are available online at https://www.mdpi.com/article/10
.3390/insects12060518/s1, Table S1: Pairwise distances, Table S2: Sequence list, Table S3: Multiple
sequence alignment of total dataset.
Author Contributions: Conceptualization and supervision, B.v.A.; Methodology and formal analyses,
B.E. and Z.N.; All authors contributed to the writing, reviewing and editing of the manuscript. All
authors have read and agreed to the published version of the manuscript.
Funding: This research was funded by the Foundational Biodiversity Information Programme (FBIP),
grant number 120365. ZN was supported by the FBIP, PhD grant number 128333.
Institutional Review Board Statement: Not applicable.
Data Availability Statement: The sequences generated in this study were deposited on GenBank
(MZ323635 to MZ323668).
Acknowledgments: The authors are grateful to Jack Mahlatji, Martin Boima and Willem Rammala
for assistance with collection of termites.
Conflicts of Interest: The authors declare no conflict of interest.
References
1. De Figueirêdo, R.E.C.R.; Vasconcellos, A.; Policarpo, I.S.; Alves, R.R.N. Edible and medicinal termites: A global overview. J.
Ethnobiol. Ethnomed. 2015, 11, 29. [CrossRef]
2. Kaiser, D.; Lepage, M.; Konaté, S.; Linsenmair, K.E. Ecosystem services of termites (Blattoidea: Termitoidae) in the tra-
ditional soil restoration and cropping system Zaï in northern Burkina Faso (West Africa). Agric. Ecosyst. Environ. 2017,
236, 198–211. [CrossRef]
3. Kambhampati, S.; Eggleton, P. Taxonomy and phylogeny of termites. In Termites: Evolution, Sociality, Symbioses, Ecology, 1st ed.;
Abe, T., Bignell, D.E., Higashi, M., Eds.; Springer International Publishing: New York, NY, USA, 2000; pp. 1–23.
4. Noirot, C.; Darlington, J.P.E.C. Termite nests: Architecture, regulation and defence. In Termites: Evolution, Sociality, Symbioses,
Ecology, 1st ed.; Abe, T., Bignell, D.E., Higashi, M., Eds.; Springer International Publishing: New York, NY, USA, 2000; pp. 121–139.
5. Eggleton, P. An introduction to termites: Biology, taxonomy and functional morphology. In Biology of Termites: A Modern Synthesis,
1st ed.; Bignell, D.E., Roisin, Y., Lo, N., Eds.; Springer International Publishing: New York, NY, USA, 2011; pp. 1–26.
6. Siulapwa, N.; Mwambungu, A.; Lungu, E.; Sichilima, W. Nutritional value of four common edible insects in Zambia. Int. J. Sci.
Res. 2014, 3, 876–884.
7. Séré, A.; Bougma, A.; Ouilly, J.T.; Traoré, M.; Sangaré, H.; Lykke, A.M.; Ouédraogo, A.; Gnankiné, O.; Bassolé, I.H.N. Traditional
knowledge regarding edible insects in Burkina Faso. J. Ethnobiol. Ethnomed. 2018, 14, 59. [CrossRef] [PubMed]
8. Kelemu, S.; Niassy, S.; Torto, B.; Fiaboe, K.; Affognon, H.; Tonnang, H.; Maniania, N.K.; Ekesi, S. African edible insects for food
and feed: Inventory, diversity, commonalities and contribution to food security. J. Insects Food Feed 2015, 1, 103–119. [CrossRef]
9. Anankware, J.P.; Osekre, E.A.; Obeng-Ofori, D.; Khamala, C. Identification and classification of common edible insects in Ghana.
Int. J. Entomol. Res. 2016, 1, 33–39.
10. Ijeomah, H.M.; Oyebade, B.A.; Mazi, E.C. Utilization of edible winged termite (Macrotermes natalensis) in selected communities of
Imo and Rivers States, Nigeria. Int. J. Sci. Eng. Res. 2015, 6, 919–940.
11. Mabossy-Mobouna, G.; Latham, P.; Malaisse, F. Chemical aspects of human consumption of termites in Africa. Geo-Eco-Trop 2020,
1, 131–145.
12. Alamu, T.O.; Amao, O.A.; Nwokedi, I.C.; Oke, A.O.; Lawa, O.I. Diversity and nutritional status of edible insects in Nigeria: A
review. Int. J. Biodivers. Conserv. 2013, 5, 215–222.
13. Sileshi, G.W.; Nyeko, P.; Nkunika, P.O.Y.; Sekematte, B.M.; Akinnifesi, F.K.; Ajayi, O.C. Integrating ethno-ecological and scientific
knowledge of termites for sustainable termite management and human welfare in Africa. Ecol. Soc. 2009, 14, 48. [CrossRef]
14. Fombong, F.T.; Kinyuru, J.N. Termites as Food in Africa. In Termites and Sustainable Management, 1st ed.; Khan, A., Ahmad, W.,
Eds.; Springer International Publishing: New York, NY, USA, 2018; pp. 217–240.
15. Netshifhefhe, S.R.; Kunjeku, E.C.; Duncan, F.D. Human uses and indigenous knowledge of edible termites in Vhembe District,
Limpopo Province, South Africa. South Afr. J. Sci. 2018, 114, 1–10. [CrossRef]
16. Netshifhefhe, S.R. The Effects of Different Land-Use Types on Edible Termite Biodiversity in the Vhembe District Municipality of
Limpopo Province. Ph.D. Thesis, University of the Witwatersrand, Johannesburg, South Africa, 2018.
17. Davies, A.B.; Brodrick, P.G.; Parr, C.L.; Asner, G.P. Resistance of mound-building termites to anthropogenic land-use change.
Environ. Res. Lett. 2020, 15, 094738. [CrossRef]
18. Dzerefos, C.M. Conservation of edible insects in sub-saharan Africa. In Edible Insects in Sustainable Food Systems, 1st ed.; Halloran,
A., Flore, R., Vantomme, P., Roos, N., Eds.; Springer International Publishing: New York, NY, USA, 2018; pp. 181–197.You can also read