OUR STORY Russell Investments Corporate overview - Tom Warburton, CFA Director, Investment Research
←
→
Page content transcription
If your browser does not render page correctly, please read the page content below

OUR STORY
Russell Investments
Corporate overview

                      Tom Warburton, CFA
                      Director, Investment Research

                                                / 1
Who we are

We are a leading
global investment
solutions partner,
dedicated to
improving people’s
financial security.

                      / 2
Agenda

         About us                     4
         How we help                  8
         Our approach to investing   13

                                     / 3
Our story began in 1936

INNOVATION
 IS PART OF   • A pioneer               • Multi-asset            • OCIO               • Personalized
   OUR DNA      in Institutional          funds                  • Goal oriented        retirement
                investment              • Style investing          investing            accounts
                consulting              • Private equity         • Liability driven   • Enhanced portfolio
              • Manager                   & alternatives           investing            implementation
                research                                         • Tax-managed        • Responsible
              • International                                      investing            investing & ESG
                and real estate                                                         integration

 EVOLVING
              Consulting       Investment management         Fiduciary management       Investment solutions
   FOCUS

                                                    Investment platforms
     CORE
                                            Financial advisors
  MARKETS
              Institutional Investors

              Our story began in North America in 1936: Seattle, then New York, then Toronto
  GLOBAL
                                   Expanded to Europe in 1979: London, then Paris & Amsterdam
FOOTPRINT
                                        Expanded to Asia in 1986: Sydney & Tokyo

                                                                                                               / 4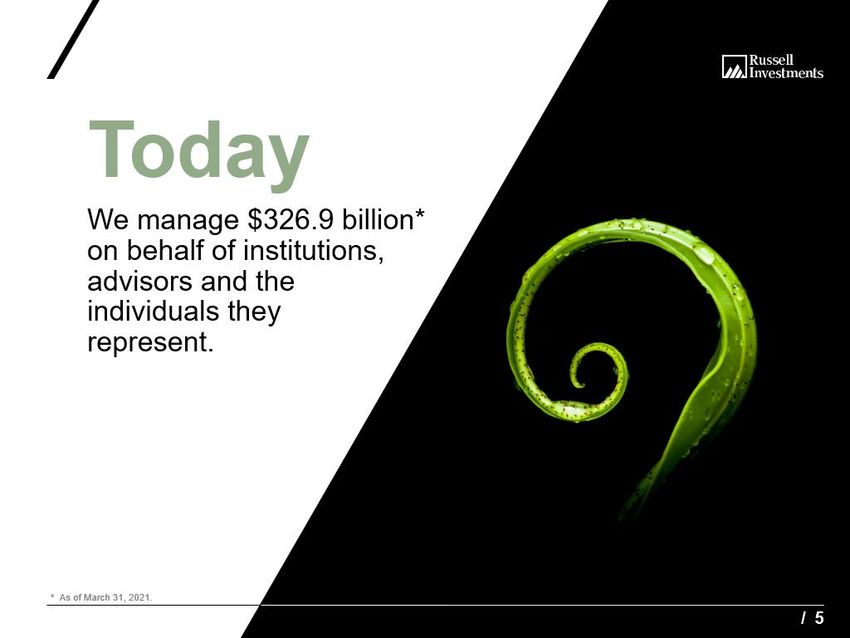
Today
        We manage $284.8 billion*
        on behalf of institutions,
        advisors and the
        individuals they
        represent.

* As of June 30, 2020.

                                     / 5
In 19 offices worldwide
           Including Seattle, Toronto, London, Paris, Amsterdam,
           Sydney, Tokyo, Shanghai and New York.

                                     EUROPE &
                    U.S. AND                              ASIA
                                  THE MIDDLE EAST
                    CANADA                                PACIFIC
                                        London
                   Seattle (HQ)                           Shanghai
                                         Paris
                    Vancouver                             Seoul
                                      Amsterdam
                    San Diego                             Tokyo
                                       Frankfurt
                    Milwaukee                             Sydney
                                         Milan
                      Montreal                            Melbourne
                                         Dubai
                        Toronto                           Auckland
                     New York

February 9, 2021

                                                                      / 6
Who we serve
            Some of the world’s most iconic investors.

Representative client list as of March 2020. Please note that the logos shown above may be registered trademarks of the organizations represented. Clients may contract for a
variety of services from Russell Investments. The identification of the clients listed does not constitute an endorsement or recommendation of Russell Investments’ products or
services by such client. The global representative client list was selected from Russell Investments’ complete client roster and clients have given permission to publish their names
(as of March 2020). Clients listed hold top AUM and/or AUA within their region and were selected based on who would be most relevant to the target audience of this content. Total
assets may or may not represent the total assets consulted on by Russell Investments. Performance-based data was not used in selecting listed clients.

                                                                                                                                                                                        / 7
Who and how we help

Institutional    Investment           Financial
 investors        platforms           advisors

   Holistic       Customized          Funds and
 outsourcing    portfolio solutions   strategies

                                                   / 8
Holistic outsourcing
      A range of holistic solutions particularly suited to investors
      focused on governance and fiduciary oversight.

     RETIREMENT                     NON-PROFIT AND                 INVESTMENT                  FINANCIAL
       PLANS                         HEALTHCARE                     PLATFORMS                  ADVISORS
A total outsourcing program with    A bespoke program designed     Strategic partnerships     An advisor-centric
     innovative personalized          to help maintain and grow     which seek to drive      experience providing
retirement accounts and liability        your important work.     growth in your business    premium investment
        driven modelling.                                            by leveraging our      and business solutions.
                                                                    investment engine.

            Each outsourcing solution is tailored around your unique needs—
            drawing on best-practice strategy, the world’s leading investment
                     managers and specialised industry expertise.

                                                                                                                      / 9
Customized portfolio solutions
  Enhancing the internal capabilities of Corporate
  and Financial Institutions.

   INCREASE                   REDUCE                     LOWER                  IMPROVE
     RETURN                    RISK                      COSTS                  CONTROL
Designed to aggregate     Designed to measure,       Designed to reduce      Designed to increase
   small gains and      monitor, and manage risks     unnecessary and     implementation accuracy,
  minimize losses.       throughout the portfolio.   unrewarded costs.     flexibility and efficiency.

        The power of our global platform, tailored to the unique needs
              and structure of your internal investment team.

                                                                                                         / 10
Customized portfolio solutions platform
STRATEGY AND RESEARCH EXPOSURES IMPLEMENTATION TRANSITION TRADE
OVERSIGHT MANAGEMENT EXECUTION
Governance Equity, fixed income Equity, fixed income, Enhanced portfolio Full project & risk Outsourced trading
& alternative currency & implementation management
Asset allocation manager research alternatives Currency, fixed
Overlays & Interim portfolio income, equity &
Risk oversight Manager due Active and passive derivatives management derivatives trading
diligence
Liability risk Single factor & Exclusions Manager changes Commission
management Manager ESG multi-factor management
rankings Tax optimization Asset allocation
Liquidity Downside protection shifts
management ESG materiality Dynamic asset
scoring ESG & allocation tilting
Improved portfolio Decarbonization
efficiency Capital market Dynamic or passive
forecasts currency hedging
Interest rate hedging
/ 11Funds and strategies
A comprehensive solution set to address investor preferences.
OUTCOME-ORIENTED
Personalized Growth / Alternatives Model Tax-smart Liability Responsible Custom
retirement income Portfolios driven investing mandates
strategies focus
SPECIALIZED SECTOR STRATEGIES
Domestic Global Real Fixed Infrastructure Cash & Commodities Single Multi- And many
equity equity Estate income currency factor factor more…
/ 12Our investment approach Put the world's leading investment managers to work for you. Our approach brings the world’s leading managers and strategies together—in a diversified, adaptive and efficient portfolio—aimed at achieving your goals.
Leading investment managers
           The search for the world’s leading investment
           managers starts with, well, nearly all of them.

            Manager
            products monitored                                                    14,420

            Manager products
                                                                                   8,375
                                                                                                                                                        77%*
            continually researched                                                                                         of our 'hire' rated equity,
                                                                                                                        fixed income and currency
                                                                                                                    manager products outperformed
            Manager products with
            a primary ‘hire’ rating                                                   709                                          their benchmark.

            Manager products used in                                                  236                                                    +1.53%*
            Russell Investments’ Funds
                                                                                                                                by an average of +1.53%

Past performance is no guarantee of future results. Hire ranked managers' performance does not necessarily reflect the actual performance
of any Russell Investments' product. As at March 31, 2021, unless otherwise stated. Includes both traditional and alternative asset classes. Research numbers do not include closed-
end private markets funds or products. For illustrative purposes only.
# Products used in Russell Investments funds do not include alternatives
* Since 2000, an average of 76.95% of our ‘hire’ ranked products have outperformed their benchmark over rolling 5 year periods. With an average performance of 1.53% above
benchmark.
Source: internal Russell Investments analytics dated Data expressed for the 12 months ending 31st March 2021. See appendix slide ‘Leading investment managers’ for full disclosures
and methodology.

                                                                                                                                                                             / 14
Intelligently diversified
The future is uncertain, we focus on making the most of it.
BASED ON SPECIALIST EXPERTISE IN
Asset class ALL 170+
diversification major asset Sub asset
classes classes
Sector 15 220+
diversification Factors investment
styles
Manager
diversification 30+ 14k+
Sectors Manager
products
* As of December 31, 2020. For illustrative purposes only.
/ 15Efficient Implementation
Efficient implementation, without sacrificing insight.
44% Zero 89%
better trading price Duplicate less return
than average trades lost to tax
Externally verified by Elkins McSherry, In a typical diversified fund, a sub- Our tax-managed funds seek to
our inhouse trading capability allows us manager may sell the very same actively minimize tax-loss. Take the
to trade with lower market impact, security another is buying—a material Tax-Managed U.S. Large Cap Fund. It
resulting in a 44% price improvement cost to the fund, with no benefit. Our gave 89% less of its return to taxes,
relative to the peer average1. unique Enhanced Portfolio relative to tax-unaware equivalents,
Implementation approach eliminates over the last 3 years2.
this wastage.
1 Refer to ‘Consistently reduced market impact relative to peers’ in appendix.
2 As measured by Morningstar U.S. Equity Mutual Fund Universes and Morningstar Tax-Cost Ratio. As of June 30, 2020. Morningstar’s Tax-Cost Ratio assumes the highest possible
applicable federal tax rates, including the 3.8% net investment income tax. Many investors are not subject to the highest rates. Additional state and local taxes may apply. Note that tax
drag calculations only apply to taxable accounts. Refer to ‘Tax-managed Equity Funds’ in the appendix for performance.
/ 16Real-time adaptability
When uncertainty strikes, we’re ready.
Monitor Analyze Act
Monitoring investment A robust process The ability to efficiently
markets day and night. to ensure decisions implement trades around
are sound. the clock, through our
internal trading desk.
/ 17Responsible investing
Responsible investing is integrated throughout our approach.
Portfolio management ESG research and metrics
> Manager ranks > Research metrics & universes
> Surveys > Product solutions
> Manager selection > Reporting
Active ownership Culture and process
> Sustainable development goals > Firm-wide ESG integration
> Proxy voting > Sustainable work
practices
> Engagement
> Diversity & inclusion
1 PRI 2020 Assessment Report - Russell Investments. See the ‘Russell Investments and the PRI’ slide in the appendix for further details.
/ 18Responsible investing
Our commitment.
A / A+ 2009 94,598
Rated by the UN PRI Became a UN PRI Proxy votes made at
on our approach1 signatory 9,512 meetings in 20202
1 PRI 2020 Assessment Report - Russell Investments. See the ‘Russell Investments and the PRI’ slide in the appendix for further details. The 2020 PRI assessment report,
transparency report and methodology can be found at russellinvestments.com/ca/about-us/responsible-investing.
2 Source: Russell Investments’ Active ownership: 2020 Proxy and engagement report
/ 19Aligned to investor goals
Our globally consistent approach ensures we remain
focused on helping investors achieve their goals.
Starts with
the investor
What balance of assets What is the best What is the most How should we
offers the highest likelihood way to access efficient way to optimize over time?
of reaching the goals? those assets? implement?
/ 20Recognition
“OCIO of the Year” at the Ranked among the Ranked as a top global A leading consultant
2020 Pension Bridge leading institutional manager of institutional in worldwide assets4.
Institutional Asset investment outsourcing outsourced assets in
Management Awards1. providers globally2. the world3.
1. Source: Pension Bridge “Institutional Asset Management Awards 2020”, September 2020. https://iamanagementawards.awardstage.com/#!/p1
2. Source: Pensions & Investments, “Special report: CIO Outsourcing: OCIO growth assisted by volatile times”, Issue date: June 29, 2020. Available at:
https://www.pionline.com/special-report-cio-outsourcing/ocio-growth-assisted-volatile-times https://researchcenter.pionline.com/v3/rankings/outsourcing-manager/datatable
3. 2021 Source: CIO Magazine. (2021, April). “2021 Outsourced-Chief Investment Officer Survey”. Available at: https://www.ai-cio.com/surveys/2021-outsourced-chief-investment-
officer-survey/
4. Source: Pensions & Investments. (2020, November 30). “Special report: Investment Consultants” and “Investment Consultants Directory: 2020”. Available at:
https://www.pionline.com/assets/datacenter/consultant/pi-2020-investment-consultants-special-report.pdf
Awards do not pertain to any funds or products mentioned in this presentation.
/ 21Thank you.
Any questions?
/ 22Important information
Please remember that all investments carry some level of risk, including the potential loss of principal invested. They do not typically grow at an even rate of return and may
experience negative growth. As with any type of portfolio structuring, attempting to reduce risk and increase return could, at certain times, unintentionally reduce returns.
The investment styles employed by a Fund’s money managers may not be complementary. This concentration may be beneficial or detrimental to a Fund’s performance
depending upon the performance of those securities and the overall economic environment. The multi-manager approach could increase a Fund’s portfolio turnover rates
which may result in higher levels of realized capital gains or losses with respect to a Fund’s portfolio securities, higher brokerage commissions and other transaction costs.
Investments that are allocated across multiple types of securities may be exposed to a variety of risks based on the asset classes, investment styles, market sectors, and
size of companies preferred by the investment managers. Investors should consider how the combined risks impact their total investment portfolio and understand that
different risks can lead to varying financial consequences, including loss of principal. Please see a prospectus for further details.
Commodity futures and forward contract prices are highly volatile. Trading is conducted with low margin deposits which creates the potential for high leverage. Commodity
strategies contain certain risks that prospective investors should evaluate and understand prior to making a decision to invest. Investments in commodities may be affected
by overall market movements, and other factors such as weather, exchange rates, and international economic and political developments. Other risks may include, but are
not limited to; interest rate risk, counter party risk, liquidity risk and leverage risk. Potential investors should have a thorough understanding of these risks prior to making a
decision to invest in these strategies.
Please consult with your financial and tax advisors before investing.
Diversification and strategic asset allocation do not assure a profit or guarantee against loss in declining markets. Please remember that all investments carry some level of
risk.
Copyright © 2021 Russell Investments Group, LLC.
Russell Investments’ ownership is composed of a majority stake held by funds managed by TA Associates with minority stakes held by funds managed by Reverence
Capital Partners, Russell Investments’ management, and Hamilton Lane Incorporated.
Frank Russell Company is the owner of the Russell trademarks contained in this material and all trademark rights related to the Russell trademarks, which the members of
the Russell Investments group of companies are permitted to use under license from Frank Russell Company. The members of the Russell Investments group of companies
are not affiliated in any manner with Frank Russell Company or any entity operating under the “FTSE RUSSELL” brand.
Securities products and services offered through Russell Investments Financial Services, LLC, member FINRA, part of Russell Investments.
First Used: August 2020. Updated May 2021. AI-28412-08-23
/ 23Leading investment managers
Russell Investments Manager Research:
Hire rated performance disclosures
SOURCE:
These slides contain data as provided by internal Russell Investments applications. These applications are populated with data collected from individual managers by third
party data collectors. The data is not thoroughly verified by Russell Investments and although deemed reliable, its accuracy is not guaranteed by Russell Investments or its
affiliates. Most data is gross of advisory fees, but net of fee data is utilized where gross of fee data is not available. Note: In some cases money managers do not provide
data on their products, therefore a reader should be aware that the representations may be misleading; performance of hire lists may be higher or lower than represented.
Hire ranked does not imply that such products have been placed in any of our funds or products.
METHODOLOGY:
Quarterly performance data for hire ranked products is sourced for all approved coverage areas researched by Russell Investments. Each product in our hire lists is
compared to the relevant Russell Investments’ assigned benchmark Index to generate a quarterly geometric excess return. Product level quarterly excess returns are
compounded to calculate rolling 5 year excess returns. Hit rate calculations determine the percentage of hire rank products that have a positive excess return over each 5
year period. The percentage hit rate in all rolling periods is averaged to generate an average hit rate across all periods. Average excess return includes all products that
have 5 year hit rates, positive or negative. For each 5 year rolling period, average excess return is calculated. The results for all 5 year rolling periods are average to
generate an average excess return for all periods.
REPRESENTATION:
No client of Russell Investments has been able to achieve the represented performance due to the fact that the hire lists and universes are comprehensive composites that
cannot be invested in directly. The hire lists and universes in Russell Investments’ research database that are used in this material (presentation) cannot be purchased or
held by any client. These manager products are available for our consulting clients and internal portfolio managers to use in the construction of portfolios for our fund and
separate account clients. Past performance is not indicative of future results.
TIMING:
Data is based on performance of hire ranks from 2000Q1 to 2020Q4. Manager products are included and excluded as our product ranks change over time; not all products
are continually hire ranked over these indicated time periods. The information presented is for illustrative purposes only.
/ 24You can also read