Original Article Identifying juvenile and sub-adult movements to inform recovery strategies for a high value fishery-European bass Dicentrarchus ...
←
→
Page content transcription
If your browser does not render page correctly, please read the page content below
ICES Journal of Marine Science (2021), https://doi.org/10.1093/icesjms/fsab180
Downloaded from https://academic.oup.com/icesjms/advance-article/doi/10.1093/icesjms/fsab180/6370941 by guest on 18 October 2021
Original Article
Identifying juvenile and sub-adult movements to inform
recovery strategies for a high value fishery—European bass
(Dicentrarchus labrax)
Thomas Stamp ,* , David Clarke , Shaun Plenty , Tim Robbins , James E Stewart
,
Elizabeth West , and Emma Sheehan
1
Faculty of Science and Engineering, School of Biological and Marine Sciences, University of Plymouth, Drake Circus, Plymouth, Devon PL4 8AA, UK
2
Department of Biosciences, Swansea University, Singleton Park, Swansea, Sketty SA2 8PP, UK
3
SLR consulting Ltd, Treenwood House, Rowden Lane, Bradford on Avon, BA15 2AU, UK
4
Department for Environment, Food and Rural Affairs (DEFRA), 2nd Floor, Foss House, York YO1 7PX, UK
5
Devon and Severn Inshore Fisheries and Conservation Authority, Brixham Laboratory, Freshwater Quarry, Brixham, Devon TQ5 8BA, UK
∗
Corresponding author: e-mail: Thomas.stamp@plymouth.ac.uk
Stamp, T., Clarke, D., Plenty, S., Robbins, T., Stewart, J. E., West, E., and Sheehan, E. Identifying juvenile and sub-adult movements to inform
recovery strategies for a high value fishery—European bass (Dicentrarchus labrax). – ICES Journal of Marine Science, : –.
Received May ; revised August ; accepted August .
The European bass (Dicentrarchus labrax) support high value commercial and recreational fisheries, however the Spawning Stock Biomass (SSB)
of the northern Atlantic stock (ICES divisions .b–c, .a, and .d–h) has rapidly declined to an unsustainable level. The decline in SSB has been
attributed to high fishing pressure combined with poor recruitment. By tracking juvenile fish their spatial ecology can be identified, and appro-
priate fisheries management policies designed to boost recruitment can be implemented. Using acoustic telemetry sub-adult European bass
(.– cm fork length) were tracked for up to d across three sites in the southwest of the UK. Tagged fish were detected times
(Range: – detections per fish). Linear modelling estimated tagged fish were resident within .–. km of the site where they were
first caught for .–.% of the year. Some fish were however resident throughout summer and winter. Individual fish were also tracked moving
up to km to other coastal sites, % of which returned to their original capture site. Fisheries management should account for the high site
fidelity displayed by juveniles and sub-adults of this species and coastal nursery sites should be considered essential habitat.
Keywords: acoustic telemetry, essential fish habitat, fish residency, good environmental status, movement
fishing fleets (vessels < 12 m length), in countries such as Belgium,
Introduction France, Netherlands, Spain, and the UK accounting for an estimated
The European bass (Dicentrarchus labrax) is a commercially and 13–63% of finfish landings (EUMOFA, 2020; MMO, 2020).
recreationally important finfish native to the Northeast Atlantic In 2010, the International Council for Exploration of the Seas
and Mediterranean Sea (Pickett and Pawson, 1994). The species (ICES) reported a dramatic decline in the Northern stock (ICES di-
is targeted throughout its range, with commercial and recreational visions 4.b–c, 7.a, and 7.d–h), which in 2016 declined below “safe
fisheries worth an estimated £56 million & £172 million per year, biological limits,” a threshold known as Blim . Due to strict con-
respectively (EUMOFA, 2020). The commercial fishery varies be- servation measures, in 2019 the Northern stock increased above
tween countries, however landings are typically highest in the Blim , however relative to historic levels the population remains in
North Sea, English Channel, and Bay of Biscay (EUMOFA, 2020; a highly impoverished state and is still below maximum sustain-
MMO, 2020). In particular, this species is important for inshore able yield thresholds (ICES, 2020). The decline in the Northern
C International Council for the Exploration of the Sea 2021. This is an Open Access article distributed under the terms of the Creative
Commons Attribution License (http://creativecommons.org/licenses/by/4.0/), which permits unrestricted reuse, distribution, and
reproduction in any medium, provided the original work is properly cited.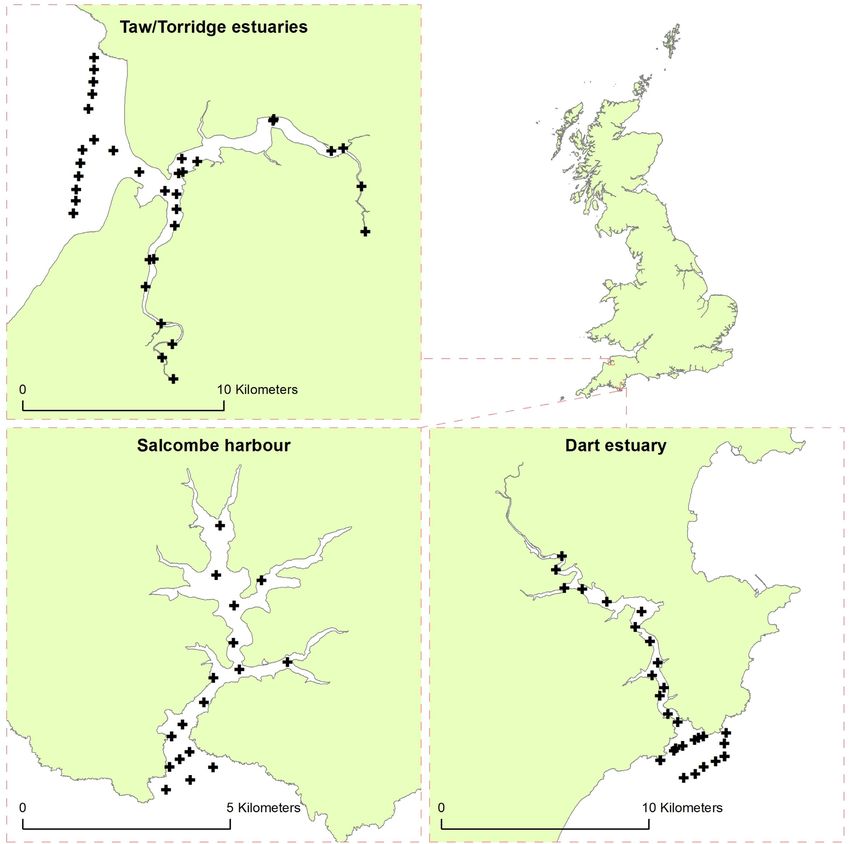
T. Stamp et al.
stock is thought to be the result of several concomitant issues such 69 KHz Innovasea V92X transmitter tag (tag dimensions: 29 ×
as, unsustainable fishing pressure combined with poor recruitment 9 mm, 4.7 g—air weight) was implanted within the peritoneal cavity
(ICES, 2020). However, when these are combined with life his- via a small incision (10–15 mm) made slightly off the mid-ventral
tory characteristics such as slow growth rates (Pickett and Pawson, line between the pelvic fin and anus. Transmitter tags were pro-
1994), recovery timeframes are likely to be protracted. grammed to emit a randomized uniquely-coded ping once every
Limited research has been conducted on juvenile or sub-adult 80–160 s. Following tag implantation, the surgical site was closed
fish (< 42 cm total length) which, relative to sexually mature con- using dissolvable sutures and/or medical grade adhesive. Analgesic
specifics, are thought to spend a high proportion of time within was topically applied to the surgical site (Lidocaine 1% solution di-
Downloaded from https://academic.oup.com/icesjms/advance-article/doi/10.1093/icesjms/fsab180/6370941 by guest on 18 October 2021
coastal and/or estuarine nursery areas (Pawson et al., 1987; Kelley, luted to 1:10 with NaCl saline solution). Fish were then monitored
1988; Pickett and Pawson, 1994; Pickett et al., 2004). Recruitment within large holding tanks (500 l) for a minimum period of 1 h prior
from these nursery habitats are thought to replenish the sexually to release as close to the capture site as logistically possible. All tag-
mature population (Pickett et al., 2004), therefore management or ging procedures were conducted under a UK Home Office license
conservation efforts that are targeted at increasing juvenile fish pop- (P81730EA5) by personal license holders with PILC entitlement.
ulations are likely to be highly beneficial for recovery efforts (Pickett Dispensation was also provided by the relevant regulatory and land
et al., 2004). authorities.
Environmental conditions e.g. water temperature, and anthro-
pogenic stressors e.g. fishing pressure or coastal land-use practices,
Acoustic telemetry receiver array
are thought to highly influence juvenile bass populations (Laffaille
A total of 78 Innovasea VR2W and VR2Tx receivers were deployed
et al., 2000; Green et al., 2012), causing variability in growth rates
(Figure 1 and Table 1) across three designated nursery sites: The
(Ying et al., 2011; Wright et al., 2019), and abundance (Wright et
Dart, Salcombe harbour, and the Taw/Torridge estuaries. Different
al., 2019, 2020). There however remains a lack of understanding
receivers models (VR2W and VR2Tx) were deployed for logistical
on how juvenile bass populations exploit inshore areas, or their
reasons, and no distinction was made between these during data
associated spatial ecology. This evidence could therefore be used to
analysis.
design and then implement fisheries management policies, which
The receiver configurations consisted of a series of detection
maximize recruitment rates from coastal nursery sites (Pickett et
gates that spanned the mouth of each site up to the mean tidal
al., 2004).
limit. Receiver gates had a mean spacing of 0.9 km (± 0.09),
Due to the knowledge gaps in juvenile European bass spatial
0.82 km (± 0.4), and 1.8 km (± 1.6) for the Dart estuary, Sal-
ecology, and the potential benefits to help recovery efforts, this
combe harbour, and the Taw/Torridge estuaries respectively. These
study will use a regional acoustic telemetry network to (1) quan-
were opportunistically attached to existing structures e.g. chan-
tify juvenile and sub-adult European bass site fidelity and residency
nel marker or moorings. Upon successful detection of each tagged
to three coastal sites within the southwest of the UK; (2) test how
fish; the time, date and tag ID was recorded on each receiver.
this varies between sites and with fork length; and (3) estimate how
This was periodically downloaded every 3 months throughout the
far tagged fish disperse along the open coastline from the site where
study.
they were caught, tagged, and released.
Range testing
Material and methods A V9 range test tag, with comparable power output to those im-
Nursery sites planted within the fish, was deployed in a linear array of six receivers
in Salcombe harbour. Receivers were spaced approximately 150 m
European bass were tracked across the Southwest of the UK with
apart (Annex 1, Figure 10) and deployed for a 2 week period at the
a focus on three designated nursery sites (MAFF, 1990): The
start of the study. The number of successful detections at varying
Dart estuary, Salcombe harbour, and the Taw/Torridge estuaries
distances from the range test tag were summarized.
(Figure 1 and Table 1). All sites host a range of intertidal and subti-
dal sediment habitats and tidally-swept rocky reefs. These sites are
also designated as protected as Bass Nursery Areas (MAFF, 1990),
and local fisheries bylaws prohibit commercial netting activities
Data analysis methods
(D&S IFCA, 2018). All data manipulation and statistical analysis was conducted using
R version 3.6.0 (R Core Team, 2019).
Tagging procedure
From June to August 2018, 146 European bass were captured by Overall fish detection trends
rod and line via commercial and recreational anglers using soft
Detection records were presented in an abacus plot with tag ID ar-
lures. A minimum weight threshold of 120 g was used, to ensure
ranged on the y-axis by fork length and binned into size/maturation
the tag weight burden did not exceed 3.5% of the fish weight, which
classes. This enabled visualization of broad scale patterns of pres-
has previously been demonstrated as a suitable for this species
ence/absence within each nursery site and how this varied in re-
(Lefrancois et al., 2001, Bégout Anras et al., 2003). Each fish was
lation to size/maturation. Size/maturation classes were defined by
anaesthetized with an induction dose of 70–100 mg/l MS-222 (Tri-
Pickett and Pawson (1994), based on examination of gonads of
caine methanesulfonate). Fish were then positioned dorsally on a V-
more than 2000 European bass:
shaped cradle, where they were ram-ventilated with a maintenance
anaesthetic dose of 30–40 mg/l MS-222. Induction and mainte-
nance anaesthetic varied on an individual fish basis to ensure the re- r < 29 cm fork length/32 cm total length: Gonads immature—
quired depth of anaesthesia was achieved and maintained. A single Juvenile.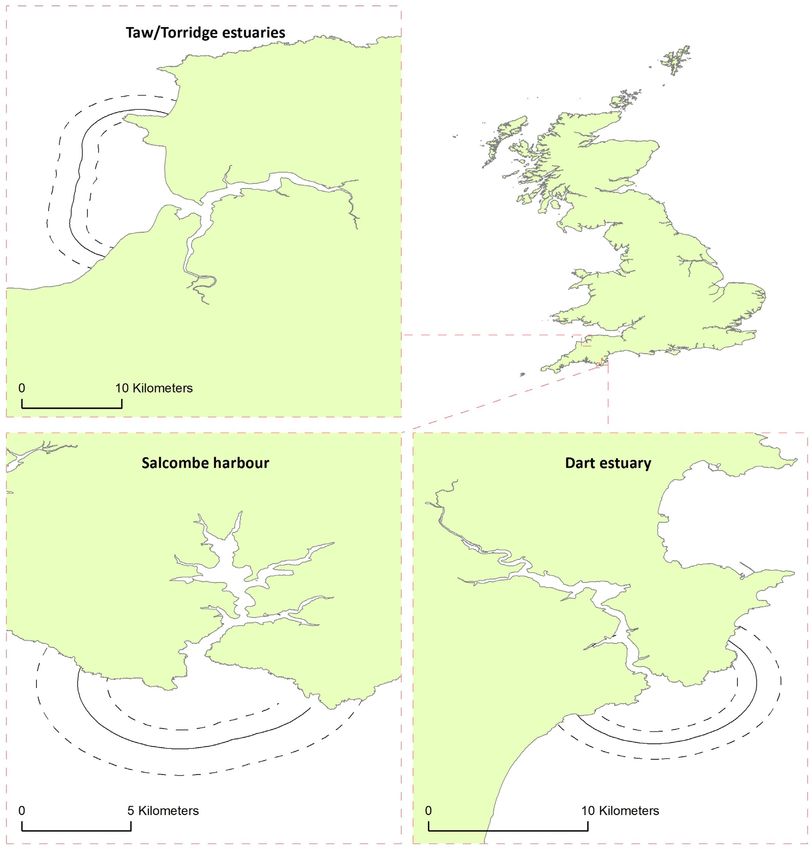
Identifying juvenile and sub-adult movements to inform recovery strategies for European bass (Dicentrarchus labrax)
Downloaded from https://academic.oup.com/icesjms/advance-article/doi/10.1093/icesjms/fsab180/6370941 by guest on 18 October 2021
Figure 1. Acoustic telemetry array within the Taw Torridge estuary (top left), Dart estuary (bottom right), and Salcombe harbour (bottom left).
Black cross hairs represent position of acoustic receiver. Please note map scales differ between sample sites.
Table 1. Physical characteristics of the nursery sites, area and centroid coordinates.
Waterbody Area Number of Deployment
Nursery site type (km2 ) receivers date Latitude Longitude
Dart estuary Estuary . // . −.
Salcombe harbour Ria . // . −.
Taw/Torridge estuaries Estuary . // . −.
The Dart estuary is technically defined as a ria system, however still has significant freshwater input via the river Dart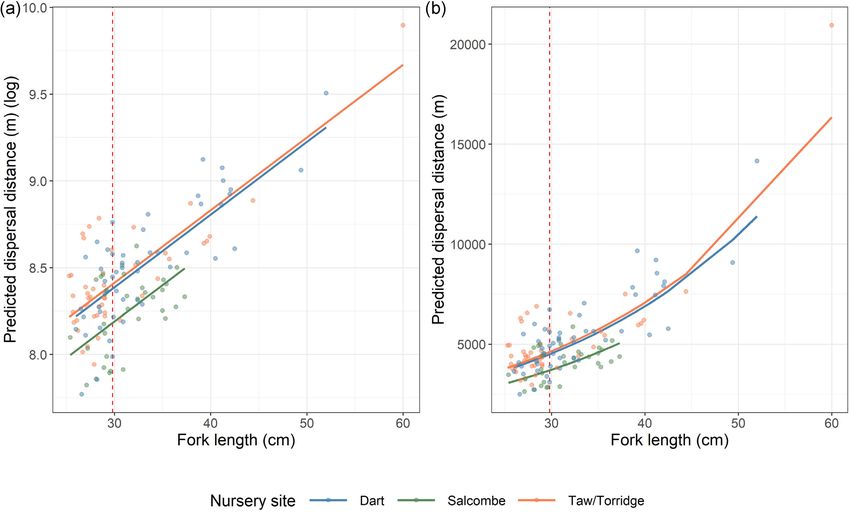
T. Stamp et al.
r 29–39.25 cm fork length/32–42 cm total length: Many males 4) Splitting rules for these different behaviours were derived from
but very few females are found to have maturing gonads during the training regression tree and then applied to the remaining
winter and spring—Adolescent. dataset.
r > 39.25 cm fork length/> 42cm total length: fully mature
or spent gonads during or after spawning period (February–
July)—Adult. Wider movement
The timing and duration of segments identified as “wider move-
ment,” as well as the number of fish, which returned to their host
Downloaded from https://academic.oup.com/icesjms/advance-article/doi/10.1093/icesjms/fsab180/6370941 by guest on 18 October 2021
Characterizing fish residency and movement nursery site following “wider movement” were qualitatively de-
characteristics scribed.
Subsequent data analysis then focussed on periods of “residence”
and “absence” of each tagged fish within their respective nursery Tagging site residence
site. Filters were applied to the acoustic telemetry data to iden- To account for differences in the duration of time each fish was
tify periods of time when fish were within each site, this was re- tracked (referred to as the tracking period) Tagging Site Residence
ferred to as a residence period (Campbell et al., 2012). A res- (TSR) was converted to a percentage of the tracking period for each
idence period began when a fish was detected by any receiver fish. A linear model implemented in “stats” (R Core Team, 2019)
within each nursery site, and terminated when either a fish was was then used to model TSR as a function of fork length, nursery site
detected in a different nursery site or was not detected for a pe- and the interaction between them. Model simplification was con-
riod of 6 h (Doyle et al., 2017). An absence period was defined ducted using Akaike Information Criterion (AIC). Following the
by the termination of a residence period and the start of the pro- rules of parsimony the model with lowest AIC score was selected. If
ceeding residence period i.e. the period of time between residence delta AIC scores from models were ≤ 2 the simplest model and/or
periods. that with the fewest fixed effects was selected (Zuur et al., 2013).
Statistical assumptions were visually assessed via model diagnos-
tic plots. Tukey pairwise comparison implemented within “stats”
Classifying absence period characteristics (R Core Team, 2019) was used to assess at which nursery sites TSR
Absence periods varied widely in their duration, the PELT-TREE significantly differed.
classification method (Madon and Hingrat, 2014) was therefore
used to assign the following broad behaviours to absence period of
different lengths: Estimating dispersal distances
Wider movement (WM): defined by relatively “large” absence When tagged fish that were detected in locations other than the
periods, which could happen as a result of fish conducting spawn- nursery site in which they were tagged, Rate of Movement (ROM)
ing migrations (October–April: Pickett and Pawson, 1994; Doyle et was estimated using the straight-line distance (avoiding land) be-
al., 2017; Pontual et al., 2019) or making wider movements along tween receivers. ROM was not calculated from movement within
the coast (Pickett and Pawson, 1994). each nursery site due to local tidal currents creating extreme
Coastal movement: defined by a high frequency of absence peri- (11 m/s) and variable flows, which could greatly influence ROM
ods with a low duration, during which fish were not thought capa- calculations for individual fish. To make the results from the cur-
ble of travelling far from the nursery site they were caught, tagged, rent study broadly applicable, the average ROM of each individual
and released. The total duration of time fish exhibited coastal move- fish were combined with those derived from O’Neill (2017). O’Neill
ment was combined with the total duration of all residence peri- (2017) also used acoustic telemetry to study European bass move-
ods. This provided an estimate of how long each fish was either ment within coastal sites in southeast Ireland. The receivers within
within or in close proximity to the host nursery site throughout the the current study and those within O’Neill (2017) were deployed in
tracking period. This was defined as Tagging Site Residence (TSR; a similar design, however O’Neill (2017) focussed on sexually ma-
Figure 2). ture fish (>42 cm total length).
This was achieved using the following process: A Generalized Linear Model (GLM) with a Gaussian error struc-
ture and log link function was used to test a relationship between
average individual ROM and fork length (R package “stats”; R Core
1) Time series were constructed for each fish detailing the du- Team, 2019). This linear relationship provided size-specific ROM
ration of each absence period throughout the tracking period estimates for European bass within the open coast from 26.2 to
(Figure 2). 71.4 cm fork length. This relationship was used to calculate the es-
2) Change point detection was used to break each time series timated range fish achieved during individual absence periods (es-
into “segments” of time where there was a significant relative timate range = ROM ∗ duration of absence period).
change in the mean duration of absence periods (R package A Linear Mixed Model (LMM) implemented in “nlme” (Pin-
“changepoint”—Killick and Eckley, 2014). heiro et al., 2019) was then used to model the potential disper-
3) A supervised regression tree was then used to determine split- sal distance of tagged fish during TSR, using their estimated range
ting rules for time series segments to identify when a fish was (m) as a function of fork length, nursery site and the interaction
displaying “wider movement” or “coastal movement.” An ini- between them. Within-individual replication was accounted for
tial supervised “training” regression tree was created using 267 using tag ID as a random intercept term. Temporal autocorrela-
segments from 14 individuals (10% of tagged fish; R package tion was visually detected within the standardized model resid-
“tree”—Ripley, 2019). Each segment within the training regres- uals via an autocorrelation plot (R Core Team, 2019). An au-
sion tree, was then manually assigned to either “Coastal Move- toregressive process order 1 (AR1) was therefore used to account
ment” or “Wider Movement.” for temporal dependency within the model correlation structure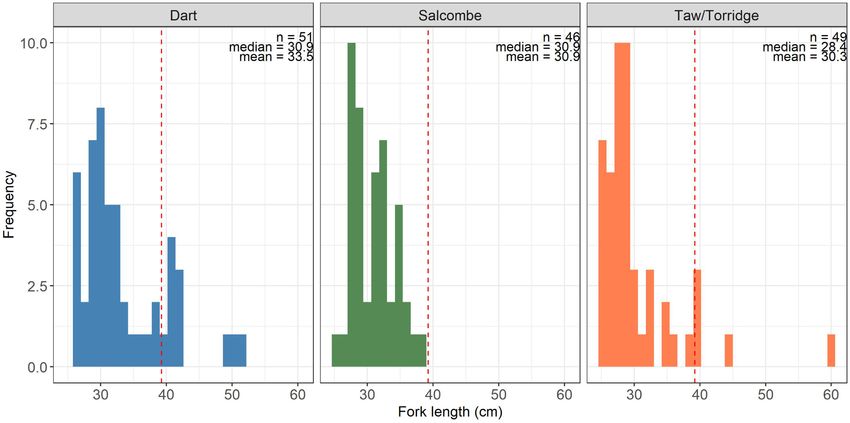
Identifying juvenile and sub-adult movements to inform recovery strategies for European bass (Dicentrarchus labrax)
Downloaded from https://academic.oup.com/icesjms/advance-article/doi/10.1093/icesjms/fsab180/6370941 by guest on 18 October 2021
Figure 2. Absence period time series for tag ID (top) and (bottom), with segments identified as “Tagging Site Residence” (TSR) and
“Wider Movement” (WM). Both fish were tagged within nursery site Salcombe harbour.
(Zuur et al., 2013). AIC-based model simplification was then per- estuary—49). Fish length ranged from 25.2 to 60 cm (fork length),
formed as outlined above to identify the most parsimonious combi- with a mean of 33.5 cm (range: 26–52), 30.9 cm (range: 25.4–38.3),
nation of fixed effects. Statistical assumptions were visually assessed and 30.3 cm (range: 25.2–60) within the Dart estuary, Salcombe
using model diagnostic plots. To demonstrate the spatial extent of harbour, and the Taw/Torridge estuaries, respectively (Figure 3).
predicted fish dispersal from each nursery site, a spatial buffer was A total of 90% (131 individuals) of the fish tagged were less than
created using model coefficients and 95% confidence intervals (95% the Minimum Conversation Reference Size (MCRS; 39.25 cm fork
CI) from the outermost/most seaward positioned receiver and pre- length/42 cm total length), and where therefore assumed to be ju-
sented in a map. venile or sub-adult fish. The remaining 10% (15 individuals) were
above the MCRS, and where assumed to be sexually mature fish.
These fish were retained within the study due to logistical con-
Results straints limiting further fish capture, as well as allowing further
A total of 146 fish were tagged as part of the study (Annex 1, Ta- study into variability of European bass residency with increasing
ble 7; Dart estuary—51; Salcombe harbour—46; and Taw/Torridge fish size/maturation.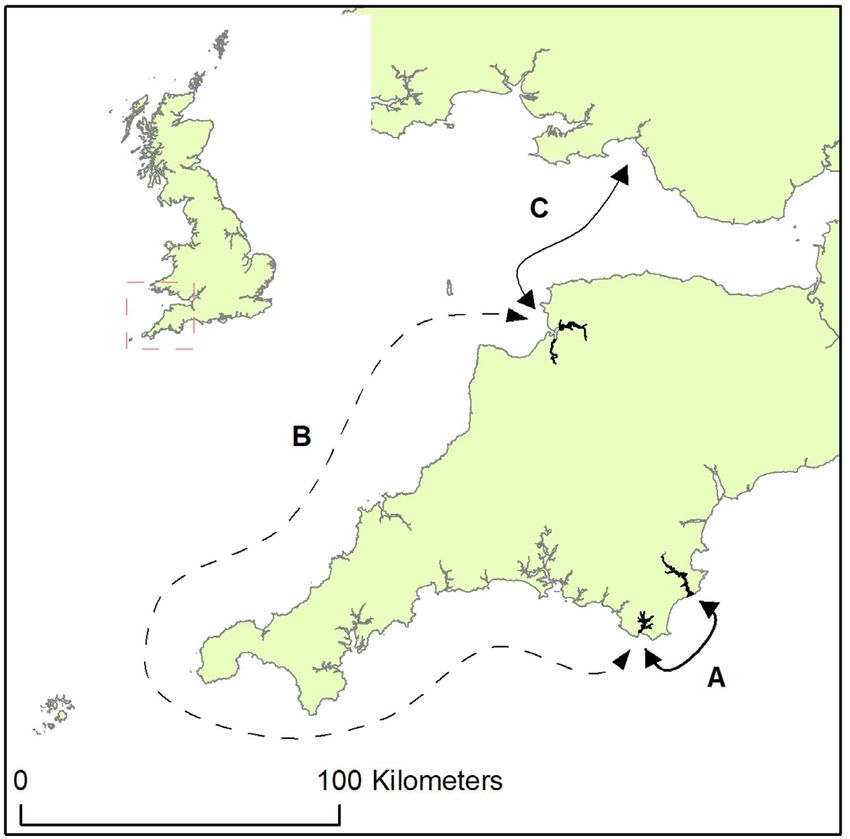
T. Stamp et al.
Downloaded from https://academic.oup.com/icesjms/advance-article/doi/10.1093/icesjms/fsab180/6370941 by guest on 18 October 2021
Figure 3. Size distribution of tagged European bass captured within the Dart estuary, Salcombe harbour, and the Taw/Torridge estuaries.
Dashed line represents minimum conservation reference size: . cm fork length/ cm total length.
No immediate mortality occurred as a result of the tagging pro- From May to June 2019, two fish tagged in the Dart estuary were
cedure, however, 12 fish were not detected >30 d post-tagging, detected in Salcombe harbour and then in the Taw/Torridge estu-
these were removed from further analyses. ary (fork length: 28.2 and 29.8 cm).
Range testing PELT-TREE classification
Range testing confirmed 60% ping detection at a range of 175 m. From the absence period time series, 1 784 unique segments were
The channel width of each tagging site rarely exceeds 300 m, there- identified using the PELT change point detection method. On aver-
fore by positioning receivers at central locations within each chan- age 12.41 (Range: 2–36, IQR: 6.75–16) change points were detected
nel detection of tagged fish was assumed to be reliable. for each tagged fish. The training regression tree had a residual
mean deviance of 0.094 and a misclassification rate of 0.019. The
training regression tree was able to define the following splitting
Overall fish detection trends rules:
Across all receivers, tagged fish were detected 2 724 548 times dur- r The first node of the tree split segments into absence periods
ing the tracking period (Dart estuary—324 d; Salcombe harbour—
identified as “Coastal movement” with mean duration < 5.6 d.
370 d; and Taw/Torridge estuaries—346 d). The mean number of r The second node of the tree split segments into absence periods
detections per fish was 19 053 with a range of 166–106 393. De-
identified as “Wider movement” with a mean duration > 5.6 d.
tection were highest within Salcombe harbour (1 418 688), second
highest within the Dart estuary (848 917), and lowest within the Therefore, during segments of time identified through the PELT
Taw/Torridge estuaries (393 943). algorithm, in which the mean duration of absence period was less
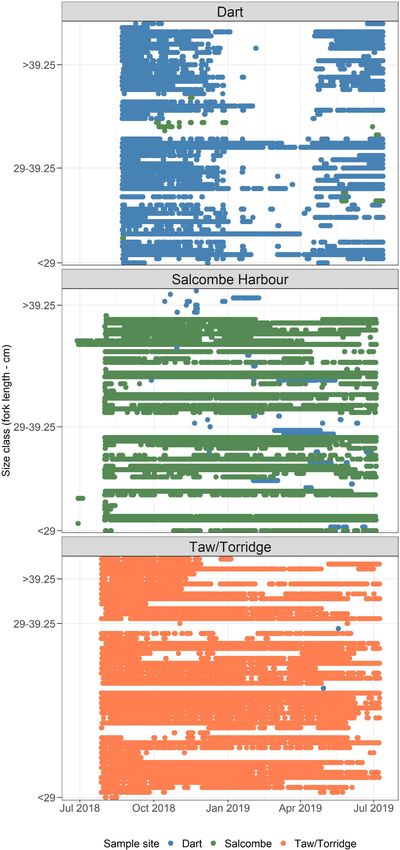
Seasonal differences in tagged fish detections were visually ap- than 5.6 d tagged fish were determined to be displaying “Coastal
parent between nursery sites (Figure 4). Fish tagged within the Dart movement.” During segments when the mean duration of absence
estuary were detected regularly from August 2018 to January 2019. periods exceeded 5.6 d, tagged fish were determined to be display-
From January to April 2019, tagged fish were largely absent from the ing “Wider movement.”
Dart estuary, however nine of the 51 fish tagged in the Dart were
detected in Salcombe harbour during this period (mean length:
31.38 cm, range: 28.2–41.1 cm; Figure 4). From May 2019, tagged Wider movement
fish were detected regularly within the Dart estuary until the end of All tagged fish conducted wider movements, during which absence
the tracking period. Fish tagged in Salcombe harbour were detected periods had an average duration of 23.2 d (Range: 4.7–243.5 d, IQR:
regularly throughout the tracking period (including winter). From 7–20.5).
August 2018 to January 2019 and June to July 2019, eight fish from As a result of the seasonal timing and long duration of some ab-
Salcombe harbour were intermittently detected within the Dart es- sence periods, 60 out of 133 (45%) tagged fish were suspected of
tuary (mean length: 30.73 cm, range: 27.5–33.2 cm). The majority either conducting spawning migrations or moving out of their re-
of fish tagged in the Taw/Torridge estuary were detected regularly, spective nursery site during the winter (Pickett and Pawson, 1994)
however six fish were absent from December 2018 to May 2019. (Dart estuary—34, Salcombe harbour—nine, and Taw/Torridge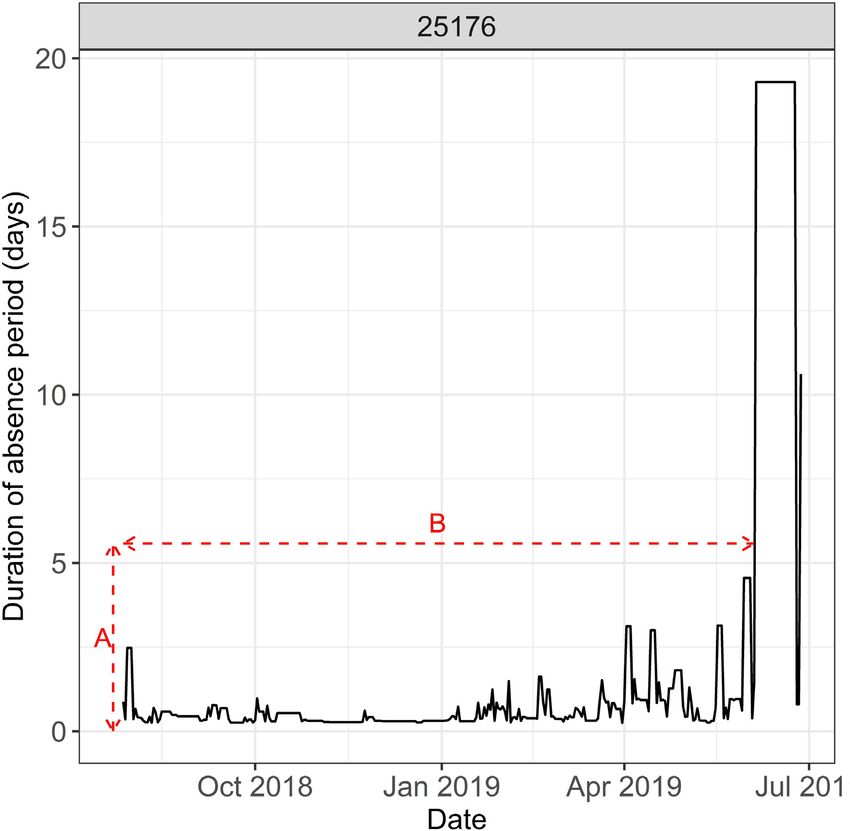
Identifying juvenile and sub-adult movements to inform recovery strategies for European bass (Dicentrarchus labrax)
Downloaded from https://academic.oup.com/icesjms/advance-article/doi/10.1093/icesjms/fsab180/6370941 by guest on 18 October 2021
Figure 4. Abacus plot displaying detections of tagged fish by date/time. Each row represents an individual fish. The nursery site each fish was
tagged within colour coded. Fish arranged in ascending size order. Size classes identified by Pickett and Pawson (): < cm fork length:
Juvenile, –. cm fork length: Adolescent, and > . cm fork length: Adult.
T. Stamp et al.
Downloaded from https://academic.oup.com/icesjms/advance-article/doi/10.1093/icesjms/fsab180/6370941 by guest on 18 October 2021
Figure 5. Example time series of absence periods for tag ID . Arrow A indicates the duration of individual absence periods. Arrow B
indicates the duration of time Tagging Site Residence is sustained.
Table 2. Candidate linear models to test the effect of nursery site and fork length on Tagging Site Residence. Models ranked according to AIC
scores. Selected model emboldened.
Model ID Model notation AIC
MTSR3 Tagging site residence (% of tracking period) ∼ Nursery site 0
MTSR Tagging site residence (% of tracking period) ∼ Nursery site + Fork length .
MTSR Tagging site residence (% of tracking period) ∼ Nursery site ∗ Fork length .
MTSR Tagging site residence (% of tracking period) ∼ Fork length .
MTSR Null model (no fixed effects) .
estuaries—six fish). These fish had an average length of 32.2 cm had an average length of 30.8 cm (Range: 25.5–52 cm, IQR: 27.9–
(Range: 25.3–60 cm, IQR: 28.8–37.4 cm), and these suspected mi- 32.4 cm).
grations had an average duration of 118.2 d (Range 50–296 d, IQR:
79.8–142 d). A total of 25% of the fish departed by 31/12/2018,
the median departure date was 14/02/2019, and 75% had de- Tagging site residence
parted by: 26/03/2019. 49 out of the 60 (81%) fish that made these Tagging Site Residence (TSR) is a combination of: (1) the duration
suspected migrations returned to the original site in which they of time fish were within each nursery site (defined as “residence
were tagged. 25% of these fish had returned by 15/05/2019, the periods”), and (2) the duration of time fish made relatively short
median return date was 25/06/2019, and 75% had returned by: absence periods from each nursery site (defined as “coastal move-
13/08/2019. ment”). This provided an estimate of how long each fish was either
The remaining 73 fish (55%; Dart estuary—12, Salcombe within or in close proximity to each nursery site.
harbour—27, and Taw/Torridge estuary—34), were detected in A total of 18 526 residence periods were detected, with an av-
their respective nursery sites throughout the winter (representa- erage of 139.3 residence periods per fish (Range: 3–444, IQR: 57–
tive example demonstrated in Figure 2; tag ID 25131). These fish 208), which had an average duration of 0.6 d (Range: 0.1–2, IQR:Identifying juvenile and sub-adult movements to inform recovery strategies for European bass (Dicentrarchus labrax)
Downloaded from https://academic.oup.com/icesjms/advance-article/doi/10.1093/icesjms/fsab180/6370941 by guest on 18 October 2021
Figure 6. Predicted Tagging Site Residence (± % CI) of European bass from nursery sites: Dart estuary, Salcombe harbour, and Taw/Torridge
estuaries.
Table 3. Linear model coefficients for MTSR , testing differences in TSR between nursery sites.
Coefficient Estimate Std. Error T value p
Nursery site Intercept (Dart estuary) . . . < .
Salcombe harbour . . . < .
Taw/Torridge estuary . . . < .
0.1–0.5). Once the splitting rules derived from the PELT tree clas- the Taw/Torridge estuaries (Tukey test: p = 0.46) in which TSR was
sification method were applied to the data, 129 out of 133 tagged 68.52% (Range: 0.19–99.6%, IQR: 42.29–94.76) and 75.49% (Range:
fish were identified as exhibiting absence periods which were de- 0.02–99.1%, IQR: 63.92–94.6%; Figure 6 and Table 3).
fined as “coastal movement” (Dart estuary: 50; Salcombe harbour:
35; and Taw/Torridge estuaries: 46). During segments of time when
fish displayed “coastal movement” individual absence periods had Calculating coastal ROM
an average duration of 0.9 d (Range: 0.3–6.2 d, IQR: 0.4–1 d), and During periods of “Wider movement,” 35 fish were detected in lo-
this behaviour was sustained for an average period of 36.6 d (Range: cations outside of the nursery site in which they were tagged (78 837
0–337 d, IQR: 5–26 d; Figure 5). detections). A total of 24 fish tagged within the Dart estuary were
Linear modelling suggested that TSR varied between nursery detected within Salcombe harbour, and eight fish tagged in Sal-
sites, however fork length was not a significant predictor (Table 2; combe harbour were detected in the Dart estuary (24.9 km straight-
Linear model—Adj.R2 : 0.23, F2,130 : 20.45, p < 0.001). line distance). Three fish tagged in the Taw/Torridge estuary were
TSR within the Dart estuary was 42.89% and was signifi- detected by a receiver array within Swansea Bay and the Gower
cantly lower than in the Taw/Torridge estuaries and Salcombe har- peninsula, Wales, operated by Swansea University (66.1–72.9 km
bour (Range: 10.22–98.16%, IQR: 26.11–56.91; Tukey test: Dart– straight-line distance). In total, two fish tagged in the Dart estuary
Salcombe, p = ≤ 0.001; Tukey test Taw/Torridge–Dart, p = ≤ were detected in the Taw/Torridge estuary via Salcombe harbour
0.001). No difference was detected between Salcombe harbour and (312 km straight-line distance; Figure 7). Due to the high distance T. Stamp et al.
Dart–Salcombe, p = 0.002; Dart–Taw/Torridge, p = 0.924; and
Salcombe–Taw/Torridge, p ≤ 0.001; Table 6 and Figure 8).
Following a back calculation, random effect estimates from
Mdisp2 (Figure 8B) indicate that across the length range included
within the study (25.3–60 cm fork length) dispersal distance varied
from 2.4 to 20.1 km. When using the median fish length (29.8 cm
fork length), fish dispersed to an estimated distance of 4.5 km (±
2.4 km 95% CI) from the Dart estuary, 3.7 km (± 2.9 km 95% CI)
Downloaded from https://academic.oup.com/icesjms/advance-article/doi/10.1093/icesjms/fsab180/6370941 by guest on 18 October 2021
from Salcombe harbour, and 4.6 km (± 3.5 km 95% CI) from the
Taw/Torridge estuaries (Figures 8 and 9).
Discussion
The high temporal and spatial resolution of the acoustic teleme-
try data presented here demonstrates the complexity of juvenile
and sub-adult European bass movements within coastal environ-
ments. Tagged fish displayed high residency to the nursery site in
which they were fist tagged and made repeated short-range move-
ments within and adjacent to site boundaries. Fish were however
also recorded making long-range movements, which ranged from
24.9 to 312 km.
Figure 7. Coastal fish movement. Arrow A: Dart estuary–Salcombe
harbour (length = . km), Arrow B: Salcombe
harbour–Taw/Torridge estuaries (length = km), and Arrow C:
Taw/Torridge estuaries–Swansea bay/Gower Peninsula Essential fish habitat
(length = .–. km). Solid arrows indicate movement included In the current study, a range of fish sizes were tagged (25.2–60 cm
in coastal ROM calculations, arrow B not included. fork length), which includes; juveniles, sub-adult, and sexually ma-
ture fish (Pickett and Pawson, 1994). Across this size range, length
did not predict the cumulative duration of time fish spent within or
Table 4. Table of coefficients for generalized linear model (Fam- in close proximity to the nursery sites; this suggests that estuaries
ily = Gaussian, link = log): ROM ∼ Fork length. and shallow embayments (plus the associated habitats e.g. saltmarsh
or rocky reefs) are important for European bass across a range of dif-
Coefficients Estimate Standard error T value p
ferent life stages. As evidenced with similar and sympatric species
Intercept − . . − . < . (e.g. Striped bass Morone saxatilis; Ng et al., 2007; Baker et al., 2016
Fork length . . . < . and Thinlip grey mullet Chelon ramada; Laffaille et al., 2002), whilst
occupying coastal sites resident European bass populations may be
reliant on the local availability of habitats and prey species for: nu-
trition, growth, and ultimately survival (Pickett and Pawson, 1994;
between Salcombe harbour and the Taw/Torridge estuaries, and the Cambie et al., 2016; Doyle et al., 2017).
likelihood of meandering or erratic movement trajectories creating Furthermore, 55% (73 out of 133) of tagged fish within the cur-
inaccurate ROM estimations, these movements were not included rent study were not absent from their respective nursery site for
within coastal ROM calculations. any period greater than 6.2 d throughout winter. During winter,
When combined with individual ROM estimates within O’Neil European bass are thought to be mostly absent from coastal sites
(2017), a significant positive relationship was found between coastal in the UK (Pickett and Pawson, 1994), when they either conduct
ROM and fork length (Table 4). spawning migrations or seek thermal refuge in deeper offshore wa-
ter (Pickett and Pawson, 1994). The overwintering fish detected in
this study ranged in fork length from 25.5 to 60 cm, and therefore
Estimating dispersal distances from nursery sites represent both overwintering sub-adults and sexually mature fish,
To meet the assumptions of normality and homogeneity of vari- which may have skipped a spawning migration (Pickett and Paw-
ance a log transformation was applied to the estimated range val- son, 1994; O’Neill, 2017). Sympatric taxa such as Grey Mullet (Ch-
ues. Mdisp2 was the best fitting model for predicting dispersal dis- elon spp.) or Gilthead bream (Sparus aurata) are similarly thought
tance, this included nursery site and fork length with no interaction to occupy coastal sites during the summer/autumn however dur-
term (Table 5). Inclusion of the AR(1) correlation structure reduced ing winter are largely absent (Laffaille et al., 2002; Maes et al., 2007;
Mdisp2 AIC scores by 426.5, highlighting the model fit was greatly Mercier et al., 2012). The evidence reported here, may therefore be
improved by accounting for the temporal dependency structure of due to a prior gap in understanding European bass (or wider fish
the data. Furthermore no significant temporal autocorrelation was behaviour—Marsden et al., 2021) during winter, or an indication
visually apparent within ACF plots following inclusion of the AR(1) of behavioural plasticity as a response to environmental and/or site
correlation structure. specific conditions. This data however does highlight that not all
Mdisp2 predicted that dispersal distance increased log linearly European bass migrate or move offshore in the winter, and that es-
with fork length and significantly differed between the Dart tuaries, embayments and coastal waters can remain highly utilized
and Taw/Torridge estuaries, and, Salcombe harbour (Tukey test: throughout the year.Identifying juvenile and sub-adult movements to inform recovery strategies for European bass (Dicentrarchus labrax)
Table 5. Candidate linear mixed effect models to test the effect of nursery site and fork length on European bass dispersal distance. Models
ranked according to delta AIC scores. Selected model emboldened.
Model ID Model notation AIC
Mdisp2 Dispersal distance ∼ Nurserysite + Fork length 0
Mdisp Dispersal distance ∼ Fork length .
Mdisp Dispersal distance ∼ nursery site ∗ Fork length .
Mdisp Dispersal distance ∼ nursery site .
Downloaded from https://academic.oup.com/icesjms/advance-article/doi/10.1093/icesjms/fsab180/6370941 by guest on 18 October 2021
Mdisp Null model (no fixed effects) .
Table 6. Fixed and random effects of the linear mixed effect model estimating European bass dispersal distance in relation to nursery site and
fork length.
95% 95%
Fixed effects Estimate Std. Error CI Lower CI upper T value p value
Nursery site: Dart (Intercept) . . . . . < .
Nursery site: Salcombe − . . − . − . − . < .
Nursery site: Taw/Torridge . . − . . . .
Fork length . . . . . < .
Random effects
Tag ID .
Residual .
Figure 8. (A) Log transformed predicted European bass dispersal distance: Dart estuary, Salcombe harbour, and Taw/Torridge estuaries during
Tagging Site Residence. (B) Back transformed predicted European bass dispersal distance. Colour coded lines represent model fits for each
nursery site, points represent random effect coefficients (i.e. individual fish). Red dashed line indicates median fish length included within the
study (. cm fork length).
Estuaries and the habitats they encompass are however highly in- declines in local fish populations (e.g. 66% loss—MClusky et al.,
fluenced by anthropogenic activities (Laffaille et al., 2001; Kennish, 1992 and 23% loss—Rochette et al., 2010). This is particularly prob-
2002; Lotze et al., 2006; Vasconcelos et al., 2007). The loss or degra- lematic as it is estimated that 85% of coastline across Europe is at
dation of estuarine habitats can therefore result in a substantial high or moderate risk for unsustainable coastal construction and T. Stamp et al.
Downloaded from https://academic.oup.com/icesjms/advance-article/doi/10.1093/icesjms/fsab180/6370941 by guest on 18 October 2021
Figure 9. Estimated dispersal distance of European bass from nursery sites during periods of “Tagging site residence.” Estimate based on median
fish size tagged: . cm fork length. Solid line represents exponent of model intercept and dashed lines represent exponent of % CI. Please
refer to Table for model outputs and coefficients.
development (Seitz et al., 2014). Therefore, if increasing recruit- identified as “Essential” should be included within Marine Spatial
ment and survivorship within coastal sites is a recovery objective Planning and/or protected through legislative instruments within
for Northern European bass stock, the merits of further human ac- the Reformed Common Fisheries Policy or the UK Fisheries Bill e.g.
tivities which are likely to negatively impact estuarine or coastal Fish Stock Recovery areas (Cambiè et al., 2016; Doyle et al., 2017;
environments e.g. coastal land development (Laffaille et al., 2000), Dambrine et al., 2020).
should be considered in relation to the associated impact on fish
populations.
Due to the high residency reported here, the authors suggest that Local movements
estuarine and coastal nursery sites should be defined as “Essen- Within the current study juvenile and sub-adult fish were only pre-
tial Fish Habitat” as listed in the Magnuson–Stevens Fishery Act dicted to move within an area of 2.4–20.1 km, from the coastal
(2007). Within the context of the highly impoverished condition nursery site they were tagged, for a 42.9–75.5% of the year. This be-
of the Northern European bass stock, habitats which have been haviour may introduce spatial structuring, in which local processesIdentifying juvenile and sub-adult movements to inform recovery strategies for European bass (Dicentrarchus labrax)
may affect local juvenile/sub-adult survival rates. Site-specific As part of the UK Government (UK Fisheries Act, 2020) and
environmental conditions and local human activities could result European Commission’s (Marine Strategy Framework Directive)
in variability in local population abundances (Laffaille et al., 2000; target for Good Environmental Status (GES), populations of all
Ciannelli et al., 2013; Neat et al., 2014), which if not researched fur- commercially exploited fish should be within “safe biological lim-
ther could lead to an inaccurate understanding of local fish popula- its.” The results presented here suggest that, recognition of the habi-
tion stressors (Ying et al., 2011). Furthermore, European bass settle- tat requirements for, and the movement characteristics of, Euro-
ment within coastal nursery sites may follow stochastic processes, pean bass would contribute towards GES as well as support the
which when combined with the slow growth rate of this species recovery of one of Europe’s most valuable commercial and recre-
Downloaded from https://academic.oup.com/icesjms/advance-article/doi/10.1093/icesjms/fsab180/6370941 by guest on 18 October 2021
e.g. sexually maturity achieved in 4–7 years, could result in a pro- ational fisheries.
tracted recovery (several years) if local European bass populations
become depleted (Pickett and Pawson, 1994; Pickett et al., 2004).
Supplementary data
If not reflected in management actions, this could complicate Eu-
ropean bass recovery efforts and have substantial impacts on the Supplementary material is available at the ICESJMS online version
resilience of the wider population (Pickett et al., 2004; Ciannelli et of the manuscript.
al., 2013; Neat et al., 2014).
Some individuals were however also detected making long-range Data availability statement
movements to other coastal sites e.g. between Dart estuary and The data underlying this article will be shared on reasonable request
South Wales (312 km). This may be evidence of adolescent fish seek- to the corresponding author.
ing feeding sites, which they will adopt as sexually mature fish and
could be a behavioural adaptation to allow greater dispersal along
the coastline (Pickett and Pawson, 1994). The significant differences Acknowledgements
in the duration of time fish displayed residency to nursery sites The authors wish to acknowledge the Devon and Severn Inshore
reported here, however also suggests that local conditions rather Fisheries and Conservation Authority, Dart Harbour and Naviga-
than size/maturation are important drivers for local fish behaviour tion Authority, Salcombe harbour authority, Sea Jay Live Marine
(Pickett and Pawson, 1994). This has similarly been evidenced Supplies, North Devon Fishermen’s Association, the Bass Angling
within other estuarine fish species e.g. Spotted grunter (Pomadasys Sportsfishing Society (B.A.S.S), Fishtrack limited, and individuals
commersonnii—Childs et al., 2008), the movements of which are from the commercial and recreational fishing communities for the
correlated with local fluctuations in salinity, water temperature and vital financial and logistical support they provided. Without assis-
turbidity. Furthermore, 81% of the fish that made long-range move- tance from these organizations, survey work would not have been
ments returned to the same location after 3–4 months. These results possible.
therefore suggest that despite some fish making long-range move-
ments, European bass display high site fidelity at a juvenile/sub References
adult stage and that local conditions may be important drivers for Baker, H. K., Nelson, J. A., and Leslie, H. M. 2016. Quantifying striped
dispersal into the wider coastline. bass (Morone saxatilis) dependence on saltmarsh-derived produc-
tivity using stable isotope analysis. Estuaries and Coasts, 39: 1537–
1542.
Bégout Anras, M. L., Covés, D., Dutto, G., Laffargue, P., and Lagardère,
Spatial management F. 2003. Tagging juvenile seabass and sole with telemetry transmit-
All the nursery sites included within the current study are desig- ters: medium-term effects on growth. ICES Journal of Marine Sci-
nated as Bass Nursery Areas (BNA), this is a form of spatial man- ence, 60: 1328–1334.
Cambiè, G., Kaiser, M. J., Marriott, A. L., Fox, J., Lambert, G., Hiddink,
agement in which targeted commercial fishing for European bass
J. G., Overy, T. et al. 2016. Stable isotope signatures reveal small-
is seasonally prohibited within site boundaries. While the effective- scale spatial separation in populations of European sea bass. Marine
ness of BNA has yet to be formally assessed, Pickett et al. (2004) Ecology Progress Series, 546: 213–223.
argued they likely increase local recruitment to commercial and Campbell, H. A., Watts, M. E., Dwyer, R. G., and Franklin, C. E. 2012.
recreational fisheries. Further work should be conducted to assess V-Track: software for analysing and visualising animal movement
the benefits of spatial management for this species. However, the re- from acoustic telemetry detections. Marine and Freshwater Re-
stricted movement patterns identified within the current study and search, 63: 815–820.
Childs, A.-R., Cowley, P., Næsje, T., Booth, A., Potts, W., Thorstad, E.,
those reported within the wider literature (Green et al., 2012; Cam- and Økland, F. 2008. Do environmental factors influence the move-
biè et al., 2016; Doyle et al., 2017; Pontual et al., 2019) support the ment of estuarine fish? A case study using acoustic telemetry. Estu-
efficacy of spatial management strategies such as BNAs. arine, Coastal and Shelf Science 78: 227–236.
Ciannelli, L., Fisher, J. A., Skern-Mauritzen, M., Hunsicker, M. E., Hi-
dalgo, M., Frank, K. T., and Bailey, K. M. 2013. Theory, conse-
quences and evidence of eroding population spatial structure in har-
Conclusions vested marine fishes: a review. Marine Ecology Progress Series, 480:
This study is the first to document juvenile and sub-adult Euro- 227–243.
pean bass movement characteristics at a high temporal and spa- Dambrine, C., Woillez, M., Huret, M., and De Pontual, H. 2020. Charac-
terising essential fish habitat using spatio-temporal analysis of fish-
tial resolution. The sites selected within the current study varied
ery data: a case study of the European seabass spawning areas. Fish-
in spatial extent (Dart: 8.32 km2 , Salcombe harbour: 6.34 km2 , and eries oceanography, 30: 413–428. doi: 10.1111/fog.12527.
Taw/Torridge estuaries: 14.6 km2 ), but are typical examples of estu- Doyle, T. K., Haberlin, D., Clohessy, J., Bennison, A., and Jessopp, M.
aries and ria systems across Europe. The results presented are there- 2017. Localised residency and inter-annual fidelity to coastal for-
fore likely to be representative of juvenile/sub adult European bass aging areas may place sea bass at risk to local depletion. Scientific
behaviour more broadly across Northern Europe. reports, 7: 45841. T. Stamp et al.
D&S IFCA. 2018. Netting Permit Byelaw D&S IFCA Authority. url: Ne MMO. 2020. UK Sea fishing Statistics. Available at: https://www.gov.uk
tting Permit Byelaw /government/collections/uk-sea-fisheries-annual-statistics (Last
European Market Observatory for Fisheries and Aquaculture Prod- accessed date: 09/09/2021).
ucts (EUMOFA). 2020. Commercial and recreational fisheries for Neat, F. C., Bendall, V., Berx, B., Wright, P. J. Ó., Cuaig, M., Townhill,
wild seabass in the Atlantic, Economic and market study. doi: B., Schön, P. J. et al. 2014. Movement of Atlantic cod around the
10.2771/652840. url: EUMOFA Publications Office of the European British Isles: implications for finer scale stock management. Journal
Union, Luxembourg. of Applied Ecology, 51: 1564–1574.
Green, B. C., Smith, D. J., Grey, J., and Underwood, G. J. 2012. High Ng, C. L., Able, K. W., and Grothues, T. M. 2007. Habitat use, site fi-
site fidelity and low site connectivity in temperate salt marsh fish delity, and movement of adult striped bass in a southern New Jer-
Downloaded from https://academic.oup.com/icesjms/advance-article/doi/10.1093/icesjms/fsab180/6370941 by guest on 18 October 2021
populations: a stable isotope approach. Oecologia, 168: 245–255. sey estuary based on mobile acoustic telemetry. Transactions of the
American Fisheries Society, 136: 1344–1355.
ICES. 2020. Sea bass (Dicentrarchus labrax) in divisions 4.b–
O’Neill, R. 2017. The Distribution of the European Sea Bass, Dicen-
c, 7.a, and 7.d–h (central and southern North Sea, Irish
trarchus labrax, in Irish waters. University College Cork. University
Sea, English Channel, Bristol Channel, and Celtic Sea). doi:
College Cork, Ireland.
doi.org/10.17895/ices.advice.5916 In Report of the ICES Advisory
Pawson, M., Pickett, G., and Kelley, D. 1987. The distribution and mi-
Committee
grations of bass, Dicentrarchus labrax L., in waters around England
Kelley, D. 1988. The importance of estuaries for sea-bass, Dicentrarchus
and Wales as shown by tagging. Journal of the Marine Biological
labrax (L.). Journal of Fish Biology, 33: 25–33.
Association of the United Kingdom, 67: 183–217.
Kennish, M. J. 2002. Environmental threats and environmental future
Pickett, G., Kelley, D., and Pawson, M. 2004. The patterns of recruitment
of estuaries. Environmental Conservation, 29: 78–107.
of sea bass, Dicentrarchus labrax L. from nursery areas in England
Killick, R., and Eckley, I. 2014. changepoint: an R package for change-
and Wales and implications for fisheries management. Fisheries Re-
point analysis. Journal of Statistical Software, 58: 1–19.
search, 68: 329–342.
Laffaille, P., Feunteun, E., Lefebvre, C., Radureau, A., Sagan, G., and
Pickett, G., and Pawson, M. 1994. Sea Bass: Biology, Exploitation and
Lefeuvre, J.-C. 2002. Can thin-lipped mullet directly exploit the pri-
Conservation, Chapman & Hall, United Kingdom.
mary and detritic production of European macrotidal salt marshes?
Pinheiro, J., Bates, D., DebRoy, S., Sarkar, D., and Team, R. C. 2019. Lin-
Estuarine, Coastal and Shelf Science, 54: 729–736.
ear and nonlinear mixed effects models. R Package Version, 3: 1–89.
Laffaille, P., Lefeuvre, J.-C., and Feunteun, E. 2000. Impact of sheep
Pontual, H., Lalire, M., Fablet, R., Laspougeas, C., Garren, F., Martin,
grazing on juvenile sea bass, Dicentrarchus labrax L., in tidal salt
S., Drogou, M. et al. 2019. New insights into behavioural ecology
marshes. Biological Conservation, 96: 271–277.
of European seabass off the West Coast of France: implications at
Laffaille, P., Lefeuvre, J.-C., Schricke, M.-T., and Feunteun, E. 2001.
local and population scales. ICES Journal of Marine Science, 76:
Feeding ecology of o-group sea bass, Dicentrarchus labrax, in salt
501–515.
marshes of Mont Saint Michel Bay (France). Estuaries, 24: 116–125.
Ripley, B., 2019. Package ‘tree’. Classification and Regression Trees. Ver-
Lefrancois, C., Odion, M., and Claireaux, G. 2001. An experimental and sion: 1.0–36. CRAN R-project:tree
theoretical analysis of the effect of added weight on the energetics Rochette, S., Rivot, E., Morin, J., Mackinson, S., Riou, P., and Le Pape,
and hydrostatic function of the swimbladder of European sea bass O. 2010. Effect of nursery habitat degradation on flatfish population:
(Dicentrarchus labrax). Marine Biology, 139: 13–17. application to Solea solea in the Eastern Channel (Western Europe).
Lotze, H. K., Lenihan, H. S., Bourque, B. J., Bradbury, R. H., Cooke, R. Journal of Sea Research, 64: 34–44.
G., Kay, M. C., Kidwell, S. M. et al. 2006. Depletion, degradation, R core team. 2019. R: a language and environment for statistical com-
and recovery potential of estuaries and coastal seas. Science, 312: puting; 2015. R-project
1806–1809. Seitz, R. D., Wennhage, H., Bergström, U., Lipcius, R. N., and Ysebaert,
Madon, B., and Hingrat, Y. 2014. Deciphering behavioral changes T. 2014. Ecological value of coastal habitats for commercially and
in animal movement with a “multiple change point algorithm- ecologically important species. ICES Journal of Marine Science, 71:
classification tree’framework. Frontiers in Ecology and Evolution, 648–665.
2: 30. Vasconcelos, R., Reis-Santos, P., Fonseca, V., Maia, A., Ruano, M.,
Maes, J., Stevens, M., and Breine, J. 2007. Modelling the migration França, S., Vinagre, C. et al. 2007. Assessing anthropogenic pres-
opportunities of diadromous fish species along a gradient of dis- sures on estuarine fish nurseries along the Portuguese coast: a multi-
solved oxygen concentration in a European tidal watershed. Estu- metric index and conceptual approach. Science of the Total Envi-
arine, Coastal and Shelf Science 75: 151–162. ronment, 374: 199–215.
MAFF. 1990. Bass Nursery Areas and other conservation measures. url: Wright, P., Christensen, A., Régnier, T., Rindorf, A., and van Deurs,
MAFF - BNA M. 2019. Integrating the scale of population processes into fisheries
Marsden, J., Blanchfield, P., Brooks, J., Fernandes, T., Fisk, A., Futia, M., management, as illustrated in the sandeel, ICES Journal of Marine
Hlina, B. et al. 2021. Using untapped telemetry data to explore the Science, 76: 1453–1463.
winter biology of freshwater fish. Reviews in Fish Biology and Fish- Wright, P. J., Doyle, A., Taggart, J., and Stirling, A. 2020. Linking scales
eries, 31: 1–20. of life-history variation with population structure in Atlantic cod.
McLusky, D. S., Bryant, D. M., and Elliott, M. 1992. The impact of Frontiers in Marine Science, 8: 630515.
land-claim on macrobenthos, fish and shorebirds on the forth es- Ying, Y., Chen, Y., Lin, L., and Gao, T. 2011. Risks of ignoring fish popu-
tuary, eastern Scotland. Aquatic Conservation: Marine and Fresh- lation spatial structure in fisheries management. Canadian Journal
water Ecosystems, 2: 211–222. of Fisheries and Aquatic Sciences, 68: 2101–2120.
Mercier, L., Mouillot, D., Bruguier, O., Vigliola, L., and Darnaude, A. M. Zuur, A. F., Hilbe, J., Ieno, E. N., Zuur, A., Hilbe, J., and Leno, E. 2013.
2012. Multi-element otolith fingerprints unravel sea− lagoon life- A Beginner’s Guide to GLM and GLMM with R: A Frequentist
time migrations of gilthead sea bream Sparus aurata. Marine Ecol- and Bayesian Perspective for Ecologists, Highland Statistics Lim-
ogy Progress Series, 444: 175–194. ited, United Kingdom.
Handling Editor: Caroline DurifYou can also read