Organizational factors: a case study of the cost-benefit of implementing control measures in precast structure constructions
←
→
Page content transcription
If your browser does not render page correctly, please read the page content below
Research, Society and Development, v. 11, n. 1, e33711124981, 2022
             (CC BY 4.0) | ISSN 2525-3409 | DOI: http://dx.doi.org/10.33448/rsd-v11i1.24981

Organizational factors: a case study of the cost-benefit of implementing control
measures in precast structure constructions
Fatores organizacionais: estudo de caso do custo-benefício na implantação de medidas de controle
em obras com estrutura pré-moldada
Factores organizativos: un estudio de caso sobre la relación coste-beneficio de la aplicación de
medidas de control en las obras de estructuras prefabricadas

                                                    Received: 12/20/2021 | Reviewed: 12/27/2021 | Accept: 12/31/2021| Published: 01/08/2022

                                                                                             Roberto Revoredo de Almeida Filho
                                                                                             ORCID: https://orcid.org/0000-0001-9339-0455
                                                                                                 Escola Politécnica de Pernambuco, Brazil
                                                                                                                        E-mail: rraf@poli.br
                                                                                                             Felipe Mendes da Cruz
                                                                                            ORCID: https://orcid.org/0000-0002-0163-465X
                                                                                                 Escola Politécnica de Pernambuco, Brazil
                                                                                                         E-mail: felipemendeslsht@poli.br

       Abstract
       This paper aims to demonstrate the implementation of systematic inspection systems at construction sites as a
       company's risk management strategy for identifying deviations, as well as to propose low-cost implementation
       organizational solutions. The methodology was divided into 5 parts. The first step consisted of a literature review,
       whose objective was to find documents and scientific productions relevant to the theme discussed in this article. Next,
       a check-list was prepared based on Regulatory Standard 18 (NR 18) - Conditions and Environment at Work in the
       Construction Industry and others. With the documentary part (check-list) finished, the field procedures were
       performed on site. After the construction was finished and the reports delivered, a survey of the non-conformities
       found was conducted so that the data could be analyzed. Finally, a cost-benefit analysis of the implemented control
       measures was performed. The irregularities that most occurred during the project's execution were: unprotected
       vertical rebar ends; employees not wearing PPE and insufficient number of sanitary installations. The safety indicators
       showed that the cycles where Structure, Masonry and Internal Sealing, Building Installations, and Finishing activities
       were performed simultaneously were the ones with the highest rate of irregularities. Finally, it was found that for each
       unit value invested in security control measures, the protection with financial liabilities from penalties is 16 times
       higher. Therefore, every cost aimed at adequate working conditions for employees reflects positively on the
       accounting management of civil construction sites.
       Keywords: Civil construction; Workplace safety; Organizational factors; Investment in control measures.

       Resumo
       O presente artigo tem como objetivo demonstrar a implantação de sistemas de inspeção sistemáticas em obras como
       estratégia de gestão de riscos da empresa na identificação de desvios, bem como propor soluções organizacionais de
       baixo custo de implantação. A metodologia foi dividida em 5 partes. A primeira etapa consistiu na revisão da
       literatura, cujo objetivo era encontrar documentos e produções científicas relevantes ao tema discutido neste artigo.
       Em seguida, foi elaborado um check-list fundamentado na Norma Regulamentadora 18 (NR 18) - Condições e Meio
       Ambiente de Trabalho na Indústria da Construção e outras. Com a parte documental (check-list) finalizada, foram
       realizados os procedimentos de campo na obra. Após finalizada a obra e os relatórios entregues, foi realizado
       levantamento das não conformidades encontradas para que os dados fossem analisados. Por fim, foi realizada a
       análise de custo-benefício das medidas de controle implementadas. As irregularidades que mais ocorreram durante a
       execução do projeto foram: pontas verticais de vergalhões desprotegidas; funcionários sem usar o EPI e número
       insuficiente de instalações sanitárias. Os indicadores de segurança mostraram que os ciclos onde eram realizadas
       simultaneamente atividades de Estrutura, Alvenaria e Vedação Interna, Instalações Prediais e Acabamento, foram os
       com maior índice de irregularidades. Por fim, foi verificado que para cada valor unitário investido em medidas de
       controle de segurança, a proteção com passivos financeiros de multas é 16 vezes maior. Desta forma, todo custo
       voltado para adequar as condições de trabalho dos colaboradores reflete positivamente para a gestão contábil das
       obras da construção civil.
       Palavras-chave: Construção civil; Segurança do trabalho; Fatores organizacionais; Investimento em medidas de
       controle.
                                                              1
Research, Society and Development, v. 11, n. 1, e33711124981, 2022
(CC BY 4.0) | ISSN 2525-3409 | DOI: http://dx.doi.org/10.33448/rsd-v11i1.24981
Resumen
Este artículo pretende demostrar la aplicación de sistemas de inspección sistemática en las obras de construcción
como estrategia de gestión de riesgos de la empresa para identificar desviaciones, así como proponer soluciones
organizativas de bajo coste de implantación. La metodología se dividió en 5 partes. El primer paso consistió en la
revisión bibliográfica, cuyo objetivo fue encontrar documentos y producciones científicas relevantes para el tema
tratado en este artículo. A continuación, se elaboró una lista de comprobación basada en la Normativa 18 (NR 18) -
Condiciones y medio ambiente de trabajo en la industria de la construcción y otras. Una vez completada la parte
documental (lista de comprobación), se llevaron a cabo los procedimientos sobre el terreno. Una vez terminado el
trabajo y entregados los informes, se realizó una encuesta sobre las no conformidades encontradas para poder analizar
los datos. Por último, se realizó un análisis de costes y beneficios de las medidas de control aplicadas. Las
irregularidades que más se produjeron durante la ejecución del proyecto fueron: puntas de barras de refuerzo
verticales sin protección; empleados que no utilizaban EPI y número insuficiente de instalaciones sanitarias. Los
indicadores de seguridad mostraron que los ciclos en los que se realizaron simultáneamente las actividades de
Estructura, Albañilería y Sellado Interior, Instalaciones del Edificio y Acabado fueron los que presentaron el mayor
índice de irregularidades. Por último, se ha comprobado que por cada valor unitario invertido en medidas de control
de la seguridad, la protección con responsabilidades financieras de las multas es 16 veces mayor. De este modo, todo
gasto destinado a adaptar las condiciones de trabajo de los empleados se refleja positivamente en la gestión contable
de las obras de construcción civil.
Palabras clave: Construcción; Seguridad laboral; Factores organizativos; Inversión en medidas de control.
1. Introduction
The civil construction sector accounts for 3.3% of Brazil's Gross Domestic Product (GDP) and is set to increase by
4% by 2021, even with the pandemic, according to data from the Brazilian Civil Construction Industry Chamber (CBIC). The
sector also has around 200 thousand establishments (companies and branches) competing in the civil construction chain. In
addition, the sector employed about 7.6 million people, 7.3% of the activated population of Brazil in 2018 (CBIC, 2021).
Therefore, the civil construction production chain is competitive and plays an important role in the generation of employment
and income, as well as in the development of the Brazilian economy.
The competitiveness in the civil construction market requires companies to invest in the reduction of losses related to
its process. According to Barkokébas et al. (2020) losses are responsible for reducing the competitiveness of companies.
Occupational accidents can be considered losses that hinder business performance. According to Aminbakhsh et al. (2013), the
costs of accidents in construction impact the financial success of construction organizations and affect the overall costs of the
construction. Therefore, investing in the prevention of accidents corroborates in the reduction of losses providing a gain in
competitiveness of the construction company.
Accidents generate unplanned costs (Ferreira et al., 2012), which reduces the competitiveness of companies' products
and, as a result, weakens the economies of nations. Studies show that 18% of deaths at work occur in low- and middle-income
countries, while 5% in high-income countries (Takala et al., 2014). Construction in turn is responsible for 21% of deaths at
work in the United States of America, (OSHA, 2017), while in Great Britain this percentage is 28% (HSE, 2018). According to
studies by Silva (2017) and Costa (2014), the death rates in emerging countries tend to be even higher.
It should be noted that such losses correspond to nearly 4% of global gross domestic product, according to data from
the International Labor Organization - ILO (ILO, 2015). According to data from the Global Competitiveness Report 2020
(World Economic Forum, 2020), competitive companies in high-income countries tend to invest more resources in managing
risks related to industrial and work processes. The same report also shows that companies that developed safety policies during
the pandemic prospered even during the COVID-19 scenario. Therefore, well-established and prosperous companies invest in
managing work-related risks.
Risk management consists in identifying, evaluating and controlling possible conditions with the potential to cause
work accidents. Inspection procedures and safety audits are risk management tools that allow the control of situations with
potential to cause accidents. According to Ferreira et al. (2012), safety inspections are beneficial because they allow the
2Research, Society and Development, v. 11, n. 1, e33711124981, 2022
(CC BY 4.0) | ISSN 2525-3409 | DOI: http://dx.doi.org/10.33448/rsd-v11i1.24981
anticipation of risks, minimizing possible costs with accidents. Risk management is part of the company's loss control strategy.
According to Gurcanli et al. (2015), the costs with the process safety are part of the project in order to protect the losses related
to occupational accidents. Thus, the investment in inspections and audits of occupational health and safety - OHS positions
such corporate area not only as strategic in the worker protection, but also strategic for the protection of the capital of the
business itself.
In the context of worker and capital protection, the legal deviations regarding occupational safety issues imply the
occurrence of occupational accidents, which in turn imply in the loss of business capital that implies in the loss of
competitiveness and profitability of the enterprise. Skiba and Lehder (2005) studied data on accidents at work in the industrial
sector, from German Mutual Insurance Companies, and proposed the distribution shown in Figure 1.
Figure 1 - Accident pyramid.
Fatal accident
Accidents with more than 3 days of absence
Accidents with 1, 2 or 3 days of absence
Accidents with first aid only or with less than a
day's absence from work
Near-accidents
Source: Skiba e Lehder (2005).
According to Figure 1, there is a relationship between near misses and fatal accidents. Therefore, deviations are
responsible for both minor losses (near misses) and fatalities.
In this context, safety inspections and audits play the role in the identification of occurrences of deviations. According
to Cardoso (2017), deviations are considered a situation outside the safety, environmental and occupational health standards
that has the potential to cause harm to people, property or impact the environment. Deviations are the minor occurrences that
precede serious and fatal accidents. For Van Der Schaff and Kanse (2004), minor occurrences, called incidents, have the same
cause patterns of fatalities. Deviations may originate from human, technical or organizational factors. Thus, fatal accidents and
incidents are caused by human, technical and organizational factors that can be identified in advance through systematic
inspections and audits.
Safety inspections are strategies responsible for bringing to light failures in the occupational safety control. According
to Barkokébas et al. (2020), inspections are responsible for the identification of hazards and the solutions capable of solving
them effectively. The solutions to the problems found are usually low cost. According to Gerald et al. (2009), 80% of the
problems are simple to solve and have organizational factors as their origin. Thus, identification and control of organizational
factors are strategies of low aggregate cost for the control of risks and with prospects of good results.
The management of organizational factors depends on the investment in low cost corporate actions. According to Li et
al. (2015), the investment in training, people development and implementation of small safety adjustments result in positive
impacts to the organization. The construction enterprises seek for safety measures with low cost. The dynamics of the
3Research, Society and Development, v. 11, n. 1, e33711124981, 2022
(CC BY 4.0) | ISSN 2525-3409 | DOI: http://dx.doi.org/10.33448/rsd-v11i1.24981
construction production according to Zhou et al. (2015) requires from the process alternatives of rapid implementation for the
effective control of risks. Therefore, construction managers try to invest in low-cost organizational measures to control the
process risks.
The civil construction has as a characteristic the constant change of work scenarios. According to Rosa Filho (2019),
construction is composed of multiple services of short cycles with labor exchange that varies according to the stage of the
work. Systematic inspections (audits) work with risk management strategy with emphasis on mapping changes. According to
PMI (2017), audits help in the investigation of problems to define solutions. Therefore, systematic inspections (audits) are
characterized as a risk management tool for constructions to identify problems and propose organizational alternatives of low
implementation cost.
Given the above, this paper aims to demonstrate through a case study the implementation of systematic inspection
systems in construction sites as a risk management strategy of the company in the identification of deviations, as well as to
propose organizational solutions of low implementation cost. In addition, it demonstrates the cost-benefit of investing in
organizational solutions for occupational safety on the protection of the enterprise's capital.
2. Methodology
The present work consists of a case study referring to work safety audits in an educational project. From the audits,
technical reports were generated whose data were qualitatively treated. The methodology of this work was divided into 5 parts,
as follows: Literature review, check-list structuring, field procedures, data organization and treatment and cost composition of
control measures.
2.1 Literature review
The first stage consisted of the literature review, whose objective was to find documents and scientific productions
relevant to the theme discussed in this article. The theme was searched in periodicals, annals of events, doctoral theses and
master's dissertations indexed in databases. For the sake of comprehensiveness, the following keywords were used:
occupational safety, occupational health and safety, civil construction, cost, risk management, safety guidelines and safety
investments, as well as their translations into English. The search was made in the title, abstract and keywords. The
information and discussions contained in this article were based on academic productions found through systematic review in
SCOPUS and Science Direct.
2.2 Structuring the check-list
For the development of this work it was applied the methodology Barkokébas (2004), which guides the preparation of
check-list for application in the field. Thus, a check-list was prepared based on Regulatory Standard 18 (NR 18) - Conditions
and Environment at Work in the Construction Industry and others. Figure 2 shows part of the check-list applied in the project.
4Research, Society and Development, v. 11, n. 1, e33711124981, 2022
(CC BY 4.0) | ISSN 2525-3409 | DOI: http://dx.doi.org/10.33448/rsd-v11i1.24981
Figure 2 - Check-list applied at the enterprise.
Source: Occupational Safety and Hygiene Center - NSHT (2018).
According to Figure 2, in total, the check-list has 192 applicable items to be audited. It contains 20 items related to the
living area; 8 items allusive to demolition, excavations and rock disassembly; 6 items related to carpentry; 5 items with respect
to steel frames; 3 items with respect to concrete structures; 4 items allusive to welding and hot cutting; 10 items regarding
stairs, ramps and walkways; 8 items regarding protection against falls from heights; 12 items regarding movement and
transport of materials and people; 13 items regarding scaffolding; 5 items regarding aerial work platforms; 4 items regarding
cables and ropes; 5 items regarding masonry, coatings and finishes; 3 items regarding roofs and coverings; 11 items regarding
safety in electrical installations; 15 items regarding safety in machines, tools and miscellaneous equipment; 4 items regarding
personal protection equipment - PPE; 8 items regarding storage and stocking of materials; 1 item regarding fire protection; 2
items regarding signaling; 2 items regarding order and cleaning; 3 items regarding lighting; 3 items regarding working at
height and 37 items regarding mandatory documentation.
2.3 Field procedures
With the documentary part (check-list) finalized, the field procedures were carried out on site.
2.3.1 Object of study (work)
The object of study is an educational development of elementary school and kindergarten type built in the city of
Recife, Pernambuco, Brazil. The school occupies 6,524.93 m², with occupation index of 100% of the land, considering built
area, green areas, circulation and vehicle parking spaces. The object of study consists of two buildings connected by an internal
street, three multi-sports courts (one suspended), a library with more than 100m², laboratories, classrooms and living areas,
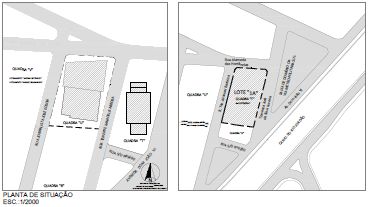
according to the scheme shown in Figure 3. The project had as a construction technology used precast concrete parts.
5Research, Society and Development, v. 11, n. 1, e33711124981, 2022
(CC BY 4.0) | ISSN 2525-3409 | DOI: http://dx.doi.org/10.33448/rsd-v11i1.24981
Figure 3 - Schematic of the educational enterprise.
Source: NSHT (2018).
The architectural design of the development includes two building units named "T block " and "U block ". The T
block has 3 floors, being the ground level for access and two levels of rooms. The U block has 5 floors, with a semi-
underground level for garages, a ground level and three levels of rooms.
2.3.2 Observation (audit and technical reports)
The observation of the data occurred through technical visits to the site without prior notice, in order to collect data
close to the reality of the routine of the work. That is, minimizing the attempts of corrections or omissions of irregularities
facing the legal requirements of health and safety at work applicable. Thus, the work was found in its normal state of
development, whose information tended to reflect the habits of the company in its routine activities.
In total, eight visits were made to the construction site, being applied the structured check-list. Each incursion was
called "Cycle", therefore, Cycles I, II, III, IV, V, VI, VII and VIII were performed. The audits had an interval of 30 days and a
duration of 8 hours, including the entire working day of the construction site employees. They followed the entire evolution of
the work, contemplating the following phases of the same: Foundation (FO); Structure (ST); Masonry and Internal Sealing
(MIS); Building Installations (BI) and Finishing (FI).
The deviations and irregularities were identified and quantified. Subsequently, both the deviations in the field and the
irregularities present in the company's documents were analyzed. Observations were noted considering the irregularities found
in the field, as well as problems pointed out by the employees themselves through conversations during the visits. At the end of
each visit, technical closing meetings were held with the site leaders, where the critical points were discussed and fixed
immediately, as well as the best way to correct the main deviations and alternatives to prevent their repetition were discussed.
Finally, within a maximum period of 1 week, the company responsible for the work received a technical report that
included the observations and surveys made during the audits. Figure 4 shows the structure of the documents studied in the
study.
6Research, Society and Development, v. 11, n. 1, e33711124981, 2022
(CC BY 4.0) | ISSN 2525-3409 | DOI: http://dx.doi.org/10.33448/rsd-v11i1.24981
Figure 4 - Structure of the reports.
Description of
Standard item the standard item Situation
Repetition
history
Alert level
Recommendations Pictures
for adjustment
Source: NSHT (2018).
2.4 Organisation and treatment of data
After completion of the work and the reports delivered, a survey of the non-conformities found was conducted so that
the data could be analyzed.
2.4.1 Classification of deviations
The classification of deviations was performed according to the Barkokébas Júnior (2004) methodology. The check-
list items were classified as: compliant - CO, disagreed - DIS and serious and imminent risk - SIR. And their definitions are
given below:
• Serious and imminent risk - Work conditions with potential to cause occupational accident or disease of serious
or fatal nature (Ex: periphery openings, exposed energized parts).
• Disagreement - Situations in disagreement with the standards (Ex: materials obstructing circulation routes, poorly
dimensioned living areas).
• Compliant - Standards compliant situations.
2.4.2 Handling of information
The treatment of information occurred through the development of objective and measurable indicators suitable for
the monitoring of the management performance. Presented, comparing different periods, they evaluate the company
performance under various approaches, becoming a thermometer for the objectives and goals determined by the organization
(Barp et al, 2014). The indicators make it possible to know the real situation that one wants to change, in addition to
establishing priorities, choose the beneficiaries, identify the objectives and translate them into goals and, thus, being able to
effectively monitor the progress of the work, evaluate the processes, adopt the necessary redirections and verify the results and
impacts obtained (SESI, 2010).
Thus, the collected data were treated and the following safety indicators were developed: Quantitative Indicator - IQt,
Qualitative Indicator - IQl, Economic Indicator - EI and Saturation Indicator - SI, described below:
7Research, Society and Development, v. 11, n. 1, e33711124981, 2022
(CC BY 4.0) | ISSN 2525-3409 | DOI: http://dx.doi.org/10.33448/rsd-v11i1.24981
• Quantitative Indicator: Presents the performance of the work with respect to safety conditions and hygiene at
work throughout the inspections carried out. The quantitative data classified as Compliant, Non-Compliant and
Serious and Imminent Risk, according to the OSH legislation in force in Brazil, are presented.
• Qualitative Indicator: Presents qualitatively, the incidence of irregularities recorded in the Quantitative Indicator,
identifying the items of NR-18 and other regulatory standards.
• Economic Indicator: Presents the possible costs related to occupational safety liabilities in fines calculated
according to NR 28 - Inspections and Penalties, taking into consideration the criteria adopted by the Ministry of
Labor and Employment - MTE.
• Saturation Indicator: Presents the quantity of SIR (Serious and Imminent Risk) found, throughout the audits, for a
group of 100 workers. This indicator is represented by equation 1.
(Equation 1)
After the treatment of the data and the structuring of the indicators, it was possible to suggest alternatives for good
work practices, specific for the control of irregularities that presented a higher frequency during the course of the work.
2.5 Cost Composition of Control Measures
Throughout the execution of the project, one of the reasons that led to an improvement in OHS performance on site
was the implementation of operational measures at the service fronts. Such adjustments were made in order to neutralize the
risk conditions and meet the requirements indicated by the reports of systematic audits in OHS.
In the topic of the results that speaks of such adjustments, an estimate of the cost that the company responsible for the
execution of the project had to disburse for their implementation is presented. To arrive at such values, it was used the table of
the National System of Prices and Indexes for Civil Construction - SINAPI, with data from the time when the work was
performed (2018), provided by Caixa Econômica (Federal Savings Bank) (2021). According to previous studies and the
professional experience of the authors, the values of each input were collected from the SINAPI table, so that the respective
normative adequacy could be achieved, and thus, the final cost estimate for such a measure could be implemented. Each
operational measure was analyzed separately as shown in Table 1.
Table 1 - Columns of the safety investment analysis spreadsheet.
Investment Safety
Quantity Unit
EI description investment
Deviation Classification (TABLE (TABLE Economy
(NR-28) (TABLE (TABLE
(1) (2) SINAPI) SINAPI) (8)
(3) SINAPI) SINAPI)
(5) (6)
(4) (7)
Source: Adapted from Barkokébas Júnior (2004) and SINAPI (2021).
Where the first column presents the description of the normative deviation to be adjusted and its classification,
according to the Barkokébas Júnior (2004) methodology, comes right after in the second column. Knowing that each type of
irregularity has a respective fine liability, in the third column, it is shown this value based on the table of fines established by
the text of NR - 28 at the time of the work and which is used in the EI (Economic Indicator). The next three columns (4, 5 and
6) show how the inputs used to adjust the regulatory deviation are described in the SINAPI table, the quantities of each that
were necessary to perform the adjustment and the unit of measure for each, respectively. In the seventh column is presented the
sum of the values of the inputs and thus, we have the cost of the investment made by the company responsible to correct the
8Research, Society and Development, v. 11, n. 1, e33711124981, 2022
(CC BY 4.0) | ISSN 2525-3409 | DOI: http://dx.doi.org/10.33448/rsd-v11i1.24981
irregularity. Finally, the last column presents the difference between the values of column (3) and column (7), showing the
savings achieved by the company through the safety investment made.
In view of globalization and the international relevance factor, the columns referring to economic indicators (3, 7 and
8) were converted into dollars. Thus, the values found in Brazilian currency were multiplied by 5, the approximate value of the
dollar at the time this study is being developed (Infomoney, 2021).
3. Results and Discussion
The results were divided into the following three categories.
3.1 Descriptive statistics of the indicators
The chart in Figure 5 was developed to illustrate the evolution of the percentage of the construction work built over
the audit cycles performed. With it, it is possible to indicate the types of activities that were found at the time of the safety
inspection of the project.
Figure 5 - Phases of the work along the cycles.
BI + FI
MIS
Percent built
ST
FO
Cycle I Cycle II Cycle III Cycle IV Cycle V Cycle VI Cycle VII Cycle VIII
Legend: FO - Foundation; ST - Structure; MIS - Masonry and Internal Sealing; BI - Building Installations and FI - Finishing.
Source: Adapted from NSHT (2018).
According to Figure 5, the 8 cycles of inspections corresponded to the complete monitoring of the project. For Freitas
et al (2021) works executed in 8 months are considered fast and have challenges in the management process. The Quantitative
Indicator reported in Figure 6 presents the frequency of incidence of non-conformities. The quantitative indicator showed
uniformity in relation to the number of disagreements, with a maximum point with 14 disagreements in Cycle IV, a period with
a large number of contractors on site, and a minimum point with six disagreements in Cycle I, due to the construction still
being in the beginning, and consequently, the reduced number of activities and employees. Regarding the SIR, the indicator
shows that it had an increasing trend until it reached its maximum value and then suffered a decline until the end of the site
visits. For a better view of the site performance in relation to Disagreements and Serious and Imminent Risks - SIR, Figure 6
was generated without the compliance data.
9Research, Society and Development, v. 11, n. 1, e33711124981, 2022
(CC BY 4.0) | ISSN 2525-3409 | DOI: http://dx.doi.org/10.33448/rsd-v11i1.24981
Figure 6 - Quantitative indicator without conformities.
Source: NSHT (2018).
In order to aggregate the information from the graphs in Figures 5 and 6, Figure 7 indicates the activities that were
being performed at the site in each result of irregularities found.
Figure 7 - Quantitative indicator combined with construction phases.
BI + FI
MIS
ST
FO
Source: Adapted from NSHT (2018).
Analyzing the graph in Figure 7, we see that the highest incidence of normative deviations occurred in Cycles IV and
V. This is justified by the fact that during these cycles there was a larger amount of activities to be performed on site, involving
the phases of Structure (ST), Masonry and Internal Sealing (MIS) and the beginning of the Building Installations and Finishing
10Research, Society and Development, v. 11, n. 1, e33711124981, 2022
(CC BY 4.0) | ISSN 2525-3409 | DOI: http://dx.doi.org/10.33448/rsd-v11i1.24981
(BI+FI), the latter precisely in the cycle with the highest incidence of irregularities (22). According to Soares Júnior et al
(2021), the more activities being performed, the greater the number of workers involved, causing the amount of causes for
possible accidents to also be greater, making it normal to have an increase in the amount of irregularities found in OHS audits.
Therefore, the drop in the number of serious and imminent risks (SIR) contemplated during the technical visits is due to the
measures that were requested to be implemented in the reports of previous audits and the gradual decrease of activities being
carried out on the work fronts and the number of staff working at the site. This fact is justified by observing the drop in the
number of irregularities as soon as the activities of the Structure phase (ST) of the works were terminated.
Thus, for the direction of the company's actions, it is necessary to identify the irregularities, relating them to the legal
and regulatory requirements. Figure 8 shows the Pareto distribution with respect to items in non-compliance with regulatory
standards. This distribution allows visualizing where the 80% of the causes of deviations in relation to the standard are
concentrated. The indicator shown in Figure 8 allows the direction of management in occupational safety for resolution of the
most frequent causes.
Figure 8 - Pareto distribution for qualitative indicator of disagreements.
A: ITEM 18.4 - Living area; B: NR-6 - PPE; C: ITEM 18.13 - Protective measures against falling from height; D: ITEM 18.12 - Ladders, ramps and
walkways; E: ITEM 18.15 - Scaffolding; F: ITEM 18.21 - Electrical installations; G: ITEM 18.7 - Carpentry; H: ITEM 18.14 - Movement and transportation
of materials and persons; I: ITEM 18.26 - Fire protection; J: NR-10 - Safety in Services with Electricity; K: ITEM 18.29 - Order and cleaning; L: ITEM 18.3 -
PCMAT; M: ITEM 18.8 - Steel Frames; N: ITEM 18.24 - Storage and stocking of materials; O: ITEM 18.27 - Safety signs; P: NR-12 - Safety at Work in
Machinery and Equipment; Q: ITEM 18.6 - Excavations, foundations, and blasting rock; R: ITEM 18.22 - Miscellaneous machinery, equipment, and tools; S:
NR-18 - Annex IV; T: NR-17 - Ergonomics; U: ITEM 18.23 - Personal Protective Equipment - PPE; V: ITEM 18.30 - Hoardings; W: NR-22 - Safety in
Mining; X: NR-24 - Sanitary and Comfort Conditions in the Workplace; and Y: NR-34 - Working Environment and Conditions in the Naval Construction,
Repair, and Dismantling Industry. Source: NSHT (2018).
According to Figure 8, it is possible to see that the highest frequency of disagreements is related to ITEM 18.4 -
Living Area, totaling 16.18% of the occurrences, followed by Personal Protective Equipment - NR 06 (13.24%) and ITEM
18.13 - Protection Measures Against Falls from Height (9.56%).
Like the disagreements, the situations of Serious and Imminent Risk (SIR) are also part of the amount of non-
conformities. For a better visualization of the GIR found, Figure 9 presents the Pareto distribution of the items in SIR.
11Research, Society and Development, v. 11, n. 1, e33711124981, 2022
(CC BY 4.0) | ISSN 2525-3409 | DOI: http://dx.doi.org/10.33448/rsd-v11i1.24981
Figure 9 - Pareto distribution for qualitative SIR indicator.
A: ITEM 18.8 - Steel frames; B: ITEM 18.15 - Scaffolding; C: NR-6 - PPE; D: ITEM 18.11 - Welding and hot cutting operations; E: ITEM 18.13 - Protective
measures against falling from heights; F: ITEM 18.23 - Personal protective equipment - PPE; G: NR-18 - Annex IV; H: ITEM 18.24 - Storage and stockpiling
of materials; I: ITEM 18.6 - Excavations, foundations and rock dismantling; J: ITEM 18.21 - Electrical installations; and K: NR-35 - Work at Height.
Source: NSHT (2018).
Analyzing the data presented in Figure 9, it is possible to verify that the highest amounts of SIR found are related to
Item 18.8 - Steel Frames, with 49% of occurrences, and then, Item 18.15 - Scaffolding, representing 11% of the total.
As shown previously through the graphs in Figures 8 and 9 and surveying information from the safety reports, these
were the irregularities that occurred most during the execution of the project:
• Vertical rebar ends unprotected;
• Employees not wearing PPE;
• Insufficient number of toilet facilities and no container for used paper;
• Incomplete guardrail system for collective protection;
• Absence of guardrails and footings on scaffolding; and
• Employees not securing their harness to the lifeline.
Lima et al. (2021) performed a similar methodology in a construction site with on-site construction process and raised
the most frequent normative deviations:
• Risk of employees, materials and equipment falling;
• Debris obstructing passages and posing a landslide risk;
• Materials stored without meeting the requirements of safety standards;
• Employees not using PPE;
• Machinery and equipment without the safety devices.
Thus, regulatory irregularities concerning site organization, storage of inputs and equipment without safety devices,
are indeed more difficult to appear in precast concrete works. However, issues related to fall protection and employees not
using PPE are present both in on-site and precast concrete works.
12Research, Society and Development, v. 11, n. 1, e33711124981, 2022
(CC BY 4.0) | ISSN 2525-3409 | DOI: http://dx.doi.org/10.33448/rsd-v11i1.24981
The Qualitative Indicator presented above, through the graphs in Figures 8 and 9, pointed out the main aspects found
in the work that contributed to the increase of operational risks of the construction. It should be noted that such irregularities
are subject to fines, in case of inspection by the responsible Brazilian agency. In this context, the Economic Indicator shown in
the graph of Figure 10 reflects the financial liability in fines that the company could pay in the event of a fine. It should be
noted that this value is obtained from the tables of gradation of fines established by NR 28 - Inspections and Penalties.
Figure 10 - Economic Indicator Responsible Company x Outsourced Companies.
Source: NSHT (2018).
In the same way as was done in Figure 7, Figure 11 indicates the phases of the work during the EI values over the
safety audit cycles.
Figure 11 - Economic Indicator combined with construction phases.
BI + FI
MIS
ST
FO
Source: Adapted from NSHT (2018).
It is possible to see that the liability of the Responsible Company (RC) is directly proportional to the liability of the
outsourced companies. This situation is justified by the proportional number of employees of the RC and third parties in all
phases of the work. It is possible to verify that, as well as the SIR curve in the IQt, from Cycle I to Cycle V there was a growth
in the Economic Indicator, both of the RC and the contractors, with the highlight for a more accentuated growth of the RC.
13Research, Society and Development, v. 11, n. 1, e33711124981, 2022
(CC BY 4.0) | ISSN 2525-3409 | DOI: http://dx.doi.org/10.33448/rsd-v11i1.24981
From Cycle V onwards, there was a tendency for the indicator to decrease, both for the RC and the outsourced companies. In
view of the above, it is possible to perceive a. Because as the company develops its safety management throughout the work
and the amount of activities and employees begin to decrease, it is natural a trend of improvement of the work in relation to
compliance with labor laws (Dezan, 2017).
With regard to the number of employees involved in the construction work, according to Figure 12, the RC only
presented a higher number of employees than the outsourced employees in Cycles II and IV. Confirming the important role of
outsourced employees in the EI data.
Figure 12 - Evolution of the workforce on site.
Source: NSHT (2018).
The more service fronts are opened at the construction site, it is natural that more workers are involved in the work
(Freitas et al., 2021). Figure 13 shows that as new stages were starting and new service fronts were opening, the total
workforce on the site followed this increase in the number of activities to be performed at the site. Just like the graphs in
Figures 7 and 11, the highest values occurred in Cycles IV and V, with 235 and 252 workers in total, respectively. Confirming
the influence of the number of workers in the occurrence of non-conformities cited by Soares Júnior et al. (2021).
14Research, Society and Development, v. 11, n. 1, e33711124981, 2022
(CC BY 4.0) | ISSN 2525-3409 | DOI: http://dx.doi.org/10.33448/rsd-v11i1.24981
Figure 13 - Evolution of workforce combined with the phases of the project.
BI + FI
MIS
ST
FO
Source: Adapted from NSHT (2018).
The Qualitative and Economic Indicators shown above present an overview of the work in relation to the requirements
inspected by the Ministry of Labor. It is noteworthy that situations that offer risk to the lives of workers, besides being an item
with high liability of fines, also causes stoppages, embargoes and interdictions and can cause high economic losses (Fernandes
et al., 2021). Based on this information, the Saturation Indicator presented in Figure 14 represents the number of SIR found,
throughout the audit cycles, for a group of 100 workers.
Figure 14 - Saturation Indicator.
Source: NSHT (2018).
Similarly to previous analyses, Figure 15 shows the grouping of information between the Saturation Indicator (SI) and
the evolution of the construction phases.
15Research, Society and Development, v. 11, n. 1, e33711124981, 2022
(CC BY 4.0) | ISSN 2525-3409 | DOI: http://dx.doi.org/10.33448/rsd-v11i1.24981
Figure 15 - Saturation indicator combined with the stages of construction.
BI + FI
MIS
ST
FO
Source: Adapted from NSHT (2018).
According to Figure 15, it is possible to see that there was an oscillation during the construction period, as well as the
curve of the SIR in the IQt. Until Cycle V there was an increase in the saturation indicator, corresponding to the peak of 3.57
SIR/100 workers, this shows that the conditions with potential to cause serious and fatal accidents (SIR) increased until that
month. From September on, a decrease in the saturation index was observed, consequently, the number of SIRs decreased,
causing a lower potential of serious and fatal accidents, reaching 1.03 SIR/100 workers in December.
Therefore, the charts of the Economic and Saturation Indicators (Figures 11 and 15) followed the behavior of the
Quantitative Indicator of Non-Conformities, especially the SIR curve (Figure 7). Indicating that the number of regulatory
deviations directly impacts the performance of all indicators of occupational safety, especially those related to situations of
serious and imminent risk.
3.2 Cost x benefit analysis of risk control
According to J. Lee et al. (2020), the purpose of standards is to accommodate the changing environmental and social
demand around a company. López-Alonso et al. (2013), showed that several studies have analyzed the economic aspect of
health and safety at work and some have shown that employers do not consider that investing in safety is financially profitable;
in other words, the costs associated with accidents at work are not considered so high that the company needs to invest in
health and safety with the sole purpose of avoiding these costs.
Specific changes were made at the site in order to neutralize the risk conditions and comply with the requirements
pointed out by the systematic OHS audit reports. To exemplify, Table 2 shows some of the organizational corrections made
throughout the audit cycles.
16Research, Society and Development, v. 11, n. 1, e33711124981, 2022
(CC BY 4.0) | ISSN 2525-3409 | DOI: http://dx.doi.org/10.33448/rsd-v11i1.24981
Table 2 - Savings gained through security investments.
Non-conformitys BEFORE AFTER
Switchboards without signalling
and safety interlocks
Cutting materials without a
suitable workbench
Places with risk of falling
without collective safeguards
Working under the action of bad
weather
Scaffolding not in accordance
with the projects
17Research, Society and Development, v. 11, n. 1, e33711124981, 2022
(CC BY 4.0) | ISSN 2525-3409 | DOI: http://dx.doi.org/10.33448/rsd-v11i1.24981
Low wiring subject to
mechanical impacts
Gas cylinders and flammable
materials without adequate
place for storage
Source: Adapted from NSHT (2018).
The operational measures presented in Table 2 prevent the company from being fined in the event of an infraction
notice. Analyzing each correction implemented according to Table 1, the company needed to disburse a total amount of R$
2,011.47. If it were to receive labour fines for the non-conformities raised, it would pay the amount of R$ 32,216.00, according
to the regulatory standard on Inspection and Penalties (NR-28, 2020). Therefore, the cost of safety corresponds to 6.24% of the
capital exposed in fines.
It is noticed that the company obtained savings of 96.2% of the amount it would pay in case of a fine from the
responsible inspection agencies. Implementing organizational measures in the production process of civil construction
companies brings economic benefits for them (Fernandes et al., 2021). Thus, the data indicate that for every dollar invested in
safety control measures, companies developing a work similar to the one analyzed in this work, avoid paying another 16
dollars in fines related to inspections by regulatory agencies. That is, in commercial constructions with precast concrete
structure, for each unit amount invested in safety measures, the protection against possible financial liabilities of fines is 16
times higher.
Then, the results revealed that rules and regulations were a significant moderator of the effects related to control
within an organization. Therefore, as well as studies by Adeleke et al. (2017), it was proven that organizational interventions
based on safety legislations caused companies to considerably reduce the occurrence of risks in their constructions. The graph
in Figure 17 shows the importance of investment in safety.
18Research, Society and Development, v. 11, n. 1, e33711124981, 2022
(CC BY 4.0) | ISSN 2525-3409 | DOI: http://dx.doi.org/10.33448/rsd-v11i1.24981
Figure 17 - Cost-benefit analysis of safety.
COSTS
TOTAL COSTS
SECURITY COSTS
EFFECTIV SAFETY
DEGREE OF SECURITY (%) = X 100
POSSIBLE SAFETY
ACCIDENT COSTS
Source: Miguel (2014).
Analyzing the graph in Figure 17, one notices that as the costs with preventive safety measures increase, the curve
with total accident costs decreases. Thus, looking at the economic criterion, when the degree of safety of the enterprise
improves, the company is obtaining financial return. It can be concluded that investing in safety generates a cost-benefit for the
company, employees and the country, being of utmost importance in the construction sector or in any sector (Almeida, 2018).
4. Final Considerations
Analyzing the graphs of safety indicators and the one referring to the number of workers on site, we saw that the
number of normative deviations directly impacts the performance of all indicators of occupational safety, especially the SIR
curve. Thus, we conclude that during the period when activities of Structure (ST), Masonry and Internal Sealing (MIS),
Building Installations and Finishing (BI+FI) are performed, is where we find the peak values in the indicators and number of
workers on site. Therefore, this is the critical moment for work safety in commercial precast concrete construction sites.
Analyzing the financial point of view, it was found that investments aimed at improving the degree of safety of the
work have as a direct consequence the protection of capital subject to pay labor fines. In this work, it was shown that each unit
value invested in safety control measures, the protection with financial liabilities of fines is 16 times higher. Thus, every cost
aimed at adapting the working conditions of employees reflects positively for the accounting management of civil construction
works.
Organizational measures of safety at work have low implementation cost. For the present case, such investment
corresponded to 6.45% of the capital exposed in fines, without considering direct and indirect costs due to work accidents.
Given the information presented, it is possible to verify the improvement in OHS performance of the work. Such
improvement reflects directly not only in the maintenance of the production process, avoiding losses and unwanted downtime,
but also in maintaining the physical integrity and health of all workers on site. The results also propose that the organizational
interventions have the consequence of reducing the occurrence of risk in construction projects.
Finally, it is important that further studies analyzing the performance of safety systems in the construction industry be
conducted so that they are increasingly implemented in the industry. And it is recommended for future work, cost-benefit
analyses of the implementation of organizational measures in other types of construction for the constant advancement of the
sector in relation to occupational safety.
19Research, Society and Development, v. 11, n. 1, e33711124981, 2022
(CC BY 4.0) | ISSN 2525-3409 | DOI: http://dx.doi.org/10.33448/rsd-v11i1.24981
References
Adeleke, A.Q., et al. (2018) The Influence of Organizational External Factors on Construction Risk Management among Nigerian Construction Companies,
Safety and Health at Work. 9(1), 115-124, https://doi.org/10.1016/j.shaw.2017.05.004.
Almeida, V. O. (2018) The Importance of Investing in Occupational Safety in Construction. 2018. Article presented to the Undergraduate Course in Civil
Engineering of UNICESUMAR - University Center of Maringá as partial requirement for obtaining the title of Bachelor of Civil Engineering.
Aminbakhsh, S., Gunduz, M. & Sonmez, R. (2013) Safety risk assessment using analytic hierarchy process (AHP) during planning and budgeting of
construction projects. Journal of Safety Research, 46, 99-105, 2013.
Associação Brasileira de Normas Técnicas. NBR ISO GUIA 73: Risk management - Vocabulary. 2009. 12p.
Associação Brasileira de Normas Técnicas. NBR ISO/IEC 31010: Risk management - Techniques for the risk assessment process. 2012. 96p.
Barkokébas J., B., Zlatar, T., Cruz, F. M. da, Lago, E. M. G., Martins, A. R. B. & Vasconcelos, B. M. (2020) Segurança e saúde do trabalho para uma cultura
prevencionista no ambiente laboral. Recife: Editora da Universidade de Pernambuco..
Barp, F. L., et al. (2014) Proactive Performance Indicators in Occupational Safety and Health. Revista Científica Tecnológica - Uceff Faculdades. 1(1).
http://uceff.edu.br/revistatecnologica
Battaglia, M., Frey, M. & Passetti, E. (2014) Accidents at Work and Costs Analysis: A Field Study in a Large Italian Company. Industrial health, 52, 354-366
Caixa Econômica Federal (BOX). SINAPI - Sistema Nacional de Pesquisa de Custos e Índices da Construção Civil. https://www.caixa.gov.br/poder-
publico/modernizacao-gestao/sinapi/Paginas/default.aspx.
Brazilian Chamber of the Construction Industry (CBIC). GDP Brazil and Civil Construction, 2018. http://www.cbicdados.com.br/menu/pib-e-
investimento/pib-brasil-e-construcao-civil.
Costa, P. T. B. (2014) Civil Liability Resulting from Workplace Accident. Monograph (Specialization in Civil Law and Civil Procedure). Centro De Pós
Graduação, Pesquisa E Extensão Das Faculdades Integradas "Antônio Eufrásio De Toledo" De Presidente Prudente - SP, 2014.
Enshassi, A., Ayyash, A. & Choudhry, R. M. (2016) BIM for construction safety improvement in Gaza strip: awareness, applications and barriers.
International Journal of Construction Management, China, 16(3).
Fernandes, D. R.., Santos, J. A. N., Santiago, V. I. Q. & Freitas, A. P. A. (2021) Analysis of facilitating factors and obstacles to the implementation of
enterprise risk management in Brazil - A perspective of change. Research, Society and Development, 10(6), e10710615487, 10.33448/rsd-v10i6.15487.
Available at: https://rsdjournal.org/index.php/rsd/article/view/15487.
Ferreira, M. de M., Souza, C. E. dos S., Ribeiro, C. A., Galdino, D. B. & Ricci, G. L. (2012) Avaliação sobre a prevenção de riscos na atividade de trabalho
em prensas. Iberoamerican Journal of Industrial Engeneering, 4(8), 48-68, 2012.
Freitas, A. P. A., Santos, J. A. N., Oliveira, E. P., Fernandes, D. R. & Oliveira, N. L. F. de. (2021) Estudo exploratório das dimensões dos riscos em
empreendimentos da construção civil. Research, Society and Development, 10(7), e14410716452, 10.33448/rsd-v10i7.16452.
https://rsdjournal.org/index.php/rsd/article/view/16452.
Gerald, J. L., Ronald, D. M., Kevin, M. N., Thomas, W. N., Clifford, L. N. & Lloyd, P. P. P. (2009) The Improvement Guide: A Practical Approach to
Enhancing Organizational Performance, Jossey-Bass.
Gurcanli, G. E., Bilir, S. & Sevim, M. (2015) Activity based risk assessment and safety cost estimation for residential building construction projects. Safety
Science, 80(112) 1-12.
HSE. Workplace fatal injuries in Great Britain 2018. 1-16.
ILO. International Hazard Datasheets on Occupations (HDO). .
Accessed on: 2 Sep. 2019. 3. 3. OSHA. Table 1 - Alphabetical listing of recognized Safety and Physical Hazards, Biological and Chemical Hazards, and
Diseases pertinent to agriculture. https://www.osha.gov/dsg/topics/agriculturaloperations/table1.html.
Junghyun, L., Jinyeub, J., Seok, J. Y. & Sang-Hoon, B. (2020) Implementation of ISO45001 Considering Strengthened Demands for OHSMS in South Korea:
Based on Comparing Surveys Conducted in 2004 and 2018, Safety and Health at Work, 11(4),418-424, https://doi.org/10.1016/j.shaw.2020.08.008.
Li, H., Lu, M., Chan, G. & Skitmore, M. (2015). Proactive training system for safe and efficient precast installation. Automation in Construction, 49(PA), 163-
174. https://doi.org/10.1016/j.autcon.2014.10.010.
Lima, A. C. de., Oliveira, L. J. B. de S. P. de., Oliveira, R. P. de. & Martins, T. R. de O. (2021) Treinamento como mecanismo de prevenção de acidentes e
incidentes: estudo de caso em uma construtora em Belo Horizonte, Minas Gerais. Research, Society and Development, 10(6), e19610615672, 10.33448/rsd-
v10i6.15672. Available at: https://rsdjournal.org/index.php/rsd/article/view/15672.
López-Alonso, M. et al. (2013) The impact of health and safety investment on construction company costs. Safety Science, 60, 151-159.
Miguel, A. S. S. R. (2014) Manual de Higiene e Segurança do Trabalho. Portugal: Porto Editora. (13a ed.)
Ministry of Planning, Development and Management. Risk Matrix - Management of Integrity, Risks and Internal Management Controls. Available at:
http://www.planejamento.gov.br/assuntos/gestao/controle-interno/manual-de-girc.
20Research, Society and Development, v. 11, n. 1, e33711124981, 2022
(CC BY 4.0) | ISSN 2525-3409 | DOI: http://dx.doi.org/10.33448/rsd-v11i1.24981
Ministry of Health. Secretariat of Health Surveillance. Inquérito sobre Atendimentos por Violências e Acidentes em Serviços Sentinela de Urgência e
Emergência do Sistema de Vigilância de Violências e Acidentes (VIVA)-Capitais, Distrito Federal e municípios selecionados. Brasília, 2014.
ILO - International Labour Organization. World Day for Safety and Health at Work 2008.
ILO - International Labour Organization. Occupational Safety and Health Management System: a tool for continuous improvement. Brasília, 2011. (Primer).
Available: http://www.ilo.org/wcmsp5/groups/public/---ed_protect/---protrav/---safework/documents/publication/wcms_154878.pdf.
OSH WIKI. Occupational safety and health risk assessment methodologies. 2016.
https://oshwiki.eu/wiki/Occupational_safety_and_health_risk_assessment_methodologies.
Park, J., Kim, K. & CHO, Y. K. (2017) Framework of Automated Construction-Safety Monitoring Using Cloud-Enabled BIM and BLE Mobile Tracking
Sensors. Journal of Construction Engineering and Management, 143(2), 5016019.
Pernas, J. P. S. Risk management indicators: Case study.
http://comum.rcaap.pt/bitstream/123456789/4363/1/Indicadores%20de%20Gest%C3%A3o%20do%20Risco%20%20Estudo%20de%20Caso_JO%C3%83O%
20PERNAS.pdf.
PMI - Project Management Institute. PMBOK® Guide: A Guide to the Project Management Body of Knowledge, 6th ed, Pennsylvania: PMI, 726 p, 2017.
Rosa Filho, C. de D. (2019) The use of BIM 5D as a tool for managing the cost with labor safety in civil construction. Dissertation (Master - Civil
Construction) University of Pernambuco, Polytechnic School, Graduate Program in Civil Engineering, 2019.
Safe Work Australia. Code of Practice: How to manage work health and safety risks. 2011.
SESI – Industry Social Service. Construction and analysis of indicators. Curitiba, 2010. 108 p. http://www.eadsesipr.org.br/ead/mod/url/view.php?id=1892.
Silva, G. G. da S. (2017) Subnotificação de Acidente de Trabalho Fatal: um estudo de caso no município de Uberlândia / Gisella Garcia da Silva. - 2017. 81 f.:
il. Dissertation (master's degree) -- Universidade Federal de Uberlândia, Postgraduate Program in Environmental Health and Worker's Health.
Skiba, R. & Lehder, G. Taschenbuch Arbeitssicherheit. Erich Schmidt Verlag, Berlin, 2005.
Souza, B. A., Oliveira, C. A. C., Santana, J. C. O., Viana Neto, L. A. C. & Santos, D. G. (2015) Análise dos indicadores PIB nacional e PIB da indústria da
construção civil. Revista de Desenvolvimento Econômico, 17(31), 140-150.
Takala, J. et al. (2014) Global Estimates of the Burden of Injury and Illness At Work in 2012. Journal of Occupational and Environmental Hygiene, 11(5),
236-337.
Van Der Schaaf, T. & Kanse, L. (2004) Biases in Incident Reporting Databases: an empirical study in the chemical process industry. Safety Science, 42(1), 57-
67.
Vasconcelos, B. M. V. (2013) Segurança no Trabalho na Construção: Modelo de gestão de prevenção de acidentes para a fase de concepção. Tese: Doutorado
em engenharia civil. Universidade do Porto.
WHS. Code of Practice on Workplace Safety and Health (WSH) Risk Management. Workplace Safety and Health Council of Singapore, 2015.
World Economic Forum. The Global Competitiveness Report Special Edition 2020: How Countries are Performing on the Road to Recovery. Geneva,
Switzerland, 2020. https://www3.weforum.org/docs/WEF._TheGlobalCompetitivenessReport2020.pdf
Zhou, Z., Goh, Y. M. & Li, Q. (2015) Overview and analysis of safety management studies in the construction industry. Safety Science, 72, 337-350.
21You can also read