OPPORTUNITIES AND CHALLENGES FOR WATER STORAGE IN NEW ZEALAND - KELLOGG RURAL LEADERSHIP PROGRAMME I COURSE 42, 2021
←
→
Page content transcription
If your browser does not render page correctly, please read the page content below
KELLOGG RURAL LEADERSHIP PROGRAMME I COURSE 42, 2021

OPPORTUNITIES AND CHALLENGES FOR
 WATER STORAGE IN NEW ZEALAND.
I wish to thank the Kellogg Programme Investing Partners for their continued support:

Disclaimer

In submitting this report, the Kellogg Scholar has agreed to the publication of this material in its
submitted form.

This report is a product of the learning journey taken by participants during the Kellogg Rural Leadership
Programme, with the purpose of incorporating and developing tools and skills around research, critical
analysis, network generation, synthesis and applying recommendations to a topic of their choice. The
report also provides the background for a presentation made to colleagues and industry on the topic
in the final phase of the Programme.

Scholars are encouraged to present their report findings in a style and structure that ensures
accessibility and uptake by their target audience. It is not intended as a formal academic report as
only some scholars have had the required background and learning to meet this standard.

This publication has been produced by the scholar in good faith on the basis of information available
at the date of publication, without any independent verification. On occasions, data, information, and
sources may be hidden or protected to ensure confidentially and that individuals and organisations
cannot be identified.

Readers are responsible for assessing the relevance and accuracy of the content of this publication &
the Programme or the scholar cannot be liable for any costs incurred or arising by reason of any person
using or relying solely on the information in this publication.

This report is copyright, but dissemination of this research is encouraged, providing the Programme and
author are clearly acknowledged.

Scholar contact details may be obtained through the New Zealand Rural Leadership Trust for media,
speaking and research purposes.

                                                                                                        2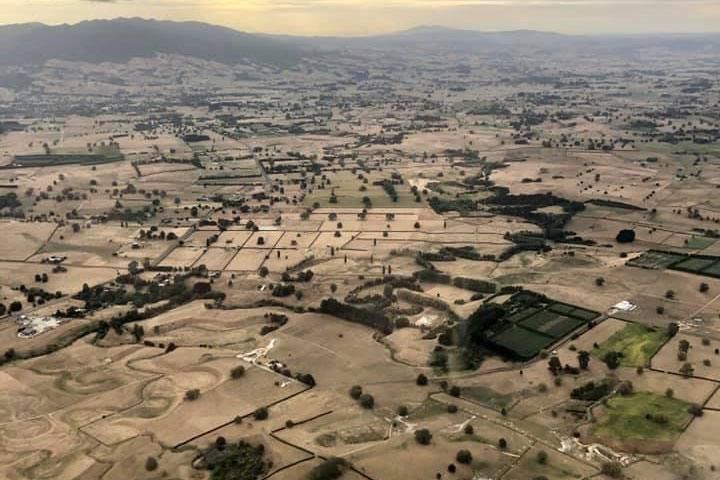
Acknowledgements:

First and foremost, I would like to acknowledge my wife Michaela for her love and
support as I completed not only this project but the Kellogg Rural Leadership
Programme as a whole.

We found out we were expecting our first child the evening before I flew to
Christchurch to begin Phase 1 of the programme and I have spent significant time
away from home and late nights researching this report ever since. Thank you for
your understanding, patience, and encouragement.

Who knew babies and Kellogg Scholars had the same 9-month gestation period?

I would also like to acknowledge DairyNZ for enabling this fantastic learning
opportunity, Dr. Scott Champion, Dr. Patrick Aldwell, Lisa Rogers, and Desley Tucker
for their support and guidance, and my fellow Kelloggers who have walked this
journey with me.

Finally, I would like to that the countless sector leaders, politicians, and farmers who
took time to share their perspective on this important topic with me. My only hope is
that my final report meets your expectations and has some use in advocating for
greater water storage infrastructure in New Zealand.

                                                                                       3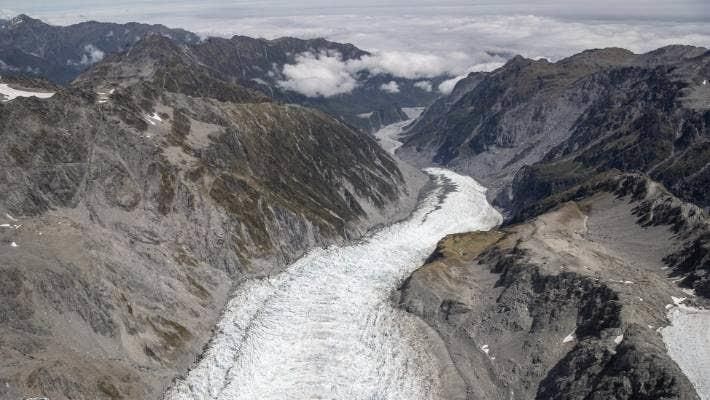
Table of contents:

1: Executive Summary.

2: Water in a global context.

3: Water in a New Zealand context.

4. Allocation issues.

5: The importance of water for Māori.

6: Māori rights and interests in water.

7: Who owns the water?

8: How much water does New Zealand actually have?

9: How much water do we currently capture?

10: What is a drought?

11: Other factors at play.

12: Our most recent drought (2020).

13: A water crisis for our largest city.

14: This had happened before (2013).

15: Drought in New Zealand.

16: The impacts of drought.

17: Urban water supply.

18: Climate Change will increase the prevalence of extreme weather events.

19: Electricity generation.

20: Opportunities for land use change.

21: Factors that drive land use change.

22: Current pressures.

23: Increased water storage as an enabler.

24: Highly productive land.

25: A strategic opportunity?

26: A lack of strategy.

27: Political uncertainty.

28: Financial barriers.

29: Fear of further dairy intensification.

30: Recommendations.

                                                                             4
1: Executive Summary.

Water is set to become the defining issue of the twenty-first century. As global populations continue
to rise and the impacts of climate change become more acute, our freshwater resources will
increasingly come under pressure.

As demand begins to exceed supply access to water, or a lack thereof, will likely lead to increased
social and political instability and tensions between neighbouring countries – particularly when there
is a shared water resource involved.

Although New Zealand is unlikely to face some of the more extreme challenges that will arise
globally, we will still have our own unique issues to overcome as a country. Already we are beginning
to feel the impacts of a changing climate with more extreme weather patterns.

In 2020 much of the country experienced what many described as the worst drought on record. The
issue is, this drought was not the only catastrophic drought in living memory – in fact, it wasn’t even
the only catastrophic drought to hit New Zealand in the past decade. Only seven years earlier we
had experienced similar scenes across much of the country.

At face value it may seem like New Zealand is running out of water, but to say water is running out
of New Zealand would be closer to the truth. We have more than enough freshwater resources to
meet all of our needs, we just fail to capture them for efficient, sustainable, strategic, and productive
use.

We are fortunate to live in one of the most water abundant countries in the world by almost any
measure: precipitation per year (43rd), water per square kilometre of land (18th), or water per head
of population (7th). New Zealand has approximately 440,000 million cubic metres available for our
use each year. The problem is we only capture around 3% of it for productive use. The rest makes its
way down our network of rivers and flows out to sea.

As a country we receive more than our ‘fair share’ from the global endowment of freshwater and I
would argue that that brings with it an obligation to use that water efficiently not only for our own
benefit, but for the benefit of others on the planet.

The impacts of climate change are only going to continue to get worse with higher temperatures,
longer droughts, and more extreme rainfall. We won’t get enough water when we need it, and we
will get too much when we don’t. This only strengthens the case for capturing the water while we
can and storing it for when we need it.

Increased water storage will bring with it other benefits like increased hydro capacity. While some of
our larger hydro damns have considerable storage capacity e.g., Benmore, Clyde, and Manapouri,
we actually have a relatively small storage capacity of 4TWh vs annual inflows of 24TWh.

It will also open up the possibility of increased land use flexibility that may reduce some of our
current environmental pressure like methane and nitrates and allow some landowners to transition
to a land use that will give them greater returns per hectare. This is particularly true in Northland
where we have an opportunity to ease economic deprivation by harnessing their existing soils and
climate.

The opportunities are significant but before we can unlock our untapped potential, we do have some
challenges that we will need to collectively overcome: a lack of an overarching national water
storage strategy, political uncertainty, financial barriers, an unfounded fear of dairy intensification,
and the ever-present question of Māori rights and interests in water.

                                                                                                      5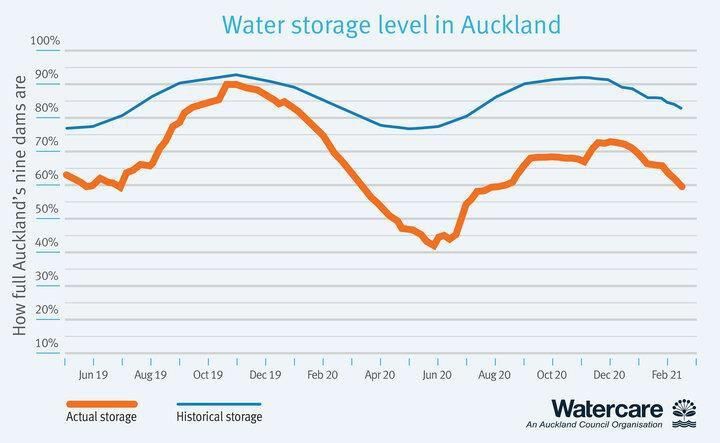
2: Water in a global context.

Some have described water as the defining crisis of the twenty-first century1, while others have
described it as the currency of global success.2 Although these two statements may sound
diametrically opposed at first glance, both are likely to ring true in the coming years.

How people come to view freshwater resources this century will be determined by where they live
with a clear distinction between the ‘Haves’ and the ‘Have Nots’.

The world’s current population of 7.6 billion people is forecast to grow to 8.6 billion in 2030, 9.8
billion in 2050 and 11.2 billion in 2100. 3 The vast majority of this increase is forecast to occur in the
developing world, particularly Africa.4

UN reports suggest that this population rise, increased urbanisation, the impacts of a warming
climate and changing diets will dramatically increase the demand for water.5 Sustaining that level of
population growth is going to put enormous pressure on our freshwater resources as demand begins
to exceed supply in many parts of the world.6 This will create global tension.

According to a U.S. intelligence community assessment of global water security "one third of the
world's population will live near water basins where the water deficit will be larger than 50 percent
by 2030"7 and annual global water requirements will exceed current sustainable water supplies by
40%.8

They believe it is highly likely that during the next decade water shortages will contribute to social
and political instability and could possibly contribute to state failure in some instances as tensions
rise over diminishing aquafers, shared river basins and the blockage or impediment of river flows
from upstream states. We are already seeing tensions rise as countries with shared resources begin
to strategically manoeuvre in preparation for future challenges.

In 2011 Ethiopia began construction of the largest hydroelectric dam in Africa, the Grand Ethiopian
Renaissance Dam. This project will allow for the irrigation of crops for the growing nation and more
than double their electricity-generating capacity with clean, green, renewable energy. This issue is
that although the genesis of the Nile can be found in Ethiopia, its waters flow through both Sudan
and Egypt further downstream sustaining both countries people and economies. Although a
resource sharing agreement has been put in place, it is still early days.9

There is also the potential for tension to arise in Asia with five of the world’s greatest rivers flowing
through China: the Mekong, Brahmaputra, Irrawaddy, Salween, and Indus. Although historically

1
  Pearce, Fred. (2006). When the rivers run dry: water, the defining crisis of the twenty-first century. Boston:
Beacon Press.
2
  Muller, Todd. (2020). Water will be the currency of the 21st century. The Country.
3
  United Nations Department of Economic and Social Affairs. (2019). World Population Prospects: The 2019
Revision.
4
  U.S. Department of State. (2012). Intelligence Community Assessment: Global Water Security.
5
  United Nations Environment Programme. (2016). Press Release: Half the World to Face Severe Water Stress
by 2030 unless Water Use is "Decoupled" from Economic Growth, Says International Resource Panel.
6
  Ibid.
7
  U.S. Department of State. (2012). Intelligence Community Assessment: Global Water Security.
8
  Ibid.
9
  Pearce, Fred. (2006). When the rivers run dry: water, the defining crisis of the twenty-first century. Boston:
Beacon Press, Chapter 23.

                                                                                                               6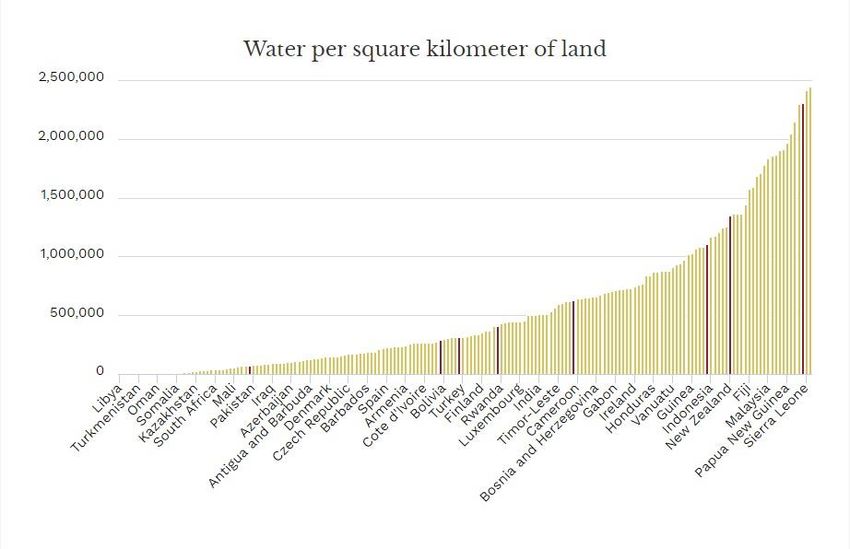
China has not dammed rivers with downstream neighbours, population pressures and huge demand
for irrigation and electricity is driving a change in policy.10

Critically, China was one of only three countries that refused to sign an international agreement on
cross-border rivers. They maintain that they have “indisputable territorial sovereignty over those
parts of international watercourses that flow through its territory”11. In other words, they say the
water belongs to them. This could lead to future regional tensions particularly as some of those
waterway’s flow through the other Asian superpower of India. Only time will tell how this plays out.

3: Water in a New Zealand context.

Here in New Zealand, we don’t have these same kinds of complex challenges to grapple with. We are
blessed to be a small island nation tucked away at the bottom of the pacific with no shared land
borders - and therefore no cross-border rivers. The freshwater issues we face are relatively benign
when compared to the global context, but we do still face issues.

New Zealanders have a special connection to our water. We don’t just rely on it to maintain our
health, produce our food, and generate our energy – it also underpins our outdoor lifestyle and our
clean, green international brand.12 Water is the lifeblood of our national economy.13 Each
individual’s relationship with water will be different depending on whether you live in a rural or
urban area and the recreational activities you participate in like swimming, kayaking, and fishing.

Most issues relating to water domestically tend to focus on water quality, rather than water quantity
and allocation – although that has begun to change recently. In 2018 the Government announced
their Essential Freshwater work programme setting out their plan for healthy water, fairly
allocated.14 The plans objectives are to:

     -   Stop further degradation of New Zealand’s freshwater resources and start making
         immediate improvements so that water quality is materially improving within five years.

     -   Reverse past damage to bring New Zealand’s freshwater resources, waterways, and
         ecosystems to a healthy state within a generation.

     -   Address water allocation issues, by working to achieve efficient and fair allocation of
         freshwater resources, having regard to all interests including Māori, and existing and
         potential new users.15

In September 2020, a new National Policy Statement for Freshwater Management was put in place
by the current Government to provide local authorities with direction on how to manage freshwater
under the Resource Management Act 1991.

10
   Ibid at page 164.
11
   Ibid.
12
   Fish & Game New Zealand. (2021). Water Storage and Irrigation.
13
   KPMG New Zealand. Water and people: The different ways we interact and use water. (2016).
14
   Ministry for the Environment. (2018). Essential Freshwater: Healthy Water, Fairly Allocated.
15
   Ibid.

                                                                                                   7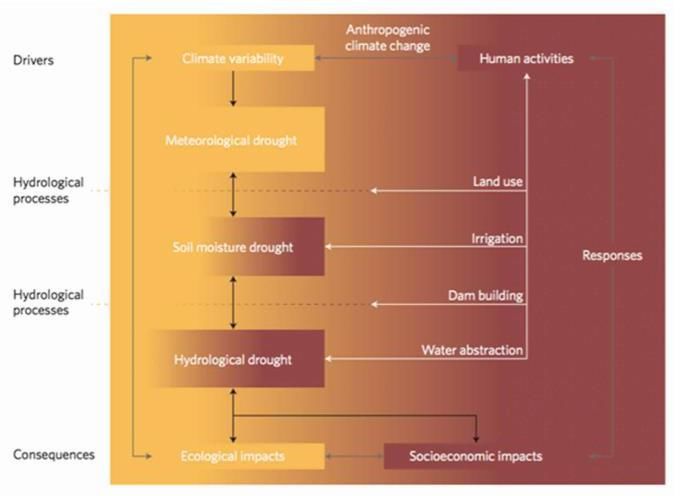
This was accompanied by new National Environmental Standards for Freshwater, stock exclusion
regulations, and water measurement and reporting regulations that local authorities are also
required to give effect to.16

These regulations directly address the first two objectives of the Essential Freshwater Programme;
however, they do not address the issue of freshwater allocation. It is anticipated that this issue will
emerge as a prominent topic this term of Parliament.

4: Allocation issues.

The challenge is that demand for water is increasing – whether that be for agriculture, horticulture,
industry, or municipal purposes.17 Just as the global population is increasing, so too is our national
population here in New Zealand.

Stats NZ projects our current population could grow from our current base of 5 million to 5.5 million
by 2025. The same projects suggest we could be close to 6 million by 2030. Taking a longer-term
view, our population may exceed 7 million by 2050, and 8.5 million by 2075.18

Our demand for water will only continue to increase as our population, and our agriculture-based
economy, continue to grow.19 We have already seen a huge increase in water demand from our
primary sector over the past two decades with our level of irrigated land increasing by
approximately 70% between 2002 and 2017.20

Demand for urban water use also continues to increase rapidly fuelled by the record rate of
population growth mentioned above and increased urbanisation. More than 86% of our population
now reside in urban areas.21

As these pressures continue to compound conversations have begun discussing whether we have an
appropriate water allocation framework in place to determine who has the right to take water, how
much they can take, and when they can take it. The current approach is essentially a ‘first in, first
served’ model.

There are also unresolved issues relating to Māori freshwater allocation and our obligations under
Te Tiriti o Waitangi (the Treaty of Waitangi). Historical circumstances around Māori land ownership,
such as fractional title and delayed treaty settlements, have impeded the development of land by iwi
and hapu and they have ended up at the ‘back of the queue’ when it comes to access to water.22

This raises questions of allocation equity, whether allocation has been made in the best interests of
the water body/environment, and whether we need to be allocating water to the highest value use
to help grow NZ Inc. At some stage we will likely need to revisit the way we ‘divide the pie’ or
consider growing the size of the pie so everyone can eat.

16
    Ministry for the Environment. (2020). About the National Policy Statement for Freshwater Management.
17
   Ministry for the Environment. (2017). Briefing to the Incoming Minister for the Environment: Water Issues.
18
   Stats NZ. (2020). National population projections: 2020 (base)–2073.
19
   Ministry for the Environment. (2017). Briefing to the Incoming Minister for the Environment: Water Issues.
20
   Ibid.
21
   Water New Zealand. (2017). New Zealand Water Consumer Survey Report. Page 14.
22
   Ministry for the Environment. (2017). Briefing to the Incoming Minister for the Environment: Water Issues.

                                                                                                            8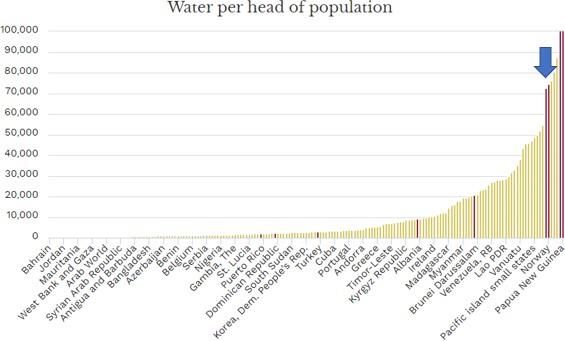
5: The importance of water for Māori.

For Māori, water is the essence of all life. It is water that supports all people, plants, and wildlife.

Māori assert their tribal identity in relation to particular waterways, rivers, and lakes that they have
an ancestral connection to whether that be as a means of travel or a source of mahinga kai.23
Although there are many different narratives of water across Māoridom, there is a universal
overarching acknowledgement and theme that water is tapu (sacred).

Te Ao Māori, the Māori world view, is underpinned by the importance of Whakapapa (genealogy)
that connects us all together.24 Relationships – whakapapa – are regularly cited as a foundational
principle of Te Ao Māori.25 This world view acknowledges the interconnectedness and
interrelationship of all living and non-living things.26 According to the Māori creation story:

“Water first manifests in this genealogy as Wainuiātea – the great expanse of water, the gathering of
all waters – who was the first partner of Ranginui, the Sky Father. Freshwater first appears as a
consequence of the parting of Ranginui, Sky Father, from Papatūānuku, Earth Mother. Their grief
and yearning for each other presents as the teardrops (rain) of Ranginui and the sighs (mist) of
Papatūānuku.”27

When considered in the context of the Māori creation story, and how water is positioned in that
narrative, it is easy to understand why water is viewed as being sacred. Water is a taonga (treasure)
of huge importance to Iwi who strongly believe they have a right of tino rangatiratanga (sovereignty)
and a responsibility of kaitiakitanga (guardianship).

6: Māori rights and interests in water.

Traditional Māori society did not have a concept of absolute ownership of resources; however, they
did have a system of customary title that conveyed rights of usage. Upon the signing of the Treaty of
Waitangi, New Zealand began operating under the common law tradition and constitutional
framework inherited from the English legal system.28

As part of that inherited common law system there is an existing doctrine of native title which holds
that ownership vested in the Crown is subject to existing native rights.29 Although a judgement in the
case of Wi Parata v The Bishop of Wellington (1877) ruled that there was no application for this title
in New Zealand30 this decision has since been overruled.

A Court of Appeal judgement in the case of Attorney-General v Ngati Apa (2003) ruled that the
arrival of British common law in New Zealand did not necessarily extinguish Maori customary title.
The question that has since arisen as to whether Maori customary title to fresh water remains the
property of Maori in accordance with the doctrine of native title.

23
   Te Runanga O Ngai Tahu. (2020). Freshwater Policy.
24
   Joy, M., Ngata, T., & Kim, N. (2018). Mountains to Sea. Adfo Books. Chapter 2.
25
   Ibid.
26
   Our land and water. (2020). Te Ao Māori.
27
   Joy, M., Ngata, T., & Kim, N. (2018). Mountains to Sea. Adfo Books. Chapter 2.
28
   Courts of New Zealand. (2020). Our court system.
29
   Ruru, Jacinta. (2010). Maori legal rights to water: Ownership, management, or just consultation? University
of Otago.
30
   Wi Parata v The Bishop of Wellington (1877) 3 NZ Jur (NS) 72.

                                                                                                             9
In 2012 the New Zealand Māori Council, along with other claimants, lodged two claims with the
Waitangi Tribunal arguing:

“Māori have unsatisfied or unrecognised proprietary rights in water, which have a commercial
aspect, and that they are prejudiced by Crown policies that refuse to recognise those rights or to
compensate for the usurpation of those rights for commercial purposes”. 31

In 2013 the Crown acknowledged to the Supreme Court that Māori have rights and interests in water
and was “open to discussing the possibility of Maori proprietary rights in water, short of full
ownership”32

It was argued that the best way forward was not to develop a framework for Māori proprietary
rights but to strengthen the role and authority of Māori in resource management processes.33

More recently Cabinet have put in place a new approach to the Crown/Māori relationship for
freshwater based on the following principles:

     -   The Crown and Māori have a key shared interest in improving the quality of New Zealand’s
         freshwater, including the ecosystem health of our waterways.

     -   The Crown and Māori have a shared interest in ensuring sustainable, efficient, and equitable
         access to and management of freshwater resources.

     -   The Crown acknowledges that Māori have rights and interests in freshwater, including
         accessing freshwater resources to achieve their fair development aspirations for under-
         developed land, however the Crown also acknowledges that existing users have interests
         that must be considered.

     -   The Crown will work with Māori and regional government to consider how, on a catchment-
         by-catchment basis, freshwater resources can be accessed fairly so as to achieve the
         development of under-developed land.

     -   No one owns freshwater – it belongs to everyone, and we all have a guardianship role to
         look after it. 34

We can expect the topic to be highly politicised and this will only be heightened by the return to
Parliament of the Māori Party with two MP’s and a strong and influential Māori Caucus within the
Labour Party who make up a quarter of the Cabinet and one fifth of Labours Caucus as a whole. The
issue has the potential to be just as controversial and divisive as the seabed and foreshore debate of
2004.

7: Who owns the water?

The principle that nobody owns freshwater is based on a well-established common law principle that
there is no property in flowing water. This common law tradition can trace its roots back to the

31
   Waitangi Tribunal. (2012) Wai 2358.
32
   New Zealand Maori Council v Attorney-General [2013] 3 NZLR 31
33
   Ruru, Jacinta. (2012). Māori Law Review: Māori rights in water – the Waitangi Tribunal’s interim report.
34
   Cabinet Paper. (2018). A new approach to the Crown/Māori relationship for freshwater. ENV-18-MIN-0032

                                                                                                          10
Romans who denied the possibility of private ownership of running water but did recognise rights
for the use of the resource and that regulation was needed to prevent over-exploitation.35
8: How much water does New Zealand actually have?
New Zealand is one of the most water abundant countries in the world by almost any measure.
On a precipitation (mm) per year basis, New Zealand is ranked at number 43 with 1732mm of rain.36
For comparison, the global average is 1155 mm per year. We ranked significantly higher than other
countries such as the UK (70th, 1220mm), USA (107th, 715mm), China (117th, 645mm) and Australia
(136th, 534mm).37
On a water per square kilometre of land basis we rank in the top 20 globally with 1,345,370 cubic
metres of renewable freshwater per square km.38 This means we have twice the freshwater density
of the United Kingdom and roughly four times the freshwater density of China, the USA, and the
global average. On average New Zealand receives about twenty times the volume of freshwater per
square kilometre of area than Australia does.39
Figure 1:
Source: https://berl.co.nz/our-foundation/freshwater-new-zealand-2-new-zealand-world-water
35
Getches, D.H. (1997). Water Law in a Nutshell. West Publishing, St. Paul, Minn. page 16.
36
Precipitation by country, around the world | TheGlobalEconomy.com
37
Ibid.
38
United Nations Food and Agriculture Organisation. (2020). AQUASTAT Database.
39
Sanderson, Kel. (2019). Freshwater in New Zealand (2) - New Zealand in a world of water.
11When examined on a water per head of population basis, New Zealand fares even more favourably.
We have the 7th highest amount of freshwater per head of population with 72,510 cubic metres of
renewable freshwater per square km.
To offer some perspective, New Zealand receives over 38 times the amount of water per person in
China, 32 times the amount of water per person in the United Kingdom, 8 times the amount of
water per person in the USA, and more than 3 times the amount of water per person in Australia. 40
Figure 2:
Source: https://berl.co.nz/our-foundation/freshwater-new-zealand-2-new-zealand-world-water
By any of the measures above it is clear that in terms of freshwater resource endowment New
Zealand receives our fair share – if not more – from the planetary quota. In light of the global
context and our apparent abundance of freshwater resources it could be argued that we have an
obligation to use it efficiently not only for our own benefit, but for the benefit of others on the
planet.41
9: How much water do we currently capture?
At face value it may seem like New Zealand is running out of water, but the reality is that water is
running out of New Zealand. We have more than enough freshwater resources to meet all of our
needs, we just fail to capture them for efficient, sustainable, strategic, and productive use.
New Zealand’s average volume of precipitation (rain, hail, sleet, and snow) between 1995 and 2014
was approximately 550,000 million cubic metres – although it should be noted that the annual
precipitation was less than this average in nine of the years between 2000 and 2014 due to changing
climate patterns.42
40
United Nations Food and Agriculture Organisation. (2020). AQUASTAT Database.
41
Sanderson, Kel. (2019). Freshwater in New Zealand (2) - New Zealand in a world of water.
42
Stats NZ. (2018). System of Environmental-Economic Accounting (SEEA) water physical stock account).
12Although our total precipitation may be 550,000 million cubic metres, we need to account for
evaporation as part of the usual hydrological cycle. In New Zealand approximately 20% of our water,
or 110,000 million cubic metres, evaporates after it lands.
The remaining 80%, approximately 440,000 million cubic metres, is left to flow down our rivers and
recharge our aquafers. Some of this will be captured as used, however the majority will eventually
flow out to sea.
The maximum annual volume of consented consumptive non-hydro freshwater takes by primary
production use, 2017-18 was 13,000 million cubic metres per year.43 This includes all water for
irrigation, drinking, industrial and other/multiple use takes. Non-consumptive hydropower consents
were excluded from this analysis because they do not alter average river flow as their rates of take
were generally equivalent to their rates of discharge back into the river network.44
Figure 3:
Note: Hydro use is generally non-consumptive and has been excluded from volume comparison.
Drinking use includes household, town, and rural water supply; industrial use includes commercial,
industrial, mining, and aquaculture uses; other and multiple uses includes frost protection, stock,
storage, and consents for multiple uses.
Source: https://www.stats.govt.nz/indicators/consented-freshwater-takes
Our largest maximum consented consumptive take is from irrigation at 7,450 million cubic metres
per year. This is followed by drinking water (2,160 million cubic metres), Other/multiple uses (2,020
million cubic metres) and industrial users (1,300 million cubic metres).
43
Stats NZ. (2020). Consented freshwater takes.
44
Booker, D, & Henderson, R. (2019). National water allocation statistics for environmental reporting; 2018.
13Based on the figures above New Zealand currently captures just under 3%45 of our water for
consumptive use. This highlights the huge opportunity that we have as a country to strategically
capture and productively use a greater percentage our freshwater resources. So, why aren’t we
capturing more?
Throughout the remainder of this paper, I will explore the opportunities increased water storage
presents for our country, the challenges and barriers that are preventing us from realising those
opportunities and provide some clear recommendations for the future.
The first immediate opportunity for increased water storage in New Zealand is to help protect
against the impacts of drought.
10: What is a drought?
Drought is a term that is often thrown around loosely in the media or at backyard barbeques to
describe any prolonged period of low rainfall, however this is an overly simplistic characterisation of
the issue that does not do it justice. Although at its simplest drought can be thought of as “a severe
decrease in water availability below what is expected”46 there is a more nuanced description for
these devastating weather event.
Droughts differ from other weather events, such as storms, because of their extended, rather than
short and sharp, effect.47 They can have a slow, gradual onset with no clear ‘start’ and often have no
clear ‘end’ either. They can occur over a single season or last several years as we recently saw in
Australia (2016 – 2020).
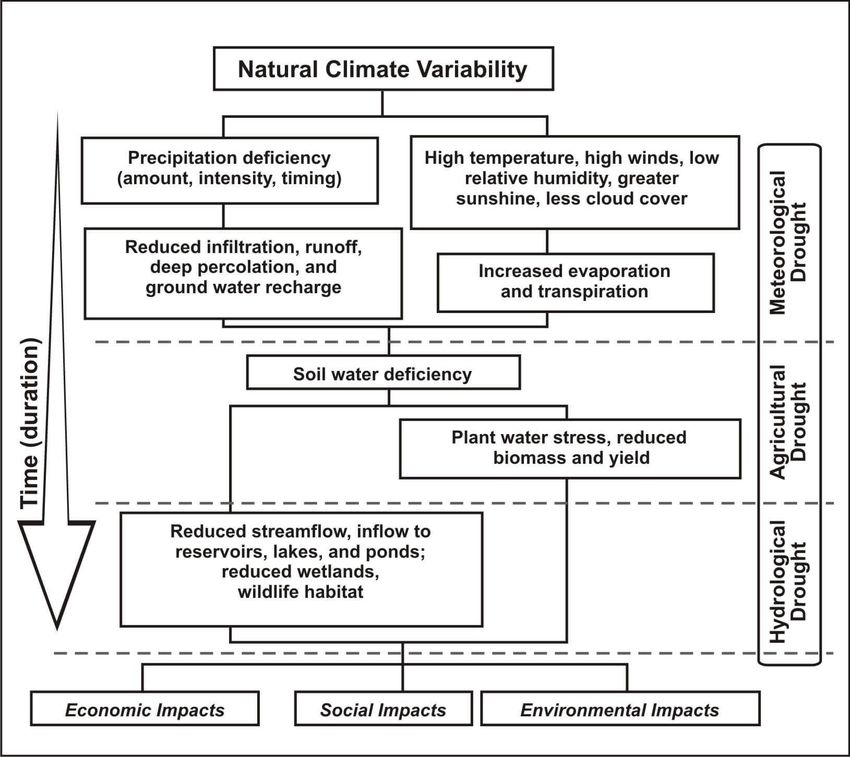
Droughts can be broadly categorised into four groups/types: meteorological, hydrological,
agricultural, and socioeconomic.48 The first three of these categories consider drought as a physical
phenomenon, whereas the last category considers the effect of the water deficit as it ripples through
socioeconomic systems.49
The following definitions have been taken from the US National Drought Mitigation Center: 50
Meteorological drought:
Meteorological drought is defined usually on the basis of the degree of dryness (in comparison to
some “normal” or average amount) and the duration of the dry period. Definitions of meteorological
drought must be considered as region specific since the atmospheric conditions that result in
deficiencies of precipitation are highly variable from region to region.
Agricultural Drought:
Agricultural drought links various characteristics of meteorological (or hydrological) drought to
agricultural impacts, focusing on precipitation shortages, differences between actual and potential
evapotranspiration, soil water deficits, reduced groundwater or reservoir levels, and so forth.
45
2.9545%.
46
Clark, A, Mullan, B., & Porteous, A. (2011). Scenarios of Regional Drought under Climate Change. NIWA.
47
Ibid.
48
Wilhite, D.A.; and M.H. Glantz. (1985). Understanding the Drought Phenomenon: The Role of Definitions.
Water International 10(3):111–120.
49
National Drought Mitigation Center. (2021). Types of Drought.
50 Ibid.
14Hydrological Drought:
Hydrological drought is associated with the effects of periods of precipitation (including snowfall)
shortfalls on surface or subsurface water supply (i.e., streamflow, reservoir and lake levels,
groundwater). The frequency and severity of hydrological drought is often defined on a watershed or
river basin scale. Although all droughts originate with a deficiency of precipitation, hydrologists are
more concerned with how this deficiency plays out through the hydrologic system.
Socioeconomic Drought:
Socioeconomic definitions of drought associate the supply and demand of some economic good with
elements of meteorological, hydrological, and agricultural drought. It differs from the
aforementioned types of drought because its occurrence depends on the time and space processes of
supply and demand to identify or classify droughts. Socioeconomic drought occurs when the demand
for an economic good exceeds supply as a result of a weather-related shortfall in water supply.
Figure 4:
Sequence of drought occurrence and impacts for commonly accepted drought types. All droughts originate from a deficiency of
precipitation or meteorological drought but other types of drought and impacts cascade from this deficiency.
Source: US National Drought Mitigation Center.51
51 Ibid.
1411: Other factors at play.
Generally, when people discuss drought, they are referring to meteorological drought, however
human activities can also have a significant impact on the water cycle. “Hydrology and soil moisture
are affected by how much water we extract or divert, how we use that water, and how we use the
land. Management of dams, changing land cover, and the choice of drainage type all have an
effect.52
Figure 5:
Reference: Drought system (Van Loon et al., 2016) Van Loon, A. F., Gleeson, T., Clark, J., Van Dijk, A.
I., Stahl, K., Hannaford, J., … Uijlenhoet, R. (2016). Drought in the Anthropocene. Nature Geoscience,
9(2), 89.
12: Our most recent drought (2020).
Concerns about drought and access to water were front of mind for many New Zealanders during
2020 – and it wasn’t just farmers and growers. Urban communities were also severely impacted.
Although the summer months of December through February are typically the driest months for
New Zealand, the 2019/20 summer season was exceptionally dry with much of the North Island
52
MOTU economic and public policy research. (2018). Drought and climate change adaptation: Impacts and
Projections.
16experiencing severe meteorological drought.53 Unfortunately the coming months did not bring any
reprieve and the effects continued to compound.
NIWA data shows that this was one of the most severe droughts to hit New Zealand since the early
20th Century54 with large swathes of the North Island and upper South Island, from Northland to
Canterbury, facing decreased rainfall and high temperatures.
The Waikato, one of our largest agricultural regions, saw 61 continuous days without rain. This was
one of the most severe droughts on record for the region.55 Similarly, the Far North went 65 days
without rain.56 The pattern was clear right across much of New Zealand – and it wasn’t just our
agricultural regions who were feeling the pressure.
An aerial photo of the Waikato region in February 2020. Photo credit: Sarah Fraser, NIWA.
13: A water crisis for our largest city?
Auckland, our largest city with a population of more than 1.7 million people57, also experienced
severe drought in 2020. The region went 77 continuous days without rain – their driest summer
since records began.
53
NASA Earth Observatory. (2020). New Zealand Browned by Drought.
54
NIWA Media Release. (2020). Auckland’s drought most extreme in modern times.
55
Ibid.
56
NIWA Media Release. (2020). Drought hits hard, far, and wide.
57
Infometrics. (2020). Auckland’s economic profile: Population growth.
17Rainfall is crucial for Auckland to replenish their dams, but between November 2019 and May 2020,
Auckland received 40 per cent less rain than normal.58Unfortunately, the high temperatures and lack
of rain lead to a predictable increase in water use across the city and by April the cities total volume
of water stored in their dams had dropped below 50 per cent for the first time in more than 25
years.59
Figure 6:
Source: https://www.watercare.co.nz/Water-and-wastewater/Drought-response
14: This had happened before (2013).
In 2013 we experienced extremely low levels of rain throughout the summer period leading to what
many described at the time as the worst drought in our national history.60 Throughout that summer
we saw record low rainfall for parts of Northland, Auckland, and the Bay of Plenty.
There was widespread dryness with less than a quarter of normal February rainfall in Gisborne,
Hawkes Bay, Taupo and the West Coast, and half normal rainfall in most other regions around the
country. 61 Much of New Zealand was experiencing widespread and severe drought by late February.
The situation continued to worsen with no rain in March and the first half of April.62 Rain finally
came in mid-April, but the damage had already been done.
58
Watercare. (2020). Drought response: The impact of the drought and our planned response.
59
Ibid.
60
Johnston, Kirsty. (2013). North Island drought worst in history.
61
NIWA. (2013). Climate Summary for February 2013.
62
NASA Earth Observatory. (2013). Drought in New Zealand.
18Just as Auckland had their municipal and domestic water supply threatened by the 2020 drought,
Wellington had a similar experience in 2013 and same very close to running out of domestic drinking
water.63
15: Drought in New Zealand.
As you will have seen above, drought isn’t a new concept to New Zealanders – particularly those
who work in our primary sector.
Statistics New Zealand and NIWA assessed the prevalence of different types of drought in New
Zealand at a select 30 sites over the last decade (2010 – 2019) using a Standardised Precipitation-
Evapotranspiration Index (SPEI) indicator which incorporates temperature and precipitation to
measure drought events.64
They found that 23 of the 30 sites spent at least 25 percent of the time in a hydrological drought
event with 5 sites having been in a drought event for at least 50 percent of the time (Dannevirke,
Kerikeri, New Plymouth, Reefton and Taupō).65
16: The impacts of drought.
Clearly New Zealanders have been living with regular periods of drought conditions for quite some
time as a recurring natural disaster. Droughts, unlike other forms of natural disaster, are long-term
events that may have chronic effects.66
Drought already has a far-reaching impact on New Zealand society and our activities including our
three waters (water supply, wastewater, and storm water)67, primary production (including
agriculture, horticulture, fisheries and forestry), industrial use in processing and manufacturing, and
electricity generation.68
It is entirely possible that increased prevalence of drought may be the climate change impact with
the greatest effect on our national economy69 with a recent report estimating the direct economic
loss as a result of drought in the decade 2007 – 2017 at $720 million.70
That being said, the impacts of drought are more than just financial and can affect our health in
several ways. Drought may reduce the availability of fresh food, increase the likelihood of
gastrointestinal infections such as cryptosporidiosis and giardiasis through a greater concentration of
63
Harrington, L. J., Gibson, P. B., Dean, S. M., Mitchell, D., Rosier, S. M., & Frame, D. J. (2016). Investigating
event-specific drought attribution using self-organizing maps. Journal of Geophysical Research: Atmospheres,
121(21).
64
Stats NZ. (2020). Drought Indicators.
65
Ibid.
66
Sartore, Gina-Maree. (2007). Drought and its effect on mental health. Australian Family Physician Vol. 36,
No. 12.
67
OECD. (2016). Mitigating Droughts and Floods in Agriculture: Policy Lessons and Approaches (OECD Sudies
on Water). Paris: OECD Publishing.
68
MOTU economic and public policy research. (2018). Drought and climate change adaptation: Impacts and
Projections.
69
Westpac. (2018). Westpac NZ: Climate Change Impact Report.
70
Frame, D, Rosier, S.,Carey-Smith, T., Harrington, L., Dean, S., Noy, I. (2018). Estimating financial costs of
climate change in New Zealand - An estimate of climate change-related weather event costs. Report for the NZ
Treasury.
19harmful organisms in groundwater and surface water sources, and lead to a rise in mental health
issues. 71
Drought can have a significant effect on mental health, “particularly for those in rural areas who rely
on rainwater for their livelihoods”72 who may see their crops fail or need to buy in additional and
likely expensive feed (if it is even available) to care for their animals.
The distress and trauma associated with natural disasters such as drought can affect entire
communities73 and according to the Royal Australian College of General Practitioners rural
communities are likely to suffer additional disadvantages.
17: Urban water supply.
As we have seen in earlier paragraphs, droughts don’t just impact on rural communities. Urban
water supply can also face challenges if they don’t have adequate storage capacity or alternate
supplies.
Domestic water supply in New Zealand is primarily treated town supply piped from rivers, lakes,
storage reservoirs and bores.74 In drought conditions this supply could be threatened leading to
significant risks:
“First and foremost, severe drought-related water supply which leads to water being cut off can lead
to dehydration and death. Further, drought can increase the burden of water related diseases, and
other diseases influenced by a lowered ability to keep conditions hygienic and sanitary”.75
18: Climate Change will increase the prevalence of extreme weather events.
Season and area averaged metrics suggest that we are increasingly likely to experience drought like
conditions similar to the summers of both 2013 and 2020 in the future.76 A number of studies
support this prediction of increased intensity, duration and spatial extent of droughts associated
with higher temperatures, decreased precipitation, and increased evaporation.77
Over the last century the average annual temperature in New Zealand has risen by one degree
Celsius and it is projected to keep climbing.78 They are forecast to rise another 0.8 degrees by 2040 –
and 1.6 degrees by 2090.79 Of course, these are modelled averages, but the message is clear none
the less.
71
EHINZ. (2020). Drought conditions in NZ over time.
72
Ibid.
73
Farberow NL. Mental health aspects of disaster in smaller communities. Am J Soc Psychiatry 1985;4:43–55.
74
MOTU economic and public policy research. (2018). Drought and climate change adaptation: Impacts and
Projections.
75
Bennett, H., Jones, R., Keating, G., Woodward, A., Hales, S., & Metcalfe, S. (2014). Health and equity impacts
of climate change in Aotearoa-New Zealand, and health gains from climate action. The New Zealand Medical
Journal (Online), 127(1406), page 16.
76
Harrington, L. J., Gibson, P. B., Dean, S. M., Mitchell, D., Rosier, S. M., & Frame, D. J. (2016). Investigating
event-specific drought attribution using self-organizing maps. Journal of Geophysical Research: Atmospheres,
121(21).
77
MOTU economic and public policy research. (2018). Drought and climate change adaptation: Impacts and
Projections.
78
Ministry for the Environment 2018. Climate Change Projections for New Zealand: Atmosphere Projections
Based on Simulations from the IPCC Fifth Assessment, 2nd Edition. Wellington: Ministry for the Environment.
79
Ibid.
20According to the Ministry for the Environment “drought frequency and intensity is projected to
increase across most of New Zealand as a result of climate change. Regions that are particularly at
risk are in the northern and eastern North Island and the eastern South Island”80
We cannot hide from the impacts of climate change, and as the global temperature rises so will
increase the risk of agricultural drought. 81 Equally, so too will the risk of flood. Climate change will
likely lead to an increase in both the frequency and intensity of extreme rainfall.
This is because a warmer climate increases the water-holding capacity of the air, and therefore
rainfall is like to be more intense. MfE reports suggest “the expected percentage increase in extreme
rainfall is around 8 per cent per degree Celsius of temperature increase”. 82 On those numbers,
assuming a 1 to 2°C temperature rise by the end of the century, we can anticipate that the intensity
of extreme rainfall in the future might increase by 8 to 16 per cent.
Projections show spring/winter rainfall increasing in the west of the country but decreasing in the
east and north. Summer will likely bring wetter conditions in the east and drier conditions in the
west than what we currently experience.83
It should be noted that some of these changes are not ‘coming’ – they have been with us for some
time. Over the last 50 years there have been observable changes to our weather patterns.
For example, New Plymouth, Wellington, and Whangarei have all seen increases in their winter
rainfall. Conversely, Dunedin and Kerikeri have experienced decreased summer rain.84
We have also seen changes to both soil moisture and ice volumes. Many of our soils have become
progressively drier and the volume of water held in our glaciers has reduced by 25%.85
80
Ibid..
81
Collins, M., R. Knutti, J. Arblaster, J.-L. Dufresne, T. Fichefet, P. Friedlingstein, X. Gao, W.J. Gutowski, T. Johns,
G. Krinner, M. Shongwe, C. Tebaldi, A.J. Weaver and M. Wehner, 2013: Long-term Climate Change: Projections,
Commitments and Irreversibility. In: Climate Change 2013: The Physical Science Basis. Contribution of Working
Group I to the Fifth Assessment Report of the Intergovernmental Panel on Climate Change [Stocker, T.F., D.
Qin, G.-K. Plattner, M. Tignor, S.K. Allen, J. Boschung, A. Nauels, Y. Xia, V. Bex and P.M. Midgley (eds.)].
Cambridge University Press, Cambridge, United Kingdom and New York, NY, USA.
82
Ministry for the Environment. (2010). Preparing for future flooding: A guide for local government in New
Zealand.
83
Ministry for the Environment. (2016). Climate change projections for New Zealand: atmosphere projections
based on simulations undertaken for the IPCC 5th assessment.
84
Ministry for the Environment & Stats NZ. (2017). New Zealand’s Environmental Reporting Series: Our
atmosphere and climate 2017 (Ministry for the Environment and Statistics New Zealand report).
85
Ibid.
21Fox Glacier is melting at an alarming rate. Photo credit: IAIN MCGREGOR/STUFF
These changes produce two seemingly contradictory effects: more intense downpours, leading to
more floods, yet longer dry periods between rain events, leading to more drought. In my view, this
only strengthens the case for capturing the water while we can and storing it for when we need it.
Although water storage may not be able to prevent meteorological drought from occurring,
capturing water when it is available and storing it for when it is not will certainly help blunt the
impacts and prevent us from feeling the agricultural, hydrological, environmental, economic, and
social impacts.
19: Electricity generation.
Another significant opportunity that increased water storage presents for New Zealand is the
opportunity to increase our levels of renewable electricity generation through hydro.
New Zealand’s share of renewable electricity generation is there third highest in the OECD, but our
levels fluctuate year-to-year, largely due to hydro-generation. 86 Our percentage of renewables
dropped from 84% in 2018 to 82.4% in 2019 due to low inflows – with the gap between supply and
demand being met by non-renewable sources like coal and gas.87
In order to drive down emissions the current Labour Government has announced an ambitious goal
of having 100 percent renewable electricity generation by 2030.88 This goal is ambitious for two
reasons: Firstly, because that is a significant increase from our current levels and secondly, because
demand for electricity is likely to increase substantially as we electrify other parts of our economy
such as transport and industrial heat.
86
Ministry of Business, Innovation & Employment. (2019). Energy in New Zealand 2020.
87
Ibid.
88
Ardern, Jacinda. (2020). 100% renewable electricity generation by 2030. New Zealand Labour
Party.
22This is a significant opportunity for increased water storage. While more than half of our electricity
current comes from hydro generation89 we still have significant untapped potential. While some of
our larger hydro damns have considerable storage capacity e.g., Benmore, Clyde, and Manapouri,
we actually have a relatively small storage capacity of 4TWh vs annual inflows of 24TWh.90
By increasing our hydroelectricity capacity, we could support New Zealand’s transition off fossil fuels
and towards a low emissions economy.
Although there has been some variability in terms of our hydro generation’s reliability due to
fluctuating water levels in the South Island and reduced river flow in times of drought for run-of-
river schemes like those in the Waikato, these risks may be able to be mitigated.
The increased prevalence of drought may be offset by increased instances of extreme rain and
rapidly melting ice glaciers increasing winter flows to our hydropower lakes. The net effect would
likely flatten the annual cycles of flows and generation capacity.91
It should also be noted that hydroelectricity is not the only renewable energy source in New Zealand
that is highly dependent on water supply. Over 17% of our electricity is generated by non-
consumptive thermal power stations that rely on water as a coolant that is then discharged back into
our waterways.92
20: Opportunities for land use change.
Land use flexibility and land use change have underpinned the success of New Zealand’s primary
sector since its inception. It may not always be overtly visible in a broad pattern, but it is always
occurring, often at the regional level, as new and more profitable ways to farm arise whether they
be driven by markets, climate, water, or any other factor.93
Recent examples include the largescale conversion from dry stock farming in Canterbury and
Southland during the early 2000’s or the continued conversation to horticulture e.g., kiwifruit and
avocados in the Bay of Plenty, or the prevalence of grapes in Marlborough. All of these things
happened because an individual saw an opportunity and acted on it.
Land will always over time move to its best use as determined by the potential productivity, and
therefore the potential profitability.94 On this basis, “landowners looking to maximise their returns,
or profit, will select land use according to the quality of their land, with the best quality land being
89
EECA. (2016). Energy use in New Zealand: Renewable energy resources - Hydroelectricity. Energy
Efficiency and Conservation Authority: Te Tari Tiaki Pūngao.
90
MOTU economic and public policy research. (2018). Drought and climate change adaptation: Impacts and
Projections.
91
Renwick, J., Mladenov, P., Purdie, J., McKerchar, A., & Jamieson, D. (2010). The effects of climate
variability and change upon renewable electricity in New Zealand. In Climate change adaptation in
New Zealand: Future scenarios and some sectoral perspectives (pp. 70–81).
92
EECA. (2016). Energy use in New Zealand: Renewable energy resources - Hydroelectricity. Energy Efficiency
and Conservation Authority: Te Tari Tiaki Pūngao.
93
Thorrold, B.S. 2010. The future landscape of New Zealand Agriculture. Proceedings of the New Zealand
Grassland Association. 72: LXIII-LXVI.
94
Anastasiadis, S., Kerr, S., Zhang, W., Allan, C., & Power, W. (2014). Land Use in Rural New Zealand: Spatial
Land Use, Land use Change, and Model Validation. Motu Working Paper 14-07. Motu Economic and Public
Policy Research. Wellington.
23used for the most intensive, profit generating use, and the poorest quality land being less
productive”.95
21: Factors that drive land use change.
There are a number of factors that drive land use change, including but not limited to:
Biophysical factors: Soil type, topography, climate, and availability of water.
Economic factors: comparative profit, proximity to the market, access to labour, and access to
infrastructure e.g., irrigation
Societal factors: Regulation, social license, changing diets.
22: Current pressures.
Pastoral farmers are increasingly coming under pressure from both regulators and society in general
to reduce their environmental footprint. The Zero Carbon Act will require a 10% cut to biogenic
methane levels by 2030, and between 24 and 47% by 2050.96 Similarly, the new National Policy
Statement for Freshwater Management has put in place tough new regulations including national
bottom lines of 2.4 milligrams of nitrate-nitrogen per litre.97
These externalities relating to greenhouse gases and water are rapidly starting to be addressed by
Government, driven by public expectation, and as a result they are being priced into land use
decisions as one of many ‘market’ factors to be considered.98
Both of these environmental regulatory drivers are likely to drive land use change within New
Zealand.99 Recently modelling suggests there are limited opportunities to change systems on farm to
reduce emissions100 raising the likelihood that land use change to both forestry and horticulture will
emerge as a mitigation strategy. Although the underlying action is ‘improving environmental
outcomes’ the true driver will be the economic cost of non-compliance.101
The Independent Climate Change Commission’s recently released draft advice to Government on
setting emissions budgets supports this assessment with their modelled scenario including future
land use change from livestock agriculture into horticulture and exotic forestry as a mechanism to
reduce methane emissions.102
95
Anastasiadis, S., Kerr, S., Zhang, W., Allan, C., & Power, W. (2014). Land Use in Rural New Zealand: Spatial
Land Use, Land use Change, and Model Validation. Motu Working Paper 14-07. Motu Economic and Public
Policy Research. Wellington.
96
Climate Change Response (Zero Carbon) Amendment Act 2019, S5Q(1)(b).
97
National Policy Statement for Freshwater Management 2020, page 45.
98
AgFirst. (2017). Analysis of drivers and barriers to land use change. (A report prepared for the Ministry of
Primary Industries), page 38.
99
Ibid at page 34.
100
Reisinger, A., Clark, H., Journeaux, P., Clark, D., & Lambert, G. 2017. On-farm options to reduce
agricultural GHG emissions in New Zealand. NZAGRC report to the Biological Emissions Reference
Group.
101
AgFirst. (2017). Analysis of drivers and barriers to land use change. (A report prepared for the Ministry of
Primary Industries), page page 37.
102
Climate Change Commission. (2021). 2021 Draft Advice for Consultation, page 174.
24They specifically mooted the idea of reducing dairy, sheep and beef numbers by around 15% from
2018 levels by 2030 103 and transforming a small amount of dairy land into horticulture, at a rate of
2,000 hectares per year from 2025.104
Although conversion from dairy to horticulture could reduce biogenic emissions per hectare, the
Commission did specifically note that this could lead to other environmental challenges such as
deteriorating water quality as a result of increased use of fertiliser, and consequential nitrogen and
phosphorus losses.105 Of course, the nutrient losses would vary depending on the crop, location, soil,
weather and how the land is managed.106
It should be noted that this report is the Commissions advice to Government and is not Government
policy. If the Government chooses to implement the advice, they will need a policy mechanism to
drive it.
23: Increased water storage as an enabler.
In offering their advice the Commission expressly recognised that increasing the area of horticulture
in New Zealand would significantly increase demand of water - particularly in a warming global
climate. As such, any increased need for water would need to be weighed up when considering
converting to horticulture as a climate action.107
The Commission knew that the availability or otherwise of water for irrigation could be the major
driver, or barrier, for land use change. This is because many of the other drivers, such as return per
hectare, are already in favour of conversion.
Figure 7:
EBIT per hectare from differing land uses.
Of course, not everyone can convert to horticulture and nor should they, but for some landowners
who have the right climate, soil, topography, and access to the capital required to convert – water
may be the last ingredient needed to unlock greater profits. This all comes back to the principle
discussed earlier in the paper that over time, land will always migrate to its best use.
24: Highly productive land.
Much has been made in recent years regarding ‘highly productive soils’, or rather, highly productive
land (rather than ‘soil’) given its focus is on the capability of ‘land’ for a certain use. There is a
103
Ibid.
104
Ibid at page 65.
105
Ibid at page 101.
106
Ibid.
107
Ibid.
25general acceptance that there is a need to protect this highly productive land for future primary
production.
The reference to ‘land’ and not ‘soil’ is in recognition of the fact “there are other factors in addition
to soil that determine the productive capacity of land for primary production. These include factors
like climatic conditions and water availability, as well as proximity to transport infrastructure and
labour”. 108
The issue has largely been brought to a boil as a direct result of the immense pressure coming on
local growers in areas like Pukekohe, south of Auckland, as a result of increased and rapid urban
expansion. 109
Pukekohe’s soil and climate conditions are well suited to food production and are located
conveniently close to Auckland, our largest population centre, for transportation. Unfortunately, it is
this same close proximity to Auckland city that is threatening those soils.
Auckland’s population is forecast to grow from 1.7 million people today to 2 million people in the
next 30 years.110 The city will need land available for development to house this growing population,
but it will also need productive lands to be well utilized in order to sustain them. We also have other
competing pressures like our national goal of doubling our agricultural exports by 2025.111
25: A strategic opportunity?
Increased water storage in the Northland region may present a strategic opportunity to relieve some
of the pressure Pukekohe is facing, reduce risks associated with extreme weather events or
biosecurity incursions, and enable another large food producing area in close proximity to Auckland.
Northland does have some high productive volcanic soils that are currently underutilized such as
Papakauri Silt Loam and Waimate North Heavy Silt Loam. These soils can be found in the Whangarei,
Kaikohe and Kerikeri districts.112
Although these soils may not be to the same standard as those in Pukekohe, but they are still high-
quality soils none the less. They are currently largely devoted to pastoral farming; however, they are
also highly suited to vegetable cropping and horticulture113 provided there is adequate supply of
water.
As it currently stands Northland’s primary sector is largely dominated by both pastoral farming and
forestry.
108
Ministry for Primary Industries. (2019). Valuing highly productive land.
109
Ibid.
110
Auckland Council. (2018). Soil Information Inventory: Patumahoe and related soils.
111
Ibid.
112
Molloy, Les. (1988). Soils in the New Zealand landscape: the living mantle. Wellington: Mallison Rendel in
assoc. with the New Zealand Society of Soil Science.
113
Ibid.
26You can also read