October 2021 Investor Presentation - Evolution Petroleum
←
→
Page content transcription
If your browser does not render page correctly, please read the page content below
October 2021 Investor Presentation
Disclaimer
     Forward Looking Statements
     This presentation contains “forward-looking statements.” Such statements may relate to capital expenditures, drilling and exploitation
     activities, production efforts and sales volumes, Proved, Probable, and Possible reserves, operating and administrative costs, future
     operating or financial results, cash flow and anticipated liquidity, business strategy and potential property acquisitions. These forward-
     looking statements are generally accompanied by words such as “estimated”, “projected”, “potential”, “anticipated”, “forecasted” or
     other words that convey the uncertainty of future events or outcomes. Although we believe the expectations and forecasts reflected in
     these and other forward-looking statements are reasonable, we can give no assurance they will prove to have been correct. These
     statements are based on our current plans and assumptions and are subject to a number of risks and uncertainties as further outlined in
     our Forms 10-K and 10-Q. Therefore, the actual results may differ materially from the expectations, estimates or assumptions expressed
     in or implied by any forward-looking statement and we undertake no obligation to update these estimates for events after this
     presentation.

     Cautionary Note Regarding Oil and Gas Reserves
     The United States Securities and Exchange Commission (“SEC”) rules allow oil and gas companies to disclose not only Proved reserves,
     but also Probable and Possible reserves that meet the SEC’s definitions of such terms. We disclose Proved, Probable and Possible
     reserves in our filings with the SEC and this presentation. Estimates of Probable and Possible reserves are by their nature more
     speculative than estimates of Proved reserves and are subject to greater uncertainties, and accordingly the likelihood of recovering
     those reserves is subject to substantially greater risk. Our reserves as of June 30, 2021 were estimated by DeGolyer and MacNaughton,
     an independent petroleum engineering firm.

     Non-GAAP Reconciliation - Adjusted EBITDA
     Adjusted EBITDA is a non-GAAP financial measure that is used as a supplemental financial measure by our management and by
     external users of our financial statements, such as investors, commercial banks and others, to assess our operating performance as
     compared to that of other companies in our industry, without regard to financing methods, capital structure or historical costs basis. It
     is also used to assess our ability to incur and service debt and fund capital expenditures. Our Adjusted EBITDA should not be
     considered an alternative to net income (loss), operating income (loss), cash flows provided by (used in) operating activities or any
     other measure of financial performance or liquidity presented in accordance with U.S. GAAP. Our Adjusted EBITDA may not be
     comparable to similarly titled measures of another company because all companies may not calculate Adjusted EBITDA in the same
     manner. The Company defines Adjusted EBITDA as net income (loss) plus interest expense, income tax expense (benefit), depreciation,
     depletion and amortization (DD&A), stock-based compensation, other amortization and accretion, ceiling test impairment and other
     impairments, unrealized loss (gain) on change in fair value of derivatives, and other non-cash expense (income) items.

2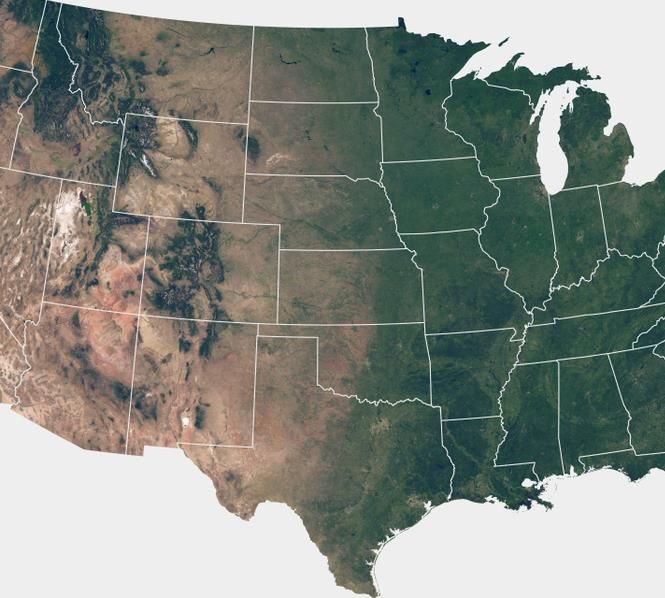
NYSE: EPM

     Company Overview
       NYSE American                              EPM                                                               EPM Asset Locations
       Shares Outstanding (9/10/2021)             33.51 MM

       Share Price (9/23/2021)                    $5.19

       Market Cap (9/23/2021)                     $173.9 MM
                                                                                                               Hamilton
                                                                                                                Dome
       Common Dividend (1Q 2022)                  $0.30 per share (annualized)

       Dividend Yield (9/23/2021)                 5.8%

       EPM Net Production (4Q 2021)               ~4,400 BOEPD

                                                  23.4 MMBOE                                                                     Barnett                Delhi
       Proved Reserves1 (FYE 2021)
                                                  (92% PDP)                                                                       Shale
       Probable Reserves1 (FYE 2021)              3.3 MMBOE

                                                                                                                                                  EPM Headquarters
       Net Debt2 (4Q 2021)
                                                  $0.0                                                                                              Houston, TX
       ($26 MM available capacity3)
       EBITDA4 (4Q 2021)                          $4.7 MM

    Notes:
    1. Reserves from June 30, 2021 Fiscal Year End Reserves Report. Reserves determined using 6:1:1 ratio.
    2. Net debt represents the Company's outstanding debt of $4 million less cash and cash equivalents balance of $5.3 million as of 6/30/2021.
3   3. $30 MM borrowing base with $4 MM borrowed at 6/30/2021.
    4. See Non-GAAP Reconciliation disclosure in Appendix.
NYSE: EPM

    Investment Highlights

        1       Attractive Dividend Supports Total Shareholder Return

        2       Solid Financial Position

        3       High Quality, Low Risk, Long-lived Asset Base

        4       Consistent Track Record of Generating Cash Flow

        5       Executing a Disciplined Growth Plan

4
Per Share Returned to
                                                                                                                    Shareholders Since

                                                                                                             2.34
                                                                                                        $
    Histor y of Accretive Acquisitions Suppor ting Dividend                                                         December 2013

    Timeline & Key Statistics

                                                           77
                                                   $

     5.8
    Current Dividend Yield

                                %
        (Annualized 1Q22)

                                                                               Million
                                                                In Dividends Returned to Shareholders Since
                                                                              December 2013

                                         2003- September                                                           July November        May
                                                            2006              2009           2013
                                         2004    2003                                                              2019   2019          2021

                                                                                      Began paying quarterly                    Acquisition of interest
                                                                                                                 New CEO
                                                                                     dividend to shareholders                    in Barnett Shale in
                   Company is founded in 2003          Purchased royalty                                                            North Texas
                  and went public as Natural Gas      interest in Delhi for
                                                           $1.5 MM.                   CO2 injection begins
                        Systems in 2004
                                                       Sold Delhi working                at Delhi Field

               Acquisition of interest in Delhi      interests to Denbury                Acquisition of interest in Hamilton
                Field in northeast Louisiana         for $50MM cash and                      Dome field in Wyoming
                 from Denbury Resources               agreement to install
                                                        CO2 flood with
                                                     reversionary working
5
                                                            interest
Q4 FY 2021
Recent Highlights
✓ Produced 4,378 net BOEPD during Q4, up 156% over Q3 due to Barnett Shale
acquisition
✓ Generated Q4 EBITDA1 of $4.7 million compared to $2.5 million in Q3
✓ Increased dividend by 50% over Q3 by declaring a $0.075 per common share
dividend for Q1 of 2022
✓ Closed the acquisition of 79 BCFE of non-operated, long-life liquids rich natural
gas assets in the Barnett Shale in May 2021
✓ Funded all operations, development capital expenditures, and dividends out of
operating cash flow
✓ Increased FYE 2021 proved reserves to 23.4 MMBOE, up 129% from 10.2
MMBOE at FYE 2020
6 Notes:
1. See Non-GAAP Reconciliation disclosure in Appendix.Pillars of Success
Business & Portfolio Investment Strategy
Our Two Pillars:
Pay Dividend Low Leverage
Return capital to shareholders Maintain strong balance sheet
$81 MM1 in cash and share Keep net leverage of < 1x
buybacks since 2013
Our Keys to Success:
✓ Long life, low decline assets ✓ Low maintenance capex
(average ~15% of EBITDA)
✓ Low geologic and operational risk ✓ High margin
7 Notes:
1. Includes dividends ($77 MM) through 9/30/2021 and shares repurchased ($4 MM) through 6/30/2021.E&P Phases of Ownership, Development & Cash Flow
Life Cycle of Oil & Gas Assets
Proof of Concept Development
I • High Risk, High Capex III • Low Risk, Capex Intensive
• Private Equity • Majors
Delineation Mature Cash Flow Harvest
II • Step-out Risk IV • Low Risk, Low Capex
• Independent Producers • EPM’s Business Model – Long Tail Production
Proof of Delineation Development Mature: Cash Flow Harvest
Concept High Margins
Low, Repeatable Risk
Large, Regular Capex
High Risk Step-Out Risk
High Capex High Capex Low Risk
Low Capex
Daily Production
Long Life & Low Decline Production Profile
Cash Flow
Private Independent
Equity Majors
Producer
2017 2019 2021 2023 2025 2027 2029 2031 2033 2035 2037 2039 2041 2043 2045 2047 2049
DECREASING RISK PROFILE & CAPEX REQUIREMENTS
8D i s c i p l i n e d G r o w t h & Ta r g e t e d A s s e t s
M&A Strategy
Target Asset Locations
• Long-lived reserves with value dominated by proved developed
producing cash flow Hamilton Dome
ND
~620 Net Acres
• Accretive to cash flow and supportive of dividend strategy
WY
• Low ongoing capital investment
UT
• Locations with reasonable market access and stable regulatory
Delhi
environment ~3,600 Net Acres
OK
NM
• High margin:
• Efficient operations economic at existing commodity prices TX LA
Barnett Shale
~21,000 Net Acres EPM Asset
• Short runway to incremental cash flow Locations
Target Asset
Acquisitions Supporting Dividend Coverage
Locations
Maintenance
CAPEX Future Acquisition 2 Future Acquisition 3
Cash Flow By Asset
Future Acquisition 1
Dividend
Base Production
9I n a ug u r a l C o r p o r a t e S u s t a i n ab i l i t y R e p o r t W i l l B e I s s u e d Fa l l 2 0 2 1
Committed to Long Term Corporate Sustainability
Evolution works to have a positive impact and presence in the
communities and environments in which we live and do business
We are committed to developing and producing energy resources in
environmentally, socially, and ethically respectful and responsible ways
Environmental
• Partnering with operators that share a common goal of upholding high standards of environmental
stewardship, achieving compliance with regulatory requirements, and minimizing the impact on the
environment
• Leveraging enhanced recovery methods to extend the life of hydrocarbon reservoirs, which reduces
the environmental footprint vs establishing new operations
Social
• Strong focus on employee engagement through open communication across all levels of the
organization
• Providing a safe and secure workplace, utilizing policies and procedures that are intended to protect
the health and wellbeing of our employees and other stakeholders
• Fostering, cultivating, and preserving a culture of diversity, equality, and inclusion
• Making a positive impact in and supporting the communities in which we live and work
Governance
• Promoting sound governance practices that lead to good decision making
• Ensuring we conduct our business with honesty and integrity in accordance with the highest legal
and ethical standards
• Driving these fundamentals and clear accountability across our business is key to our long-term
success and sustainability
• Board oversight of ESG practices and policies
10Our Assets 11
23.4 MMBOE Net Proved Reser ves

      FYE 2021 Reserves
                 Proved Reserves1 By Asset, 23.4 MMBOE                                                                         Proved Reserves By Commodity
                             Hamilton Dome PDP

                                       1,851
                                                                                                                                            NGL
                                                                                                                                            29%          Oil
                                                                                          Delhi PDP                                                     36%
                   Barnett PDP            Delhi Proved
                                                                                            6,663
                     13,059                  8,476                                                        Delhi PUD
                                                                                                            1,813                                 Gas
                                                                                                                                                  35%

                                                             Net Oil                     Net Gas                     Net NGL               Net MBOE
                                                               MBO                         MMCF                         MBBL                  6:1:1
                                 Proved                        8,420                       48,571                       6,872               23,386
                                 Probable2                     2,540                         0                           743                 3,284
                                 Possible2                     2,506                         0                           314                 2,820
                                 3P                           13,466                       48,571                       7,929               29,490
                                       ✓ Substantial Increase in Proved Reserves from FYE2020
                                 ✓ Using FYE21 SEC Pricing of $49.72 / BBL & $2.46 / MMBTU
     Notes:
12   1.  Based on DeGolyer & MacNaughton FYE2021 reserves report.
     2.  Probable and Possible Reserves involve considerably more risk of recovery than Proved Reserves – see cautionary note on page 2.
Low Decline, EOR CO2 Flood
Delhi Field
Overview NGL Plant
• Delhi Field is in northeast Louisiana in Franklin, Madison and Richland parishes
• Produces out of the Tuscaloosa and Paluxy (Holt-Bryant) reservoirs
• Produced over 210 MMBO since it was discovered in the 1940s
• CO2 enhanced oil recovery (EOR) development began in 2009 by Denbury
• CO2 injection allows improved mobility of the oil from the reservoir
Highlights
• No Louisiana oil severance taxes (at 12.5%) until payout
• Delhi crude price based on Louisiana Light Sweet (LLS) pricing which is
historically a premium to WTI; ~80% of production is oil
• Oil transported by pipeline from field – no current capacity constraints
• Rich mix of heavier NGLs, or 60% C4 + C5
• Third party reserve report demonstrates remaining field life of over 20 years1
• 418 MMBO of gross original oil in place (OOIP)
Statistics 2010 2009 2012-2013 Town of Delhi
Operator Denbury Resources
Phase V
Avg Daily Prod (4Q 2021) ~5,100 gross / ~1,340 net BOEPD
Unquantified Future Phase IV
Acreage (100% HBP) ~13,600 gross / ~3,600 net acres Expansion
Phase I
EPM Average WI % / Avg. NRI % 23.89% / 26.22%
Phase II
Pricing Louisiana Light Sweet (LLS) Unquantified future expansion
in downdip thinner reservoirs
Commodity Split ~ 80% Oil, ~ 20% NGLs Phase III & eastern phase – dependent
Proved
2018 Undeveloped on oil price
PDP Reserves1 ~ 6.7 MMBbls 2015-2017
PUD Infill (“PUD”)
Infill Drilling in Phases
PDP Reserves/Production (R/P)1 ~ 13 years 2011 Program
I & II
13 Notes:
1. Based on DeGolyer & MacNaughton FYE2021 reserves report.Minimal Incremental Capital Required for Probable Reser ves
Delhi Reserves
Proved and Probable Reserves CO2 Flood Life
• Proved Reserves1 represent a 90% probability of exceeding stated amounts • CO2 flood life is defined by the number of hydrocarbon pore
• Probable Reserves1 consider improved recovery rates volumes of CO2 injected into the reservoir
• Represent a 50% probability of exceeding stated amounts • Typical lifetime is ~5-6 hydrocarbon pore volumes
• Addition of Probable Reserves increases the reserve base by over 30%: • Delhi is early in CO2 flood life
• 8.5 MMBOE net Proved Reserves • Approximately 1.5 hydrocarbon pore volumes of CO2 have been
injected into the Holt-Bryant reservoir to date
• 3.3 MMBOE net Probable Reserves
• De minimis capex is required for Probable Reserves
18%
16% Probable Reserves
(50% Probability of Recovery)
Oil Recovered (%OOIP)
14%
Delhi Currently in Early
12%
Life of CO2 Flood
Proved Reserves
10%
(90% Probability of Recovery)
8%
6%
4%
2% Total Delhi Field 2021 YE PROV 2021 YE PROB
0%
0.0 1.0 2.0 3.0 4.0 5.0 6.0
CO2 Injected (Hydrocarbon Pore Volume)
Notes:
14 1. Reserves as of 6/30/2021. Probable Reserves involve considerably more risk of
recovery than Proved Reserves – see cautionary note on page 2L o w D e c l i n e , H i s t o r i c a l Wa t e r f l o o d
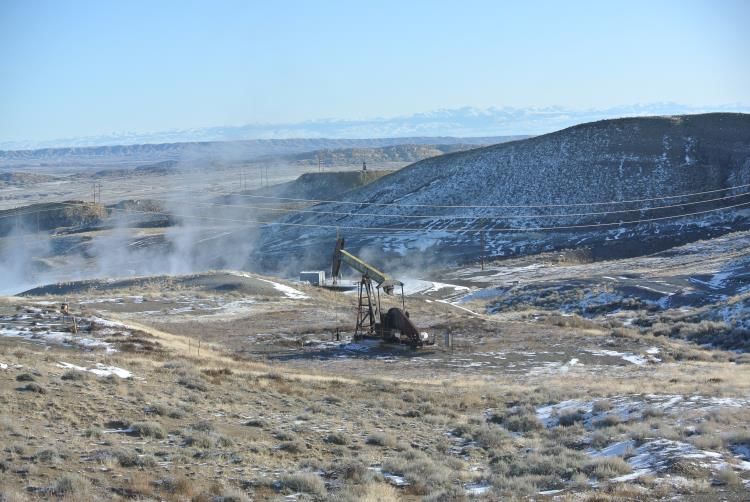
Hamilton Dome Field
Overview Historical Net Production
• Hamilton Dome field is located in the northwestern Wyoming Big
10,000
Horn Basin in Hot Springs County
• Discovered in 1918 and primarily developed from the Phosphoria
~3.4% Yearly Decline
and Tensleep reservoirs (~3,000’ depth)
Since 1974
• Merit Energy purchased the asset in 1995
• The field has been produced via waterflood since the 1970s
BOEPD
1,000
Highlights
• Long life, low decline reserves - premier field having produced
over 160 MMBO over 100 years
• 100% Oil production - averaging low single-digit decline rates ~0.8% Yearly Decline
• Top tier operator - Merit Energy operates this field as they have Since 2016
for 20+ years 100
74 77 80 83 86 89 92 95 98 01 04 07 10 13 16 19
Statistics Operations Year
Operator Merit Energy Company
Avg. Daily Prod (4Q 2021) ~2,040 gross / ~400 net BOPD
Acreage (100% HBP) ~3,160 gross / ~620 net acres
EPM Average WI % / Avg. NRI % 23.51% / 19.70%
Pricing Western Canadian Select (WCS)
Commodity Split 100% Oil
PDP Reserves1 ~ 1.85 MMBbls
PDP Reserves/Production (R/P)1 ~ 12.5 years
15 Notes:
1. Based on DeGolyer & MacNaughton FYE2021 reserves report.Acquisition Over view
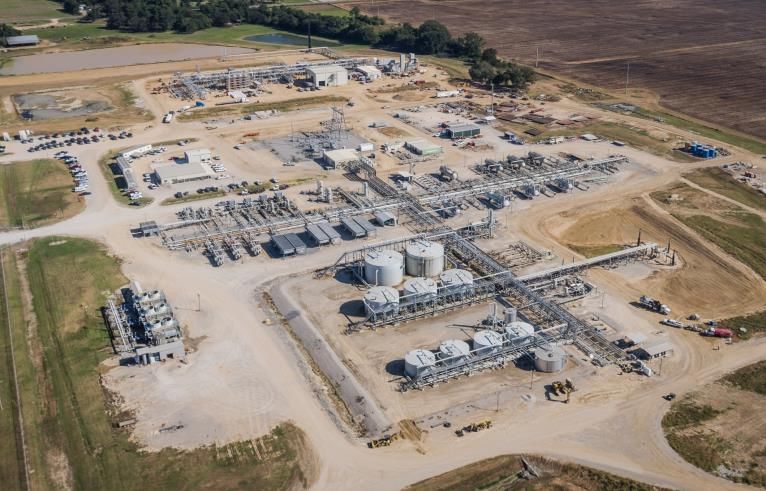
North Texas Barnett Shale
Transaction Summary Location
• Evolution has acquired a non-operated interest in Barnett Shale
natural gas assets from Tokyo Gas Americas, Ltd. (“Tokyo Gas”) for
$18.3MM, net of preliminary purchase price adjustments
N
• Closed on May 7, 2021 with an effective date of January 1, 2021
Highlights
• Long-lived PDP reserves1, < 10% base decline
• ~35% natural gas liquids content
• Majority of wells completed between 2007-2010
• Mature, low decline production with potential upside workover
opportunities
~21,000
• 100% HBP acreage primarily in rural areas allowing for more
Acres
efficient operations
Statistics
Operator Blackbeard Operating, LLC1
Est. Current Net Production ~16 MMCFD, ~1.4 MBbls/D NGL
Acreage (100% HBP) ~21,000 net acres
EPM Average WI % / Avg. NRI % 17% / 14%
Pricing Access to premium Gulf Coast gas markets
Commodity Split ~65% Gas, ~35% Liquids (NGLs) 0 10 20
PDP Reserves2 ~48.5 BCF & ~5 MMBbls MILES
PDP Reserves/Production (R/P)2 ~ 9 years
Notes:
1. Blackbeard Operating, LLC closed the sale of its Barnett assets and operatorship to Diversified Energy Company PLC. in July 2021, but is still operating under a
16 transition services agreement
2. Based on DeGolyer & MacNaughton FYE2021 reserves report.Low Decline and Continued Growth
Historical Net Production
10,000
Acquisition of Hamilton Acquisition of North Texas
Dome1 Barnett Shale2
Additional ~450 BOEPD Additional ~4,000 BOEPD
BOEPD (6:1:1)
Working interest Planned facility
1,000 reversion at Delhi downtime at Delhi
100
7/1/2014 7/1/2015 7/1/2016 7/1/2017 7/1/2018 7/1/2019 7/1/2020 7/1/2021
Notes:
17 1. The Hamilton Dome acquisition closed on November 1, 2019 with an effective date of October 1, 2019.
2. The North Texas Barnett Shale acquisition closed on May 7, 2021 with an effective date of January 1, 2021.Company Performance 18
C o n s i s t e n t l y Pa i d D i v i d e n d s T h ro u g h C o m m o d i t y C y c l e s

                Common Stock Dividends vs. Average Oil Price
                                    $0.12                                                                                                    $120
                                              Cumulative Payout Dec’13 – Sep’21
                                    $0.10              $77MM ($2.34/share)                                                                   $100
     Quarterly Dividend Per Share

                                    $0.08                                                                                                    $80

                                                                                                                                                    WTI Average Oil Price
                                    $0.06                                                                                                    $60

                                    $0.04                                                                                                    $40

                                    $0.02                                                                                                    $20

                                    $0.00                                                                                                    $0
                                            Dec-13
                                            Mar-14

                                            Sep-14

                                            Dec-15

                                            Dec-16

                                             Jun-18

                                             Jun-19
                                            Sep-17

                                            Dec-18

                                            Dec-19

                                            Dec-20
                                             Jun-14

                                            Dec-14
                                            Mar-15
                                             Jun-15
                                            Sep-15

                                            Mar-16
                                             Jun-16
                                            Sep-16

                                            Mar-17
                                             Jun-17

                                            Dec-17
                                            Mar-18

                                            Sep-18

                                            Mar-19

                                            Sep-19

                                            Mar-20
                                            Jun-20
                                            Sep-20

                                            Mar-21
                                             Jun-21
                                            Sep-21
                                                                                          Quarter Ended
                                                            Common Stock Dividends                         WTI EIA Avg Price for Quarter 1
19      Note:
        1. WTI average oil price represents the average of daily close prices for WTI within the associated quarter as reported by EIA.
Minimal Ongoing Capital Expenditures
Historical EBITDA and Capital Expenditures
$30
Capex averaged ~15% of EBITDA over the last 5 fiscal years1 EBITDA
Capex
$25
$20 Annualized
Barnett EBITDA
Dollars in Millions ($MM)
$15
$26.1
$23.8
$10 $20.0
$12.8
$5
$8.1
$0
-2.4 -2.1 -0.6
-5.4 -5.2
-$5
Pro Forma
FY2017 FY2018 FY2019 FY2020 FY20212
-$10
Notes:
1. Excludes NGL Plant net capital expenditures of ~$5.9 MM (FY2017-FY2021) and acquisitions of Hamilton Dome (FY2020, ~$9.3 MM) and Barnett
Shale (FY2021, ~$18.3 MM).
2. Capital expenditures are lower for FY2021 than previous years due to commodity price volatility in 2020. Our operators responded by curtailing
20 workover and conformance projects. Annualized Barnett EBITDA calculated by using revenue less lease operating expenses, annualized for the
period the assets were owned during FY2021.Maintain High Margins and Low Leverage Throughout the Cycle
Field Revenue and Margin per BOE
$70
LOE CO2
$61.15
$58.65 Field Margin 1 FY Average WTI
$60
$51.88
$48.40 $46.81
$50
$40 69%
$ per BOE
65%
$30 69% 71% 68%
$20
$10
$0
FY2017 FY2018 FY2019 FY2020 FY2021
Total Net Debt 2: $0.0 $0.0 $0.0 $0.0 $0.0
Notes:
21 1. Field margin is calculated here as realized revenue per BOE less LOE and CO2 costs per BOE.
2. Net debt in FY2021 represents the Company's outstanding debt of $4 million less cash and cash equivalents balance of $5.3 million as of 6/30/2021.S t ro n g F i n a nc i a l Po s i t i o n a n d S i m p l e C a p i t a l S t r u c t u re
Capitalization Table
Capitalization
$ in millions 6/30/21
Cash and Cash Equivalents $5.3
Senior Credit Facility $4.0
Total Net Debt $0.0
Total Stockholders’ Equity $54.6
Total Book Capitalization $58.6
Credit Statistics
4Q 2021 Annualized EBITDA $18.7
Net Debt / Adjusted 4Q 2021 Annualized EBITDA 0.0x
Borrowing Base1 $30
22 Notes:
1. Borrowing base has not yet been adjusted for the Barnett Shale acquisition.Management and Insiders Hold ~8% of the Company
Seasoned Leadership
Management Team
Jason Brown | President & CEO | Founder of LongBow Energy,
Co-founder of Halcon Resources, RBC Richardson Barr, Petrohawk
Ryan Stash | Senior Vice President & CFO | Harvest Oil & Gas,
Wells Fargo Securities, Ernst & Young
Board of Directors
Robert Herlin | Evolution Petroleum Chairman & Co-founder
Edward DiPaolo | Halliburton, Duff & Phelps
William Dozier | Vintage Petroleum, Santa Fe Minerals & Amoco
Kelly Loyd | JVL Advisors, LLC1, RBC Capital
Marjorie Hargrave | President & CFO of Enservco
23 Note:
1. Insider holdings cited do not include those of JVL Advisors’ funds not managed by Mr. LoydNYSE: EPM
Investment Highlights
1 Attractive Dividend Supports Total Shareholder Return
• 31 consecutive quarters of dividends paid - currently 5.8% yield at $0.30/share annually
2
Solid Financial Position
• Zero net debt and $30 MM credit facility
High Quality, Low Risk, Long-lived Asset Base
3 • Low production decline and positive cash flow; 20+ years remaining life
• Potential upside drilling and workover opportunities in recently acquired Barnett Shale asset
Consistent Track Record of Generating Cash Flow
4 • 9 years of positive operating cash flow
• No hedges in place, receiving full benefit of current commodity prices
Executing a Disciplined Growth Plan
5 • Closed Hamilton Dome field acquisition on November 1, 2019
• Closed Barnett Shale acquisition on May 7, 2021
• Positioned to execute future acquisitions with conservative leverage
24REACH US
Contact Information
Thank you for your interest in
Evolution Petroleum Corporation
NYSE: EPM
1155 Dairy Ashford, Suite 425
Houston, TX 77079
+1 713 935 0122
info@evolutionpetroleum.com
www.evolutionpetroleum.comAppendix 26
Non-GAAP Reconciliation

     Adjusted EBITDA Reconciliation
      Adjusted EBITDA is a non-GAAP financial measure that is used as a supplemental financial measure by our management and by external
      users of our financial statements, such as investors, commercial banks and others, to assess our operating performance as compared to
      that of other companies in our industry, without regard to financing methods, capital structure or historical costs basis. It is also used to
      assess our ability to incur and service debt and fund capital expenditures. Our Adjusted EBITDA should not be considered an alternative
      to net income (loss), operating income (loss), cash flows provided by (used in) operating activities or any other measure of financial
      performance or liquidity presented in accordance with U.S. GAAP. Our Adjusted EBITDA may not be comparable to similarly titled
      measures of another company because all companies may not calculate Adjusted EBITDA in the same manner.

      The Company defines Adjusted EBITDA as net income (loss) plus interest expense, income tax expense (benefit), depreciation, depletion
      and amortization (DD&A), stock-based compensation, other amortization and accretion, ceiling test impairment and other impairments,
      unrealized loss (gain) on change in fair value of derivatives, and other non-cash expense (income) items.

                                                                                                     Year Ended
                                                                     FY17             FY18              FY19           FY20             FY21
      EBITDA Calculation ($ in 000s)
      Net Income (Loss)                                                     8,044         19,618           15,377             5,937        (16,438)
      + Interest Expense                                                       82              111               117             111               91
      + Income Tax Expense (Benefit)                                        4,841         (3,432)              3,482        (2,181)         (4,984)
      + DD&A                                                                5,719            6,012             6,253          5,761            5,167
      + Stock-Based Compensation                                             1,181           1,367              888           1,286            1,258
      + Other amortization and accretion                                       60              90                  -             25                10
      + Impairments                                                             -                -                 -              -         24,938
      - Unrealized (Gain)Loss on Derivatives                                   14                -                 -           1,911           (1,911)
      - Other Non-cash (Income)                                                17                -                 -              -              (12)
      EBITDA                                                             19,956           23,766           26,117          12,850               8,119

27
You can also read