NORTHEAST DECARBONIZATION - OPPORTUNITIES AND CHALLENGES OF REGIONAL ELECTRICITY SECTOR INTEGRATION FOR HIGH RENEWABLE PENETRATION - Transition ...
←
→
Page content transcription
If your browser does not render page correctly, please read the page content below
NORTHEAST DECARBONIZATION
OPPORTUNITIES AND CHALLENGES OF
REGIONAL ELECTRICITY SECTOR INTEGRATION
FOR HIGH RENEWABLE PENETRATION

NORTHEAST ELECTRIFICATION AND DECARBONIZATION ALLIANCE
                                                         PROJECT PARTNERS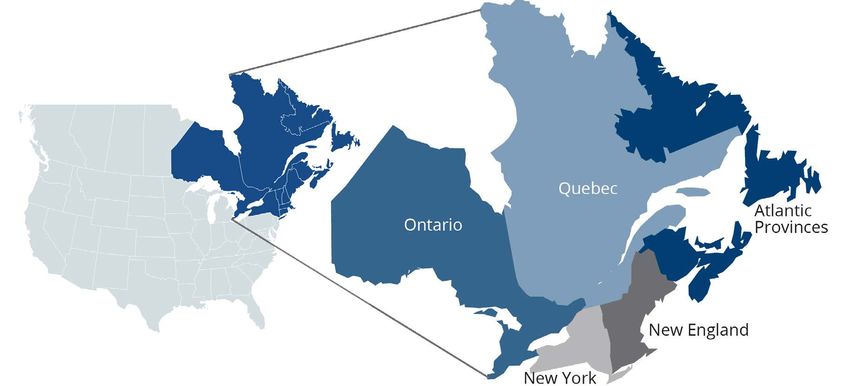
NORTHEAST DECARBONIZATION
OPPORTUNITIES AND CHALLENGES OF REGIONAL ELECTRICITY SECTOR
INTEGRATION FOR HIGH RENEWABLE PENETRATION

AUTHORS
Pierre-Olivier Pineau, HEC Montréal
Simon Langlois-Bertrand, Concordia University

REVIEWERS
We would like to thank a number of reviewers who contributed useful information and insights for this report:
The views presented in this document are those of the authors and do not necessarily represent the position
of their organizations.
•   Amanda Carney, NY ISO                                  •   Louis Beaumier, IET
•   Charlie Smith, ESIG                                    •   Mark O’Malley, NREL
•   Christopher Greig, Princeton University                •   Michael DeSocio, NY ISO
•   Eric D. Larson, Princeton University                   •   Michael Waite, Colombia University
•   Eric St-Pierre, Trottier Foundation                    •   Michelle Damico, NYU
•   Gregory Brinkman, NREL                                 •   Nada Jarjour, Government of Quebec
•   Henry Yoshimura, ISO-NE                                •   Normand Mousseau, IET
•   James Wilcox, Nyserda                                  •   Peter A. Rose, Government of Quebec
•   Kibui Pyron, Government of Canada                      •   Ryan Jones, Evolved Energy
•   Lorne Trottier, Trottier Foundation

ABOUT THE NORTHEAST ELECTRIFICATION AND DECARBONIZATION ALLIANCE
The Northeast Electrification and Decarbonization Alliance (NEDA) promotes collaboration among jurisdictions
in the North American Northeast to achieve deep reductions in greenhouse gas (GHG) emissions through
almost 100% renewable energy systems.

ABOUT HEC MONTRÉAL’S CHAIR IN ENERGY SECTOR MANAGEMENT
The mission of the Chair in Energy Sector Management is to advance knowledge of energy issues in support
of sustainable development, resource optimization and the achievement of an adequate balance between
energy sources and societal needs. The Chair’s activities are made possible through the support of its partners:
Boralex, Brookfield Renewable, Enbridge, ENERCON, Énergir, Hydro-Québec, Valero Energy, WSP.

Chaire de gestion du secteur de l’énergie | HEC Montréal
3000, chemin de la Côte-Sainte-Catherine
Montréal (Québec) H3T 2A7 Canada
energie.hec.ca
@HECenergie

@2020 Chaire de gestion du secteur de l’énergie, HEC Montréal.

Graphic Design : Brigitte Ayotte (ayograph.com)
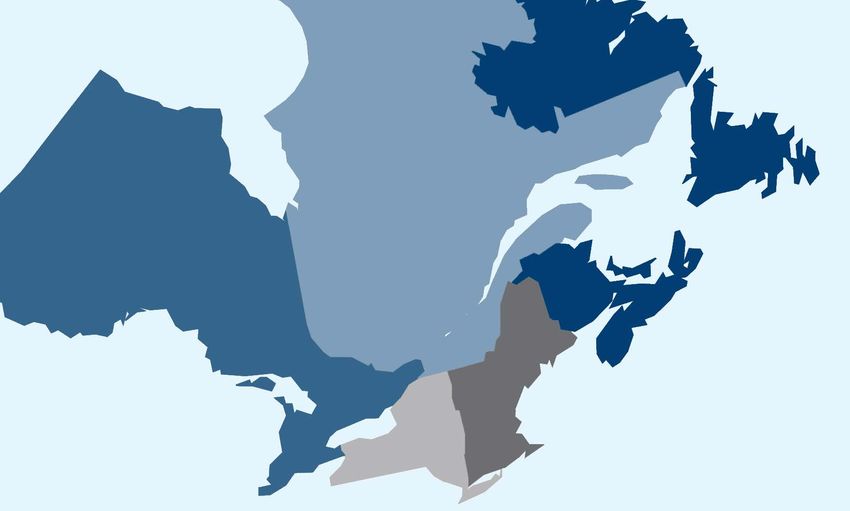
Table of content

Executive Summary .  .  .  .  .  .  .  .  .  .  .  .  .  .  .  .  .  .  .  .  .  .  .  .  .  .  .  .  .  .  .  .  .  .  .  .  .  .  .  .  .  .  .  .  .  .  .  .  .  .  .  .  .  .  .  .  .  .  .  .  .  .  .  .  .  . 1

Introduction. .  .  .  .  .  .  .  .  .  .  .  .  .  .  .  .  .  .  .  .  .  .  .  .  .  .  .  .  .  .  .  .  .  .  .  .  .  .  .  .  .  .  .  .  .  .  .  .  .  .  .  .  .  .  .  .  .  .  .  .  .  .  .  .  .  .  .  .  .  .  .  . 3

SECTION 1 | Overview of climate targets and electricity policies. .  .  .  .  .  .  .  .  .  .  .  .  .  .  .  .  .  .  .  .  .  .  .  .  .  .  . 6

GHG Trends in the Electricity Sector . . . . . . . . . . . . . . . . . . . . . . . . . . . . . . . . . . . . . . . . . . . . . . . . . . . . . . . . . . . . . . . . .  6

GHG Targets and Policies. . . . . . . . . . . . . . . . . . . . . . . . . . . . . . . . . . . . . . . . . . . . . . . . . . . . . . . . . . . . . . . . . . . . . . . . . . .  9

SECTION 2 | Benefits from greater coordination and collaboration in
             renewable energy deployment.  .  .  .  .  .  .  .  .  .  .  .  .  .  .  .  .  .  .  .  .  .  .  .  .  .  .  .  .  .  .  .  .  .  .  .  .  .  .  .  .  .  .  . 13

Electricity Sector and Renewable Integration: Two Related Challenges. . . . . . . . . . . . . . . . . . . . . . . . . . . . . . . . . . . 13

Generic Benefits of Electricity Sector Integration. . . . . . . . . . . . . . . . . . . . . . . . . . . . . . . . . . . . . . . . . . . . . . . . . . . . . . 13

Assessing Integration Benefits in a context of Increased Renewable Penetration . . . . . . . . . . . . . . . . . . . . . . . . . 14

Political Recognition of Electricity System Integration Benefits. . . . . . . . . . . . . . . . . . . . . . . . . . . . . . . . . . . . . . . . . . 15

International Examples. . . . . . . . . . . . . . . . . . . . . . . . . . . . . . . . . . . . . . . . . . . . . . . . . . . . . . . . . . . . . . . . . . . . . . . . . . . . 16

SECTION 3 | Identification of barriers to greater regional cooperation
            and coordination in the electricity sector.  .  .  .  .  .  .  .  .  .  .  .  .  .  .  .  .  .  .  .  .  .  .  .  .  .  .  .  .  .  .  .  .  .  . 18

Institutional and organizational barriers. . . . . . . . . . . . . . . . . . . . . . . . . . . . . . . . . . . . . . . . . . . . . . . . . . . . . . . . . . . . . 18

Political Barriers: Regional cooperation conflicting with industrial policy . . . . . . . . . . . . . . . . . . . . . . . . . . . . . . . . . 19

Social Acceptance Barriers. . . . . . . . . . . . . . . . . . . . . . . . . . . . . . . . . . . . . . . . . . . . . . . . . . . . . . . . . . . . . . . . . . . . . . . . . 20

Overcoming barriers and the way forward. . . . . . . . . . . . . . . . . . . . . . . . . . . . . . . . . . . . . . . . . . . . . . . . . . . . . . . . . . . 21

Conclusion.  .  .  .  .  .  .  .  .  .  .  .  .  .  .  .  .  .  .  .  .  .  .  .  .  .  .  .  .  .  .  .  .  .  .  .  .  .  .  .  .  .  .  .  .  .  .  .  .  .  .  .  .  .  .  .  .  .  .  .  .  .  .  .  .  .  .  .  .  .  .  .  . 22

Bibliography .  .  .  .  .  .  .  .  .  .  .  .  .  .  .  .  .  .  .  .  .  .  .  .  .  .  .  .  .  .  .  .  .  .  .  .  .  .  .  .  .  .  .  .  .  .  .  .  .  .  .  .  .  .  .  .  .  .  .  .  .  .  .  .  .  .  .  .  .  .  . 23

APPENDIX 1 | References for Table 3 .  .  .  .  .  .  .  .  .  .  .  .  .  .  .  .  .  .  .  .  .  .  .  .  .  .  .  .  .  .  .  .  .  .  .  .  .  .  .  .  .  .  .  .  .  .  .  .  . 26
Executive Summary
Deeper regional integration in the electricity sector across the North American
Northeast can bring substantial benefits in reducing greenhouse gas (GHG) emissions
through the deployment of renewable energy. In this region, as elsewhere in the
world, GHG emission reduction targets imply the dual challenge of electrifying many
energy needs and decarbonizing electricity production. The electricity sector will
play a central role in decarbonization. This report argues that better coordination
in planning and operating the Northeast electricity sector could greatly facilitate
decarbonization.
Disparities in production and consumption levels – particularly the availability of existing inexpensive low-carbon
resources – already lead to fruitful electricity trade. Much more is however achievable. After providing some
general background information on the Northeast region electricity profile, this report provides information on
three key aspects of the issue:
1. What are the subnational jurisdictions’ (i.e., states and provinces) goals and current tools with respect
to reducing GHG emissions?
2. What does the current scientific literature say about the need for collaboration in the electricity sector –
both in generic terms and more specifically in the context of deep penetration of renewables?
3. What barriers must be overcome to foster such collaboration?
Despite putting forward several ambitious GHG reduction and renewable deployment targets, policy efforts by
subnational jurisdictions across the Northeast are falling short, and prospects for meeting renewable penetration
levels required by long-term targets appear dim. Even the more promising policy initiatives’ chances of success
may be undermined by various barriers unless they are accompanied by measures to overcome them. Upscaling
GHG reduction efforts through measures targeting the electricity sector and more aggressively fostering the use
of renewables requires giving significantly more attention to integration strategies across the region.
Regional integration in the electricity sector can help these efforts in various ways. Electricity sector integration
can be defined as increased coordination and collaboration among adjacent jurisdictions. Integration involves
different aspects such as physical infrastructure (e.g., interties), institutional and regulatory cooperation and
harmonization (e.g., shared regulation, market design, and systems operation rules), and commercial integration
(e.g., level of trade). There is an important academic consensus on the benefits of electricity market integration.
Academic and engineering studies have demonstrated how aggressive decarbonization goals can be achieved
while maintaining current levels of reliable electricity service. Indeed, to meet the challenges of progressively
increasing the penetration of renewables in the electricity mix across the region, increased integration is essential.
Recent political initiatives in the Northeast seem to recognize these benefits, and early efforts could lead to calls
for an even greater coordination.
To achieve such coordination and collaboration, significant institutional, political and social barriers must be
overcome.
• Institutional barriers imply a need for subnational jurisdictions to give special attention to regulatory
discrepancies across jurisdictions – such as price levels or market access, for instance. This is necessary
to ensure that regional collaboration leads to a streamlining of efforts to harmonize and facilitate
integration of grids across subnational jurisdiction borders.
• 1 •• Political barriers often take the form of combining renewable deployment efforts with local industrial
policy and job creation objectives. By adding unrelated constraints, they prevent more rapid and
extensive penetration of renewables in the electricity mix. Although this type of policy rationale can
foster public support for such renewable policy, this strategy seems to have reached its limits, and often
works against achieving higher penetration levels for renewables across the region.
• Finally, social barriers materialize through opposition to projects (e.g. wind farms, dams, transmission
lines). The failure to address such concerns results in lower renewable penetration and sub-optimal
investments, either from the perspective of a single jurisdiction or for the region as a whole. A viable
path to regional integration must consider both the legitimate concerns in local areas and the regional
goals to accelerate renewable energy deployment.
Reaching medium- and long-term targets for GHG emission reduction and renewables deployment necessitates
an urgent intensification of policy efforts. In the electricity sector, regional integration presents opportunities in
this regard. If both technical and non-technical difficulties can be managed, this integration will provide significant
benefits in terms of sharing renewable resources across the region and meeting the challenges associated with
attaining higher shares of renewables in the electricity mix.
• 2 •Introduction
The North American Northeast includes six Canadian provinces and seven American
states (collectively referred to as the “Northeast” in this report). Their electricity
systems are interconnected, and their reliability standards are overseen by the
Northeast Power Coordinating Council (NPCC). Figure 1 displays the region.
As for all countries in the world, meeting ambitious greenhouse gas (GHG) emission reduction targets probably
implies the dual challenge of electrifying many energy needs (e.g., heating, transportation, industry) and
decarbonizing electricity production. Despite variation among plans laid out so far on how to reach aggressive
GHG reduction targets, the electricity sector will play a central role in all cases.
Better coordinating the planning and operation of the Northeast electricity sectors could facilitate decarbonization.
This document provides information on three key aspects of the issue:
1. What are the subnational jurisdictions’ goals and current tools with respect to reducing GHG emissions?
2. What does the current scientific literature say about the need for collaboration in the electricity sector –
both in generic terms and more specifically in the context of deep penetration of renewables?
3. What barriers must be overcome to foster such collaboration?
FIGURE 1 | M
AP OF THE NPCC REGION
Source: NPCC, 2018.
1
Throughout this report, the term “state” is used predominantly to refer to U.S. subnational jurisdictions and “province” for Canadian ones. To avoid confusion, the term
“jurisdiction”, unless otherwise specified, refers to subnational jurisdictions across North America (i.e., states and/or provinces).
2
Only New Brunswick and Nova Scotia (the two largest provinces) are part of the NPCC, out of the four Canadian Atlantic provinces (New Brunswick, Nova Scotia, Prince
Edward Island and Newfoundland and Labrador, referred to here as “AT”).
• 3 •Before getting into the specifics of these questions, we provide some general background information on the
Northeast region and its electricity consumption and generation. Table 1 shows that New York is by far the most
populous jurisdiction, with close to 20 million people. Ontario comes second (14 million), followed by Quebec (8
million) and Massachusetts (almost 7 million). However, electricity generation and consumption are dominated
by Quebec, with 212 TWh of generation in this province, almost entirely from hydroelectric production. Given the
availability of low-cost hydroelectric power in Quebec, consumption per capita is close to 21,000 kWh per year,
while it is below 8,000 kWh in New York and New England.
TABLE 1 | N
PCC POPULATION IN 2018 AND TOTAL ELECTRICITY CONSUMPTION AND PRODUCTION IN 2017
Population Generation Consumption Surplus (Deficit) (kWh/person) in 2017
(2018) TWh (2017) (TWh) Generation Consumption
New England NE 14,853,290 105.23 115.46 –10.22 7,085 7,773
Connecticut CT 3,572,665 34.56 28.14 6.43 9,674 7,875
Maine ME 1,338,404 11.26 11.21 0.05 8,416 8,378
Massachusetts MA 6,902,149 32.20 52.51 –20.31 4,666 7,608
New Hampshire NH 1,356,458 17.45 10.79 6.66 12,862 7,953
Rhode Island RI 1,057,315 7.61 7.38 0.23 7,202 6,984
Vermont VT 626,299 2.14 5.42 –3.28 3,419 8,660
New York NY 19,542,209 128.07 144.99 –16.93 6,553 7,419
Quebec QC 8,356,699 212.09 173.72 38.37 25,380 20,788
Ontario ON 14,246,035 150.96 133.72 17.24 10,597 9,386
Atlantic AT 2,403,044 63.08 35.91 27.16 26,249 14,945
Nova Scotia NS 955,708 10.07 10.29 –0.22 10,540 10,766
New Brun. NB 768,865 13.23 13.03 0.20 17,202 16,945
Prince Ed. Isl. PE 152,009 0.61 2.13 –1.52 4,008 14,017
NF. & Lab. NL 526,462 39.17 10.47 28.70 74,399 19,878
Source: U.S. Census Bureau, 2018; Statistics Canada, 2019a and b; EIA, 2019a.
Table 2 shows installed generation capacity by fuel type and location. Notably, more than 45,000 MW of installed capacity is in Quebec,
which accounts for 25% of the Northeast installed capacity, but only 14% of the region’s population.
TABLE 2 | INSTALLED CAPACITY BY FUEL IN 2017, IN MEGAWATT
NE NY QC ON AT Total
Coal/Petroleum/Biomass 9,132 6,239 675 5,512 3,893 25,452
Hydroelectric 1,951 4,684 40,438 9,122 8,099 64,294
Natural Gas 16,592 23,169 824 5,153 1,069 46,807
Nuclear 4,075 5,709 13,328 705 23,817
Other 377 265 20 662
Pumped Storage 1,571 1,240 2,811
Solar 785 161 2,296 0 3,242
Wind 1,408 1,830 3,432 5,077 1,166 12,914
35,891 43,298 45,369 40,489 14,953 179,999
Source: EIA, 2019a; Statistics Canada, 2019c.
Note: Fuel categories have been modified from the sources to allow for a uniform presentation of U.S. and Canadian data.
• 4 •Electricity trade is already very important in the Northeast, allowing Massachusetts, for instance, to obtain about
20 TWh of electricity from its neighbors (40% of its consumption), while New York is a net importer of close to 17
TWh (12% of its consumption). Canadian provinces, through their excess generation, are important sources of
power for New York and importing New England states (MA and VT).
The diversity among jurisdictions, further detailed in section 1, is a source of potential complementarity gains
(as detailed in section 2), but is also a difficulty in and of itself, as each jurisdiction is different and operates
independently on its own terms (section 3 further discusses these issues, which impose barriers to further
coordination). To answer the three questions above, we begin in the next section with a careful look at how
jurisdictions across the Northeast have approached efforts to meet GHG emission reduction targets and
accelerate the deployment of renewables in the electricity sector.
• 5 •SECTION 1 | Overview of climate targets
and electricity policies
This section presents GHG emissions trends in the electricity sector and compares
GHG emission reduction targets and related goals and initiatives put forward by
various jurisdictions in the Northeast.
SECTION HIGHLIGHTS |
• GHG emissions from the electricity sector in the Northeast have declined over the past decade, following the replacement
of coal by natural gas and renewables.
• All Northeast jurisdictions have set forth ambitious targets to further reduce their emissions, and many have aggressive
targets to increase the share of renewables in the electricity mix.
• Current policies to help reach medium- and long-term GHG targets are unlikely to be sufficient.
• Coordinated regional strategies in the electricity sector have been very limited, jeopardizing higher penetration for
renewables and compromising the realization of GHG reduction targets.
GHG Trends in the Electricity Sector
While total U.S. power generation has been stable since 2005 (around 4,000 TWh of generation per year, Figure 2), direct electricity
sector emissions of CO2 have been declining at the same time – from a 2007 peak of 2,400 million tonnes to about 1,700 in
2017 (28% decrease). This is because coal is in effect being displaced by natural gas and renewable energy sources (not shown in
Figure 2 because they do not emit GHGs).
FIGURE 2 | U
.S. ELECTRICITY SECTOR CO2 EMISSIONS, 1973-2017 AND U.S. TOTAL GENERATION, 1990-2017
4000
2500 Total US Generation (TWh)
3500
Natural Gas
2000 3000
Million metric tonnes of CO2
2500
1500
Petroleum
TWh
2000
1000 1500
Coal
1000
500
500
0 0
1973
1975
1977
1979
1981
1983
1985
1987
1989
1991
1993
1995
1997
1999
2001
2003
2005
2007
2009
2011
2013
2015
2017
Source: EIA, 2019a and b.
3
Most GHG emissions from the combustion of energy are CO2 emissions, and these are the emissions most commonly reported by the U.S. EIA and the International Energy Agency for the energy sector.
However, small amounts of CH4 and N2O, which are also GHGs, are also emitted in the energy sector, but are less reported.
• 6 •Northeast jurisdictions have been on the same trend: declining electricity sector emissions in New York, New
England and Ontario, in particular. Figure 3 shows the drastic decline in electricity sector CO2 emissions from
1990 to 2016 in New York (-57%), New England (-46%) and Ontario (-79%), achieved by virtually eliminating coal
and petroleum generation from their electricity mix (Figure 3). In the case of Ontario, this was achieved through
an official coal phase-out policy (Ontario, 2019).
FIGURE 3 | N
EW YORK, NEW ENGLAND, ONTARIO, QUEBEC AND ATLANTIC CANADA ELECTRICITY SECTOR
CO2 EMISSIONS, 1990-2016
70
New York (–57%)
60 New England (–46%)
Atlantic Canada (–11%)
Ontario (–79%)
50
Quebec (–84%)
Mt CO2 from the power sector
40
30
20
10
0
1990
1991
1992
1993
1994
1995
1996
1997
1998
1999
2000
2001
2002
2003
2004
2005
2006
2007
2008
2009
2010
2011
2012
2013
2014
2015
2016
Source: EIA, 2019b; ECCC, 2018.
Figure 3 shows how CO2 reductions have resulted from coal and petroleum being practically eliminated between
1990 and 2017, with natural gas, nuclear and, more modestly, renewable sources being used instead. While
generation went down in New York and New England over the 1990-2017 period (Figure 4), it grew in the Canadian
provinces, especially in Quebec, with important additions in hydroelectric and wind generation (Figure 5).
• 7 •FIGURE 4 | NEW YORK AND NEW ENGLAND POWER GENERATION BY SOURCE IN 1990 AND 2017
160
140
120
100
80
Other
TWh
Hydro
60 Nuclear
Petroleum
40 Natural Gas
Coal
20
0
1990 2017 1990 2017
New York New England
Source: EIA, 2019a.
FIGURE 5 | O
NTARIO, QUEBEC AND ATLANTIC CANADA POWER GENERATION BY SOURCE
IN 1990 AND 2016 (CANADA)
200
180
160
140
120
TWh
100
Other renewables
Hydro
80
Nuclear
60 Petroleum
Natural Gas
40 Coal
20
0
1990 2016 1990 2016 1990 2016
Atlantic Canada Quebec Ontario
Source: ECCC, 2018.
• 8 •GHG Targets and Policies
Most jurisdictions in Northeast have three timeframes for GHG emission reduction targets: 2020, 2030 and 2050,
each with increasingly stringent objectives. For most of these, the most rapid increases are between the 2030
and 2050 targets, which require an intensification of efforts compared to earlier objectives: targets for 2030
correspond more or less to reductions in the order of 30-40%, whereas those for 2050 require an 80% reduction
in emissions.
FIGURE 6 | H
ISTORICAL TOTAL GHG EMISSIONS* FROM 1990 TO 2016 WITH PROJECTIONS TO 2050 ACCORDING
TO GHG REDUCTION GOALS (TABLE 3)
250 Historical Data Projections According
to GHG Reduction Goals
New York
200
Ontario
New England
Total GHG emissions* (Mt CO2 eq.)
Quebec
150 Atlantic
100
50
0
1990
1992
1994
1996
1998
2000
2002
2004
2006
2008
2010
2012
2014
2016
2018
2020
2022
2024
2026
2028
2030
2032
2034
2036
2038
2040
2042
2044
2046
2048
2050
Source: EIA, 2019b and ECCC, 2018.
* For US states, only CO2 emissions are available at the state level, not all GHG emissions (including CH4, N2O and other GHG). CO2 represent about
80% of total GHG emissions. Real total emissions for New York and New England are therefore higher than what appears on the Figure.
In order to achieve these targets, jurisdictions across the Northeast have put forward a varying set of initial
measures and initiatives, summarized in the last column of Table 3. Some of these are more typical across
subnational jurisdictions: for instance, several governments set targets for the decarbonization of certain sectors
of the economy, often the electricity sector.
The main initiatives are the following ones, even if they vary substantially across jurisdictions:
• Renewable Portfolio Standards (RPS), which require utilities to have a progressively larger share of
the electricity they sell to end-use customers come from renewable sources;
• Cap-and-trade systems such as the Regional Greenhouse Gas Initiative (RGGI) and the Quebec
Western Climate Initiative (WCI, a joint cap-and-trade system with California), which requires large CO2
emitters to acquire allowances from the government or from other allowance owners in an amount
equal to their emissions, with a progressively decreasing cap on the total number of allowances available
in the region covered;
• Clean energy funds of various forms, through which jurisdictions support efforts to decrease emissions
toward the stated targets by financing eligible projects that are expected to lower GHG emissions.
4
The reference year from which emission reductions are measured varies among different jurisdictions. Typical reference years include 1990, 2001, or 2005 (see Table 3).
Judging from Figures 2 and 6, the reference year used could make achieving a reduction target more or less challenging.
• 9 •In addition, a few less common policy initiatives exist, such as specific objectives for increasing the market share
of electric vehicles (New Brunswick, Quebec), attempts to decarbonize more rapidly through securing large
hydroelectricity purchases from Canadian provinces, notably Hydro-Quebec (for instance, through Massachusetts’
83D Clean Energy request for proposals), or the grouping of various objectives in more comprehensive energy
strategies. In this latter category, New York is putting together a comprehensive regulatory and policy reform of
the electricity sector through its Reforming the Energy Vision (REV) initiatives. REV, however, is primarily oriented
towards an internal (or “New York only”) approach to decarbonization, never explicitly mentioning the current
and possible future gains from regional collaboration.
Some of the common measures nevertheless illustrate a significant degree of collaboration across the region.
The RGGI, for instance, includes not only all New England states and New York, but also a few other neighboring
states (Maryland and Delaware). New Jersey, which participated in the program in its early years before leaving
in 2012, is also set to re-enter in 2020. Through the RGGI, participating jurisdictions commit to reducing GHG
emissions from large emitters in the electricity sector, by setting a regional cap for emissions, which declines over
time (currently at a rate of 2.5% per year). Each participant then allocates allowances for their share of this cap,
the vast majority of which are distributed through auctions. Between 2020 and 2030, electricity sector emissions
in RGGI participating jurisdictions should decrease by 30%.
The RGGI represents a credible measure to curb emissions. The constraints it imposes on members are stable
over time, and the reduction in emissions is controlled by the declining cap on emission allowances across
the entire region subject to the program, which ensures that the targets are reached. Moreover, the rules
for compliance and allocation of allowances are clear and transparent, and revenues from the auctions are
overwhelmingly assigned to other measures dedicated to reducing emissions, for instance energy efficiency,
community-based renewable energy projects, or other greenhouse gas reduction measures.
Nevertheless, as a closer look at the overview presented in Table 3 makes clear, the RGGI remains an exception in
the set of measures adopted across the Northeast in recent years. Clean energy funds, for instance, rarely have
specific GHG reduction targets attached to their performance requirements and funding, and a result it is often
difficult to assess whether they constitute a satisfactory contribution to GHG mitigation for a given level of funding.
Most importantly, despite the urgency associated with addressing these shortcomings if short- and medium-
term targets are to be reached, the failure of matching the intensity of efforts with the requirements of these
targets becomes even more difficult for achieving the longer term and more aggressive 2050 GHG reduction
objectives. As Figure 6 shows, the required decline in GHG emissions between 2030 and 2050 is steeper in the
largest Northeast jurisdictions. As a result, it is important to remember that meeting the 2050 targets will be
more challenging, because earlier and less costly reductions in GHG emissions will have already been made.
The bottom line is that upscaling GHG reduction efforts through measures targeting the electricity sector and
more aggressively fostering the use of renewables requires giving significantly more attention to the credibility
and effectiveness of associated programs and initiatives. As we turn to in the next section, the integration of such
efforts across the region is a strategy presenting significant benefits in this regard.
5
See the Massachusetts Clean Energy website (https://macleanenergy.com), dedicated to the “collaborative efforts of the Massachusetts Department of Energy Resources,
Eversource Energy, National Grid and Unitil to procure Clean Energy for the Commonwealth of Massachusetts.”
• 10 •TABLE 3 | O
VERVIEW OF TARGETS AND INITIATIVES FOR REDUCING GHG EMISSIONS AND INCREASING
THE DEPLOYMENT OF RENEWABLES IN NORTHEAST SUBNATIONAL JURISDICTIONS
(SOURCES IN APPENDIX 1)
Jurisdiction GHG targets Other targets and initiatives
New Brunswick • –10% by 2020, from 1990 • 2,500 electric vehicles on the road in
• –35% by 2030, from 1990 New Brunswick by 2020 and 20,000 by 2030
• –80% by 2050, from 2001
Newfoundland and • –10% by 2020, from 1990
Labrador • –75–85% by 2050, from 2001
Nova Scotia • –10% by 2020, from 1990 • 40% renewables in the electricity mix by 2020
• –45–50% by 2030 from 2005 • Cap–and–trade program (emitters above 50,000 tonnes,
• –80% by 2050, from 2009 petroleum product suppliers, natural gas distributors,
• 25% cap–induced reductions in and electricity importers)
emissions from electricity sector by
2020, 55% by 2030
Ontario • –30% by 2030, from 2005 • Increase ethanol content to 15% by 2025
• –80% by 2050, from 1990
Prince Edward Island • –30% by 2030, from 2005
Quebec • –20% by 2020, from 1990 • –40% oil products consumption by 2030,
• –37.5% by 2030, from 1990 from 2013
• Between –80% and –95% by 2050, • +25% renewable energy production by 2030, from 2013
from 1990 • +50% 2013 bioenergy production by 2030
• Elimination of thermal coal
• Cap–and–trade program (Western Climate Initiative,
WCI) covering all sectors except waste and agriculture.
• Revenues of auctions from the cap–and–trade program
go into the “Fonds vert”, a green funds for projects
linked to GHG reduction efforts
• 3.5% of EV (or PH or hydrogen) for new vehicles sales
for 2018, increasing progressively to 22% in 2025
• 100 000 EVs by 2020, 1 000 000 by 2030
Connecticut • –10% by 2020, from 1990 • RPS 40% renewables by electricity providers
• –45% by 2030, from (legislated) by 2030 (of which hydro includes only
• –80% by 2050, from 2001 (legislated) run–of–the–river)
• Comprehensive Energy Strategy 2018
• Participation in RGGI
• Participation in Transportation emission cap regional
initiative
Maine • –10% by 2020, from 1990 • Participation in RGGI
• –75-80% from 2003 (“sufficient to • Participation in Transportation emission cap regional
eliminate any dangerous threat to initiative
the climate”) • Biennial report to legislature on progress toward
reduction targets
Massachusetts • -25% by 2020, from 1990 • Clean Energy Standard 16% for 2018 and 2% yearly
• -80% by 2050, from 1990 increase until 80% in 2050 (minimum percentage of
electricity sales that utilities and competitive retail
suppliers must procure from clean energy sources)
• RPS: Class I requirement increases by one percent
annually with no established end date
• RPS: Class II (for older facilities) + Waste energy
• Alternative Energy Portfolio Standard (similar to the RPS:
requires a certain percentage of the state’s electric load
to be met by CHP, flywheel storage, and efficient steam
tech): increase by -0.25% per year indefinitely
• Clean Energy and Climate Plan 2020 (updated in 2015)
• Clean Energy solicitations: 83D (state purchase
Canadian hydropower through a 20-year contract) and
83C (offshore wind)
• Participation in RGGI
• Participation in Transportation emission cap regional
initiative
• 11 •TABLE 3 | (CONTINUED)
Jurisdiction GHG targets Other targets and initiatives
New Hampshire • –20% by 2025, from 1990 • RPS: 25.2% by 2025 (large hydro ineligible)
• –80% by 2050, from 1990 • Renewable Energy Fund (finances renewable
energy projects)
• Renewable Energy Rebates (several incentive programs
for PV, wind, solar water heating, as well as other types
of installations)
• Participation in RGGI
• Participation in Transportation emission cap
regional initiative
New York • –40% by 2030, from 1990 in the • 100% clean electricity by 2040
energy sector (including power • Clean Energy Standard: 50% renewable sources in
generation, industry, buildings and electricity by 2030, announced 70% in Cuomo’s
transportation) new plan
• –80% by 2050 for total carbon • 600 trillion Btu increase in statewide energy efficiency
emissions (1990 implied as • 1.5 GW of energy storage by 2025
reference year)
• Green New Deal proposed in 2019 budget (not passed
• –80% by 2050, from 1990 in yet):
New York City
– Offshore wind target raised to 9,000 megawatts
by 2035, up from 2,400 megawatts by 2030
– Distributed solar deployment increased to
6,000 megawatts by 2025, up from 3,000
megawatts by 2023
– Deploying 3,000 megawatts of energy storage
by 2030
• Reforming the Energy Vision (REV) initiative: uses a
two–track process to reorient the electricity industry: (1)
focus on (1) markets and on (2) ratemaking reform
• Participation in RGGI
• Participation in Transportation emission cap
regional initiative
Rhode Island • –45% by 2035, from 1990 • Energy 2035: Rhode Island State Energy Plan
• –80% by 2050, from 1990 • Renewable Energy Standard: 38.5% by 2035
• Participation in RGGI
• Participation in Transportation emission cap regional
initiative
Vermont • –40% by 2030, from 1990 • Comprehensive Energy Plan 2016
• –80-90% by 2050, from 1990 • RES (reaching 75% by 2032 from 55% in 2017; also by
2032 10% of each utility’s electricity must come from
in–state renewable generators under 5MW
• Reduce total energy consumption per capita by 15% by
2025, and by more than one third by 2050.
• 25% of the remaining energy need from renewable
sources by 2025, 40% by 2035, and 90% by 2050
• Three end–use sector goals for 2025: 10% renewable
transportation, 30% renewable buildings, and 67%
renewable electric power.
• Clean Energy Development Fund
• Participation in RGGI
• Participation in Transportation emission cap
regional initiative
• 12 •SECTION 2 | Benefits from greater
coordination and collaboration in
renewable energy deployment
SECTION HIGHLIGHTS |
• There is a consensus on the benefits of electricity market integration and of regional collaboration for deep renewable
integration in electricity systems.
• Regulatory policy changes, market design innovation, and flexible operating procedures are critical to achieving technical
potential.
• Current policies do not seriously consider regional collaboration.
• The scope of the GHG challenge and the electricity system context of the Northeast calls for a greater coordination
between New England, New York and Canadian provinces.
Electricity Sector and Renewable Integration:
Two Related Challenges
Electricity sector integration can be defined as increased coordination and collaboration among adjacent
jurisdictions. Integration involves different aspects such as physical infrastructure (e.g., interconnections),
institutional and regulatory cooperation and harmonization (e.g., shared regulation, market design, and systems
operation rules), and commercial integration (e.g., level of trade). In the following, “integration” has no specific
implication on the extent to which additional coordination and collaboration is involved on each of these
dimensions – but to meet the challenges of progressively increasing the penetration of renewables in the
electricity mix across the region, increased integration is essential.
Renewable integration in the electricity sector is a different, but related concept. It covers the challenges of
adding large amounts of renewable electricity production sources in a power system. It has been studied in many
context – see for instance Holttinen et al. (2019) for the final summary report of the IEA Wind Task 25, providing
many insights on the design and operation of power systems with large amounts of wind power.
In a nutshell, integrating different electricity systems can bring some benefits, even if no renewable capacity is added.
If significant increases of renewable capacity are considered, regional integration of electricity system is even
more beneficial.
Generic Benefits of Electricity Sector Integration
Even without considering the addition of renewable capacity, there is an important consensus on the benefits
of electricity market integration. The UN has published many reports on the subject (see in particular UNECA,
2004; and UN, 2006), and so have the World Bank (ESMAP, 2010), the World Energy Council (WEC, 2010), the
Organization of American States (OAS, 2007) and even the Commission for Environmental Cooperation (CEC,
2002). This latter organization is a North American organization established in 1994 along with the North
American Free Trade Agreement (NAFTA). This literature identifies a series of potential technical benefits that
can be achieved through increased integration. Basically, benefits derive from efficiency gains obtained through
trade and increased productive efficiency. These benefits, in the context of electricity markets, are summarized
in Table 4.
6
This section draws partly from Pineau (2013).
• 13 •TABLE 4 | P
OTENTIAL TECHNICAL BENEFITS FROM ELECTRICITY SECTOR INTEGRATION
Improving reliability and pooling With access to the production facilities of its neighbours, each region gains access to
reserves much greater resources to meet the demand in the case of an incident. This increases
reliability and reduces the need for local reserves of production capacity.
Reduced investment in Thanks to pooling, each region can avoid costs of adding further capacity on its own.
generating capacity
Improving load factors and Greater geographic reach often provides a more diverse demand, where peak periods
increasing demand diversity do not coincide. This helps to avoid operating generating plants only for peak periods,
and it uses the generator fleet in a more constant and efficient manner.
Economies of scale in new With guaranteed access to a much larger market, larger generating stations can be
construction installed, making some economies of scale accessible.
Diversity of generation mix With more types of generation producing electricity, over a larger territory, the system is
and supply security less exposed to events that affect a particular source of energy (low rainfall, lack of fuel,
etc.). This increases the overall security of the integrated system.
Economic exchange With a more diversified generating fleet and production costs, it is possible to use less
costly technologies, situated in other regions, to meet various energy needs. It becomes
possible to use lower cost, but distant, energy resources if equivalent local resources
are not available. This reduces the overall operating costs of the system.
Environmental dispatch and new With a larger territory in which to choose the location of generation facilities, the best
plant siting sites can be chosen (for example, areas with less fragile ecosystems or zones with the
most favourable winds for wind power).
Better coordination of Greater flexibility and reduced impact can be obtained with a more extensive
maintenance schedules production fleet.
Source: CEC, 2002; UN, 2006; ESMAP, 2010; see also Pineau, 2012.
Assessing Integration Benefits in a context
of Increased Renewable Penetration
In the North American context, different studies have looked at how more electricity sector integration could
help achieve different goals, notably increasing the penetration of renewable energy sources or reducing cost.
The benefits and needs for increased transmission capacities, in particular high-voltage direct current (HVDC)
lines, have been recently studied by the EIA (2018) and Weiss et al. (2019), and in a Canadian context, the Standing
Committee on Natural Resources (2017). Transmission lines are needed to help transmit electricity generated
from remote intermittent power sources to load centers. More detailed studies of the challenges related to
additional renewable capacity in the generation portfolio are also conducted by NREL – see for instance the NREL
(2016a) and the forthcoming North American Renewable Integration Study. See also GE (2016) for a Canadian study
on wind integration. In the context of the Eastern North American grid, NREL (2016a) identifies how old and new
generation capacity can be used when renewable penetration is on the rise. It points, however, that “regulatory
policy changes, market design innovation, and flexible operating procedures are critical to achieving technical
potential” (NREL, 2016b). These issues have more institutional components than technical ones, stressing the
importance of increased discussions and coordination among jurisdictions.
Beyond transmission and technical aspects, different studies have tried to assess some of the economic gains
that could be achieved through increased integration, in the Northeast region:
• Hatch (2018) modeled the Atlantic region of Canada and assessed the various generation and transmission
options to minimize the procurement cost of lower carbon-intensive electricity. Quebec and United
7
See https://www.nrel.gov/analysis/naris.html.
• 14 •States interconnections and projects were, however, excluded from the scope of this study, which
was financed by Natural Resources Canada through its Regional Electricity Cooperation and Strategic
Infrastructure Initiative (NRCan, 2019).
• Dolter and Rivers (2018) modeled the entire Canadian electricity system to assess the cost of
decarbonization – but without including the United States.
• Williams et al. (2018), in a study commissioned by Hydro-Québec, explored different electricity sector
coordination scenarios between Quebec and New England and New York. These scenarios illustrate
various gains from coordination in a deep decarbonization context, where loads would significantly
be higher than current ones. However, they excluded other Canadian provinces and the scenario
approach adopted did not optimize investment across various possible technologies and transmission
line configurations.
• Bouffard et al. (2018) presented gains from greater integration in the Northeast region, derived from a
capacity expansion model similar to the one of Dolter and Rivers (2018). It is the only regional study that
models large hydropower reservoirs available in the Northeast to examine how they could help reduce
the cost of decarbonization in the region.
While these studies all point towards the significant benefits of increased integration, especially when renewables
penetration is pursed for deep decarbonization goals, they have not yet fully made their way to energy policy
makers and electricity system planners. There are promising signs, however, as detailed in the next subsection.
Political Recognition of Electricity System Integration Benefits
Some initial steps have been taken by New England Governors and Eastern Canadian Premiers (Quebec and
Atlantic provinces), through their annual discussions in the context of the Conference of New England Governors
and Eastern Canadian Premiers. In August 2018, they have taken the following resolutions (CAP, 2018):
“system planners and operators should strengthen and diversify the generation resource mix and
storage capabilities to reduce energy cost pressures and for greater system resilience during periods
of extended temperature extremes” (Resolution 42-2, Resolution Concerning Energy Security and
Affordability)
“governors and premiers encourage ongoing dialogue among elected officials, businesses and
stakeholder groups in Canada and the United States to further promote cross-border trade, trade
liberalization and North American cooperation” (Resolution 42-4, Resolution Concerning the NAFTA
and the Benefits of Cross-Border Trade)
Following the resolution 42-2 from the 2018 conference, the Northeast International Committee on Energy
(NICE) has been created (Coneg, 2019a). Clearly, goals pursued in these resolutions are related to the potential
benefits brought by electricity market integration. When GHG targets are considered, higher renewable
penetration becomes required and the electricity system integration and renewable energy integration become
joint challenges.
In March 2019, the New England Governors have taken a further step in their commitment towards energy
collaboration through the release of the statement “New England Governors’ Commitment to Regional
Cooperation on Energy Issues” (Coneg, 2019b), which declares that:
“the New England Governors commit to work together, in coordination with ISO New England and through the
New England States Committee on Electricity (NESCOE), to evaluate market - based mechanisms that value the
contribution that existing nuclear generation resources make to regional energy security and winter reliability. In
• 15 •addition, to the extent a state’s policies prioritize clean energy resources, those states commit to work together
on a mechanism or mechanisms to value the important attributes of those resources, while ensuring consumers
in any one state do not fund the public policy requirements mandated by another state’s laws.”
If increased coordination in the New England power system goes in the direction of greater electricity system
integration, the scope of the challenge (detailed in section 1) and the electricity system context of the Northeast
calls for an even greater coordination, beyond New England, including Eastern Canadian provinces, as well as
Ontario and New York.
International Examples
The case of Denmark is also particularly telling. As Figure 7 illustrates, that country is highly interconnected
with its neighbors: it has 4,500 MW of such interconnectors with a peak load of 5,600 MW in 2017. This makes
possible almost 100% imports, in the worst local supply situations (IEA, 2017). This capacity to trade allowed
that country to go from a 100% coal and oil electricity production system in 1990 to a 66% renewable system in
2016 – with wind and biomass accounting for the renewable energy production. Wind intermittency is managed
through the ability to export and import electricity with a wide variety of neighbors.
FIGURE 7 | D
ANISH INTERCONNECTORS THAT EXIST, ARE PLANNED OR ARE UNDER STUDY
Source: IEA, 2017.
8
With the already existing power trade and agreements and shared reliability institution, the Northeast Power Coordinating Council, NPCC (https://www.npcc.org/).
• 16 •Part of the coordination in planning is done through the Nordic Energy Regulators forum, the Nord Pool
(wholesale market owned by Nordic transmission system operators), the Nordic Regional Security Coordinator
and of course through European Union organizations such as the European Network of Transmission System
Operators for Electricity (ENTSO-E).
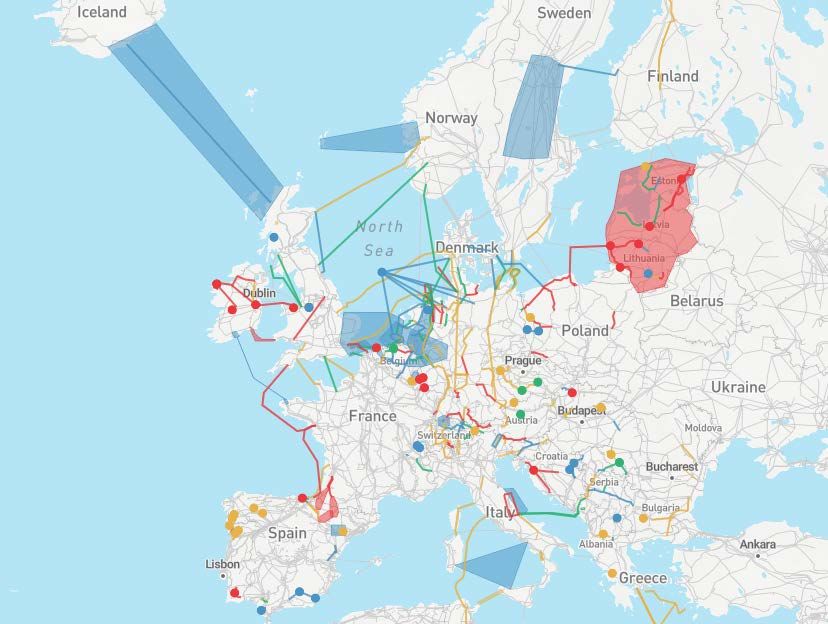
In the Europe, this ENTSO-E was formed in 2009 to support the “setting up the internal energy market and ensuring
its optimal functioning, and of supporting the ambitious European energy and climate agenda” (ENTSO-E, 2019a).
It is in charge of Europe’s Network Development Plan to 2025, 2030 and 2040, which studies and tests various
transmission and storage projects, as illustrated in Figure 8. Such coordinated approach in planning allows, for
instance, to better establish the importance of some particular transmission projects.
FIGURE 8 | E
UROPEAN TRANSMISSION PROJECTS FROM THE TEN-YEAR NETWORK
DEVELOPMENT PLAN 2018
Source: ENTSO-E, 2019b.
• 17 •SECTION 3 | Identification of barriers
to greater regional cooperation and
coordination in the electricity sector
Increased integration requires meeting some technical challenges, such as the need
for transmission infrastructure or managing dispatch and reliability over greater
areas. Although these obstacles may be important, this section highlights additional
and often overlooked non-technical challenges. Combined with technical challenges,
they prevent or complicate efforts to coordinate the electricity sector across the
Northeast. More specifically, institutional, political and social barriers prevent, slow
down, or increase the cost of, regional cooperation and coordination to achieve GHG
reduction and greater renewable energy take-up.
SECTION HIGHLIGHTS |
• While some technical challenges remain to be solved, non-technical barriers complicate regional integration.
• These barriers prevent or hinder both regional integration and the most effective deployment of renewable sources in
the electricity mix, required to reach GHG reduction targets.
• Political barriers dim the prospects for integration across the Northeast electricity sector, through the conflation of
industrial policy objectives and climate-related ones.
• Decision-makers should give special attention to these barriers, notably by addressing social acceptance issues and by
harmonizing electricity regulation and policies across jurisdictions.
Institutional and organizational barriers
A first type of non-technical barrier to regional integration comes from the organization of regulatory and other
overseeing governmental institutions. Both in the U.S. and in Canadian provinces, primary regulatory authority
is in the hands of state- or province-based utility commissions, which have a mandate that requires they look
over the costs and benefits for customers in their home jurisdiction. As a result, there is, by design, little incentive
for these institutions to consider integration from a regional perspective. The U.S. Federal Energy Regulatory
Commission (FERC) has however authority over interstate trade and favors the creation of Regional Transmission
Organizations (RTOs), which compels greater electricity-sector integration among RTO-member states. Between
2001 and 2005, the FERC even pushed for the mandatory creation of RTOs across the U.S., all organized under a
Standard Market Design – but this initiative was received with a lot of resistance and eventually failed.
Subnational authority over electricity markets, as opposed to a more central or federal control, can create a
barrier to integration for a variety of reasons. Regulatory clustering across states or provinces, notably, makes
integration difficult as it adds administrative and operational costs to collaborative arrangements between firms
or governments from different jurisdictions. This is because this clustering often results in substantially different
9
States with lower regulated prices (resulting from favorable access to hydropower or coal) indeed resisted the concept of exporting more electricity to higher cost markets, with the consequence of ex-
periencing higher local prices. Such change was unpopular among consumers groups and led to the rejection of RTO, mostly to protect local lower cost electricity. See Sullivan et al. (2003) for a detailed
account.
• 18 •regulations and standards: as a result, regional collaboration requires their harmonization, which in turns involves
political and regulatory actors from all jurisdictions involved.
This is further complicated by constitutional issues: for instance, Canadian provinces may be reluctant to
pursue interprovincial transmission projects in order to avoid involving the federal government’s participation
through the National Energy Board approval process, which applies to designated interprovincial power lines.
Favorable low-price regulation in some provinces, such as Quebec (made possible by the abundance of low-cost
hydropower) can also complicate regional integration given the diverging pricing approaches.
In the U.S., the prospect of federal pre-emption may make Northeastern states and their regulatory agencies
hesitant to pursue collaborative arrangements on a regional basis (Craig 2010). Moreover, regulatory preferences
on tariff practices make it more difficult for large utilities to benefit from economies of scale following the
integration of their operations across jurisdictions, as the definition of public interest applied by regulatory
agencies in evaluating rate proposals varies across jurisdictions (Brown and Rossi 2010).
These difficulties come in addition to variation in the importance and role of electric utility companies, which
have a government-sanctioned monopoly over certain aspects of the services they provide. This variation reflects
distinctions in regulatory and political approaches that may be difficult to reconcile in regional collaboration
efforts. For instance, some jurisdictions across the Northeast have fully deregulated wholesale markets, whereas
others see a single state-owned enterprise dominate. Therefore, the prospects for integrating these markets
raises questions about how to treat and resolve concerns over competitivity among public monopolies and
private actors of various sizes.
For such reasons, these barriers prevent or hinder the regional integration of efforts related to achieving GHG
reduction targets and increasing the share of renewables in the electricity mix, even when this integration would
be more effective at achieving these objectives.
Political Barriers: Regional cooperation conflicting with
industrial policy
In subnational jurisdictions, industrial policy is designed to achieve objectives such as job creation, expansion
of certain sectors of economic activity, or technological innovation and leadership. With regard to fostering the
deployment of renewable energy technologies, the political rationale has long been to couple the climate-related
benefits with such industrial policy concerns. The electricity sector is often impacted by such policies, for instance
when subnational governments encourage the development of wind and solar energy as a way to increase
employment and innovation within its own jurisdiction – such as how New York’s REV is largely designed. Ontario
and Quebec, in Canada, also largely justified their wind and, to a lower extent, solar investments in the name of
local economic development.
In some instances, these objectives shape policy design, which may act as a barrier to a more effective expansion
of renewables installed capacity, as it can raise the cost of achieving the targets by incorporating local industrial
development or job creation concerns. In this situation, the objectives of GHG policy and industrial policy are
conflicting, leading to suboptimal policies to achieve the former (Langlois-Bertrand et al. 2015). One example is
Ontario’s Green Energy and Green Economy Act of 2009, which contained feed-in tariff support for renewable
energy technologies like wind and solar, but which required developers to respect minimum domestic content
requirements. The stated objective was to use the legislation not only to increase the share of renewables in
the electricity mix, but also to develop a manufacturing sector within the province and create “green” jobs. This
had the effect of raising the price of renewables, thereby diminishing the rate of installations. A similar wind
investment program took place in Quebec, requiring some “local” content for contracted wind farms, that had to
be of course located in the province.
10
The domestic content requirement was eventually removed after being successfully challenged at the World Trade Organization by Japan and the European Union.
• 19 •Another example is the RPS program in New Hampshire, which was designed to be a key tool in reducing the
state’s emissions, by requiring utilities in the state to procure a steadily increasing share of their electricity
from renewable sources. Under the program’s rules, meeting RPS goals can be achieved in a variety of ways,
and the general approach was to rely on the market to determine the most cost-effective options to meet the
requirements. However, in the RPS legislation, the definition used by New Hampshire for eligible renewable
sources specifically excluded large-scale hydropower. In practice, this results in making imports of low-emission
electricity from neighboring Canadian provinces ineligible to meet RPS requirements, even when cost would
be lower than other options. By design, New Hampshire-based producers are preferred over clean energy
imports, at a higher cost linked to a significant expansion of local production from sources like wind, solar and
local hydropower. Concerns related to job creation and promoting local industry, in particular, made the New
Hampshire authorities – like several other jurisdictions in the region – very hesitant to procure large amounts of
electricity from North of the border.
A third example is New York using its hydropower to foster development in some regions of the state. The New
York Power Authority’s ReCharge NY program, for instance, provides qualifying businesses with arrangements
to get guaranteed access to specifically allocated hydropower at below-market prices. In return, the businesses
must make commitments to expand their operations and/or to create jobs. Here as well, the result in terms
of pushing for cost-effective GHG reduction strategies may be less than optimal, given that this low-carbon
electricity is sold at a cheaper rate than the state could otherwise get. This results in a disincentive to increase
efficiency in its use, or to develop the fleet of low-carbon resources, since below-market prices make it less
attractive for utilities and renewable energy developers to install additional renewable resource capacity.
Therefore, political barriers also dim the prospects for integration across the Northeast electricity sector, through
the conflation of industrial policy objectives and climate-related ones.
Social Acceptance Barriers
Given that regional integration often requires the building of new transmission lines, social acceptance barriers
add to the difficulties of fostering collaborative efforts to achieve GHG reduction targets. Local opposition to
infrastructure projects often comes from local populations concerned by the project’s economic, environmental,
social or sometimes simply visual impacts. In the energy sector, if opposition is strong enough, it can derail
valuable regional integration projects. This opposition is often simplified in terms of Not-in-my-Backyard (NIMBY)
arguments, although the rationales are often more varied (Komendantova and Battaglini 2016; Nelson et al.
2018)
In the specific case of transmission lines, opposition coalitions often consist of actors with very different
interests and perspectives. In Maine, for instance, recent opposition to Central Maine Power’s construction of
a transmission line as part of the New England Clean Energy Connect to import hydropower from Quebec to
Massachusetts (Clean Energy 83D solicitation) is composed of environmental groups (the Natural Resources
Council of Maine (NRCM), the Sierra Club), local renewable energy producer associations (Maine Renewable
Energy Association, ReEnergy Biomass Operation) and notably the New England Power Generators Association
(NEPGA), a Boston-based trade group that represents mostly natural gas generators in the region. This coalition
is made possible by the multiple concerns regarding the project, including environmental and tourism impacts
(e.g., destruction of habitats, impact on landscape, uncertain impact on GHG emissions), local business concerns
(e.g., crowding out of small local renewable producers, unfair advantage given to one large utility over other
players), and, finally, local opposition from towns closest to the planned path with specific siting concerns (e.g.,
land property value, health risks).
Given the frequent presence of organized social opposition to transmission line projects, the failure to address
such concerns results in a lesser take-up of renewables from a regional perspective, as it prevents the sharing of
renewable resources across jurisdictions.
• 20 •You can also read