NEW YORK STATE IMPLEMENTATION PLAN FOR THE 2008 OZONE NATIONAL AMBIENT AIR QUALITY STANDARDS NEW YORK-N. NEW JERSEY-LONG ISLAND, NY-NJ-CT SERIOUS ...
←
→
Page content transcription
If your browser does not render page correctly, please read the page content below
NEW YORK
      STATE IMPLEMENTATION PLAN
          FOR THE 2008 OZONE
NATIONAL AMBIENT AIR QUALITY STANDARDS

 NEW YORK-N. NEW JERSEY-LONG ISLAND,
 NY-NJ-CT SERIOUS NONATTAINMENT AREA

                      Draft Proposed Revision
                              June 2021

                    DIVISION OF AIR RESOURCES
                     Bureau of Air Quality Planning

                         Albany, NY 12233-3251
       P: (518) 402-8396 | F: (518) 402-9035 | dar.sips@dec.ny.gov

                           www.dec.ny.gov
EXECUTIVE SUMMARY
In 2008, the U.S. Environmental Protection Agency (EPA) revised the primary and
secondary National Ambient Air Quality Standards (NAAQS) for ozone to levels of 0.075
parts per million. EPA designated the New York-Northern New Jersey-Long Island, NY-
NJ-CT metropolitan area (New York metropolitan area, or NYMA) as a nonattainment
area for the 2008 ozone NAAQS effective July 20, 2012.
The NYMA failed to attain the NAAQS by the marginal attainment date of July 20, 2015
and was reclassified to moderate nonattainment effective June 3, 2016. With a
moderate classification, New York was required to submit a State Implementation Plan
(SIP) revision that demonstrated how the NYMA would attain the 2008 NAAQS by July
20, 2018 (based on monitored air quality data from 2015-2017). On November 10,
2017, the New York Department of Environmental Conservation (DEC) submitted a
demonstration to EPA which concluded that the NYMA would not attain the 2008
NAAQS by the July 20, 2018 moderate area deadline. DEC used that submission to
request an immediate reclassification to serious nonattainment and to be placed on a
schedule for attainment by the serious area deadline of July 21, 2021 (based on 2018-
2020 monitored data).
The NYMA reclassification to serious nonattainment was effective on September 23,
2019. This demonstration shows that ozone concentrations in the NYMA continue to
exceed the 2008 NAAQS based on certified monitoring data for the 2018 through 2020
period; this finding is consistent with projected 2020 photochemical air quality modeling
conducted by DEC. While ozone reduction efforts have resulted in a long-term declining
trend and all New York monitors exhibit attainment of the NAAQS, monitors in
Connecticut continue to measure nonattainment.
New York currently has some of the most stringent control programs for nitrogen oxides
(NOx) and volatile organic compounds (VOCs) in the country. These control programs
include the following:
Reasonably Available Control Technology (RACT) standards on all major NOx
and VOC stationary sources including electric generating units (EGUs) and non-
EGUs;
California’s motor vehicle emission standards – most recently the Low Emission
Vehicle III standards – which more stringently regulate the amount of NOx
emitted from motor vehicles than federal emission standards;
Statewide vehicle inspection and maintenance requirements that include testing
of older, high-emitting vehicles to significantly reduce on-road mobile emissions;
Measures to reduce VOC emissions from a variety of large source categories
that have been recommended by the Ozone Transport Commission including
consumer products, architectural and industrial maintenance coatings, portable
fuel containers, adhesives and sealants, asphalt paving, and solvent metal
cleaning processes; Lowest Achievable Emission Rate standards on all new sources in the NYMA
with the potential to emit 25 tons per year or more of NOx or VOCs, and on all
existing minor sources that would undergo modifications with emissions above
these thresholds; and,
Subpart 227-3, a recently adopted control measure that will reduce NOx
emissions from “peaking” turbines -- old, inefficient units that operate only on the
hottest summer days when electricity demand is at its highest.
While mobile sources are largely regulated at the federal level, New York State is
aggressively improving the efficiency of its vehicle fleet. Aside from the measures listed
above, New York is leveraging over $127 million in funding from the Volkswagen
settlement for a wide variety of mitigation projects that will result in significant NOx
reductions while accelerating the transformation to a zero-tailpipe emission
transportation system. The proposed mitigation actions generally include replacing or
repowering older, dirtier diesel-powered vehicles with newer, cleaner vehicles including
a strong preference for all-electric vehicles, where feasible.
Also, on July 14, 2020, Governor Andrew Cuomo signed the Multi-State Zero Emission
Medium- and Heavy-Duty Vehicle Memorandum of Understanding, joining 14 other
states and the District of Columbia in an agreement to develop an action plan to ramp
up electrification of buses and trucks. New York committed to work collaboratively to
accelerate the market for electric medium- and heavy-duty vehicles, with the goal of
ensuring that all new medium- and heavy-duty vehicle sales be zero emission vehicles
by 2050 with an interim target of 30 percent zero-emission vehicle sales in these
categories of vehicles by 2030.
The NYMA continues to be significantly impacted by interstate transport and mobile
source emissions. DEC has repeatedly urged EPA to develop a stringent program
under the Clean Air Act’s (CAA) good neighbor clause. Instead, EPA has developed
rules that were too late, providing only some benefit in the last year of a three-year
compliance period; too weak, with control cost thresholds significantly lower than those
implemented by the downwind states that fail to require significant control
improvements; and too limited in scope, with EPA excluding high-emitting non-EGU
sources. Until such time that EPA and upwind states satisfactorily address transport and
EPA takes additional steps to regulate mobile source emissions, New York will continue
to suffer from the resulting economic disparities as it struggles to attain the ozone
NAAQS despite the efforts outlined in this attainment demonstration.
The prior administration’s rollback of vehicle emission standards has also frustrated
New York’s progress in reducing ozone levels. On September 27, 2019, EPA finalized
its “One National Program” Rule which revoked California’s ability to set its own mobile
source standards and took away the ability of other states to adopt California standards
to improve their own air quality issues. On March 21, 2020, EPA and the National
Highway Traffic Safety Administration (NHTSA) finalized fuel economy and carbon
dioxide emission standards for model year 2021 through 2026 light-duty vehicles, whichgreatly weakened previously-established standards. New York encourages EPA and
NHTSA to expeditiously proceed with restoring and strengthening those standards and
restoring the waiver of preemption that allows New York to adopt stronger California
standards.
Meanwhile, New York State continues to exceed its Reasonable Further Progress
emission reduction requirements. This SIP details how sources in the NYMA go well
beyond the required 27 percent emission reductions from the 2011 base year. This
requirement is being met through a combination of NOx and VOC reductions, with
excess reductions of NOx totaling an additional 21.17 percent in 2020.
The 2011 base-year inventory was officially submitted to EPA on November 10, 2017
for approval into the New York SIP pursuant to CAA sections 169A(b), 172(c)(3), and
182(a)(1). This baseline emissions inventory is summarized in Section 4, with additional
details provided in New York’s 2017 moderate area attainment SIP and available upon
request. Also included in Section 4 is a projection inventory for 2020. Photochemical
modeling results based on the 2020 projection inventory are included in Section 5.
Section 6 documents how the State of New York meets the three percent per annum
Reasonable Further Progress mandate for serious nonattainment areas.
DEC is also certifying that its existing ozone program fulfills all SIP requirements for a
serious nonattainment area pursuant to the 2008 ozone NAAQS. The following
previously-approved SIP elements remain adequate, and no revisions to the state plan
are necessary.
Emission Inventory: Pursuant to CAA sections 182(a)(3)(A) and 182(c), the
emission inventory requirement is addressed through the submission of the 2011
baseline emission inventory;
Emission Statements: Pursuant to CAA sections 182(a)(3)(B) and 182(c), the
emission statement requirement is fully addressed through 6 NYCRR Subpart
202-2, “Emission Statements”;
RACT: Pursuant to CAA sections 182(b)(2) and 182(c), NOx and VOC RACT
requirements are fully addressed as discussed in Section 7;
Vehicle Inspection and Maintenance: Pursuant to CAA section 182(c)(3), the
vehicle inspection and maintenance requirement is fully addressed through 6
NYCRR Part 217, “Motor Vehicle Emissions”;
Nonattainment New Source Review: Pursuant to CAA sections 182(b)(5) and
182(c), the nonattainment New Source Review requirement is fulfilled by 6
NYCRR Part 231, “New Source Review for New and Modified Facilities.”Contents
EXECUTIVE SUMMARY
SECTION 1: BACKGROUND AND OVERVIEW OF FEDERAL REQUIREMENTS
A. Introduction
B. Ozone Formation
C. Health and Welfare Effects
D. Clean Air Act Amendments of 1990
E. History of the 8-Hour Ozone NAAQS
F. Designation and Requirements of the 2008 Ozone NAAQS
SECTION 2: NEW YORK REGULATIONS FOR OZONE PRECURSORS
A. Introduction
B. Previously Implemented Control Measures
C. Newly Adopted or Revised Control Measures
SECTION 3: AIR QUALITY NETWORK AND DATA
A. Introduction
B. State Monitoring Network
C. NYMA Ozone Air Quality Network
D. 2020 Design Values
SECTION 4: EMISSION INVENTORIES
A. Introduction and Submission of 2011 Base Year Inventory
B. Summary of 2011 Base Year Ozone Season Day Emissions
C. Methodology for Computing Ozone Season Day Values from Annual Estimates
D. Summary of 2020 Projection Year Ozone Season Day Emissions
E. Methodology for 2020 Projection Year Emissions
F. Summary of Emissions Changes between Base Year and Projection Year
G. Conformity Requirements
SECTION 5: AIR QUALITY MODELING
SECTION 6: REASONABLE FURTHER PROGRESS
A. Introduction
B. 2020 VOC Reductions
C. 2020 NOx Reductions
D. Simplified RFP CalculationE. Contingency Measures
SECTION 7: REASONABLY AVAILABLE CONTROL TECHNOLOGY (RACT)
SECTION 8: REASONABLY AVAILABLE CONTROL MEASURES (RACM)
A. Introduction
B. RACM for the 2008 Ozone NAAQS
C. Regulatory Planning
SECTION 9: PERMIT PROGRAM
SECTION 10: CLEAN AIR ACT SECTION 110 MEASURES
SECTION 11: NEW SOURCE REVIEW (NSR)List of Tables
TABLE 1. OZONE MONITORS LOCATED IN NYMA………………………………….SECTION 3 | PAGE 2
TABLE 2. NYMA 2020 DVS FOR THE 2008 OZONE NAAQS (PPM)………………SECTION 3 | PAGE 4
TABLE 3. NYMA SUMMARY OF 2011 OSD EMISSIONS (TONS PER DAY)……….. SECTION 4 | PAGE 1
TABLE 4. NYMA SUMMARY OF 2011 OSD EMISSIONS CONTRIBUTIONS BY SECTOR
…………SECTION 4 | PAGE 2
TABLE 5. NYMA SUMMARY OF 2020 OSD EMISSIONS (TONS PER DAY)……….. SECTION 4 | PAGE 3
TABLE 6. NYMA SUMMARY OF 2020 OSD EMISSIONS CONTRIBUTIONS BY SECTOR
…………SECTION 4 | PAGE 4
TABLE 7. CMV PROJECTION FACTORS……………………………………………. SECTION 4 | PAGE 6
TABLE 8. 2011 TO 2020 EMISSIONS DIFFERENCE IN NYMA (OSD TONS)……… SECTION 4 | PAGE 9
TABLE 9. 2011 TO 2020 EMISSIONS DIFFERENCE IN NYMA (PERCENT)……….. SECTION 4 | PAGE 9
TABLE 10. MOTOR VEHICLE EMISSION BUDGETS………………………………….SECTION 4 | PAGE 11
TABLE 11. PROJECTED 2020 OZONE DVS IN THE NYMA WITH WATER CELLS (PPM)
…………SECTION 5 | PAGE 2
TABLE 12. PROJECTED 2020 OZONE DVS IN THE NYMA WITHOUT WATER CELLS (PPM)
…………SECTION 5 | PAGE 3
TABLE 13. 2011 NYMA BASE YEAR VOC INVENTORY FOR RFP……………….. SECTION 6 | PAGE 2
TABLE 14. 2011 NYMA BASE YEAR ANTHROPOGENIC VOC INVENTORY FOR RFP
…………SECTION 6 | PAGE 2
TABLE 15. 2020 NYMA PROJECTION YEAR ANTHROPOGENIC VOC INVENTORY FOR RFP
…………SECTION 6 | PAGE 3
TABLE 16. 2011 NYMA BASE YEAR NOX INVENTORY FOR RFP…………………SECTION 6 | PAGE 3
TABLE 17. 2011 NYMA BASE YEAR ANTHROPOGENIC NOX INVENTORY FOR RFP
…………SECTION 6 | PAGE 4
TABLE 18. 2020 NYMA PROJECTION YEAR ANTHROPOGENIC NOX INVENTORY FOR RFP
…………SECTION 6 | PAGE 4LIST OF FIGURES
FIGURE 1. NATIONAL ANTHROPOGENIC NOX EMISSIONS BY SOURCE CATEGORY FOR 2019
………... SECTION 1 | PAGE 2
FIGURE 2. NEW YORK STATE ANTHROPOGENIC NOX EMISSIONS BY SOURCE CATEGORY FOR 2019
……….. SECTION 1 | PAGE 3
FIGURE 3. NEW YORK STATE AND NATIONAL NOX EMISSIONS PER CAPITA FOR 2019
……….. SECTION 1 | PAGE 3
FIGURE 4. NATIONAL ANTHROPOGENIC VOC EMISSIONS BY SOURCE CATEGORY FOR 2019
……….. SECTION 1 | PAGE 4
FIGURE 5. NEW YORK STATE ANTHROPOGENIC VOC EMISSIONS BY SOURCE CATEGORY FOR 2019
………. SECTION 1 | PAGE 5
FIGURE 6. NEW YORK STATE AND NATIONAL VOC EMISSIONS PER CAPITA FOR 2019
………. SECTION 1 | PAGE 5
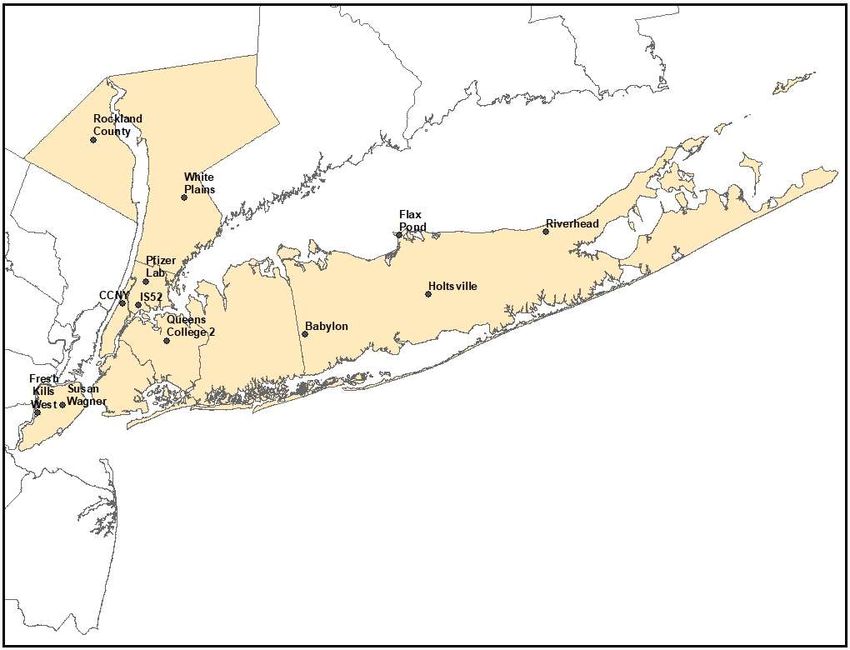
FIGURE 7. MAP OF NYMA OZONE MONITORS
……….. SECTION 3 | PAGE 3
FIGURE 8. HISTORIC NYMA DV TREND – NEW YORK MONITORS ONLY
……….. SECTION 3 | PAGE 5LIST OF APPENDICES
Appendix A: 2011 NYMA Emissions Summary by County and Pollutant
Appendix B: 2020 NYMA Point Annual and OSD Emissions by County
Appendix C: 2020 NYMA Nonpoint OSD Emissions Summary
Appendix D: 2020 NYMA On-road OSD Emissions Summary
Appendix E: 2020 NYMA Refueling OSD Emissions
Appendix F: 2020 NYMA Nonroad Emissions
Appendix G: MARAMA Technical Support Document - Emission Inventory
Development for 2011 and 2017 for the Northeastern U.S.; Beta2 Version
Appendix H-1: Nonpoint Source Methodologies
Appendix H-2: Nonpoint Source Sample Calculations
Appendix I-1: New York Motor Vehicle Emission Inventory – MOVES Technical Support
Documentation
Appendix I-2: Additional Tables of Supporting Data, Reports and Documents
Appendix J: Ozone Season Day Source Classification Code Factors and Sample
Emissions
Appendix K: MARAMA C1/C2 Vessels and Locomotives Growth Factors
Appendix L: MARAMA C3 Marine Vessels Growth Factors
Appendix M: MARAMA Airport Growth Factors
Appendix N: 2020 Airport Emissions by County, SCC, and FIPs
Appendix O: MARAMA Technical Support Document - Emission Inventory
Development for 2011 and Projections to 2020 and 2023 for the
Northeastern U.S.; GAMMA Version
Appendix P: New York State Department of Environmental Conservation Emission
Reduction Credits (ERCs) Registry as of May 1, 2021List of Commonly Used Acronyms and Abbreviations ACT Alternative Control Techniques AIM Architectural and Industrial Maintenance AMCC Aftermarket Catalytic Converter BACT Best Available Control Technology BART Best Available Retrofit Technology CAA Clean Air Act CARB California Air Resources Board CFR Code of Federal Regulations CMV Commercial Marine Vessels CSAPR Cross-State Air Pollution Rule CTG Control Techniques Guidelines DEC New York State Department of Environmental Conservation DG Distributed Generation DV Design Value ECL Environmental Conservation Law EGU Electric Generating Unit EIA Energy Information Administration EPA United States Environmental Protection Agency ERC Emission Reduction Credit ERTAC Eastern Regional Technical Advisory Committee FAA Federal Aviation Administration FR Federal Register GVWR Gross Vehicle Weight Rating HAP Hazardous Air Pollutant I/M Inspection and Maintenance ISA Integrated Science Assessment LAER Lowest Achievable Emission Rate LEV Low Emission Vehicle LTO Landing and Take-Off MACT Maximum Achievable Control Technology MANE-VU Mid-Atlantic and Northeast Visibility Union MARAMA Mid-Atlantic Regional Air Management Association MOVES Motor Vehicle Emissions Simulator MPO Metropolitan Planning Organization MVEB Motor Vehicle Emission Budget NAAQS National Ambient Air Quality Standard NAMS National Air Monitoring Station NEI National Emissions Inventory NESCAUM Northeast States for Coordinated Air Use Management NO Nitric Oxide NO2 Nitrogen Dioxide NOx Oxides of Nitrogen NSR New Source Review
NYCRR   New York Codes, Rules, and Regulations
NYMA    New York Metropolitan Area
NYVIP   New York Vehicle Inspection Program
OBD     Onboard Diagnostic
OSD     Ozone Season Day
OTC     Ozone Transport Commission
OTR     Ozone Transport Region
PM      Particulate Matter
PM2.5   Particulate Matter (Fine)
PM10    Particulate Matter (Coarse)
ppm     Parts per Million
PSD     Prevention of Significant Deterioration
QA      Quality Assurance
RACM    Reasonably Available Control Measures
RACT    Reasonably Available Control Technology
RE      Rule Effectiveness
RFP     Reasonable Further Progress
RVP     Reid Vapor Pressure
SCC     Source Classification Code
SIP     State Implementation Plan
SLAMS   State and Local Air Monitoring Station
SO2     Sulfur Dioxide
TIP     Transportation Implementation Plan
VMT     Vehicle Miles Traveled
VOC     Volatile Organic Compound
SECTION 1: BACKGROUND AND OVERVIEW OF FEDERAL
REQUIREMENTS

A. Introduction

Due to the severity of the health and welfare effects associated with ground-level ozone,
the Clean Air Act (CAA) requires the U.S. Environmental Protection Agency (EPA) to
establish National Ambient Air Quality Standards (NAAQS) designed to protect public
health and the environment. The CAA allows EPA to establish two types of NAAQS for
six criteria air pollutants: Primary standards set limits to protect public health, including
the health of "sensitive" populations such as asthmatics, children, and the elderly.
Secondary standards set limits to protect public welfare, including protection against
decreased visibility and damage to animals, crops, vegetation, and buildings.

The EPA Administrator is tasked with considering the available scientific evidence and
associated quantitative analyses in setting a primary standard that is requisite (i.e.
neither more nor less stringent than necessary) to protect public health with an
adequate margin of safety. The Administrator also considers the full body of evidence
on welfare effects and related analyses (including the evidence of effects associated
with cumulative seasonal exposures of the magnitudes allowed by the current standard)
in determining a secondary standard that provides the requisite protection of public
welfare from known or anticipated adverse effects.

B. Ozone Formation

Ozone is produced through complex chemical reactions in which its precursors –
primarily oxides of nitrogen (NOx) and volatile organic compounds (VOCs) – react in the
presence of sunlight and high temperatures. Ozone that is found high in the earth's
upper atmosphere (stratosphere) is beneficial because it inhibits the penetration of the
sun’s harmful ultraviolet rays to the ground. Ozone, however, can also form near the
earth's surface (troposphere). This ozone, commonly referred to as ground-level ozone,
is breathed in by or comes into contact with people, animals, crops and other
vegetation, and can cause a variety of serious health effects and damage to the
environment. Stratospheric ozone can occasionally mix down and contribute to ozone
levels in the troposphere.

Complicating the formation of ground-level ozone is the fact that the chemical reactions
that create ozone can take place while the pollutants are being blown through the air (or
“transported”) by the wind. This means that elevated levels of ozone can occur many
miles away from the source of their original precursor emissions. Therefore, unlike more
traditional pollutants (e.g., sulfur dioxide (SO 2) and lead, which are emitted directly and
can be controlled at their source), reducing ozone concentrations poses additional
challenges.

                                   Section 1 | Page 1 of 8
1. Ozone Precursor: Oxides of Nitrogen
NOx is a group of gases including nitric oxide (NO) and nitrogen dioxide (NO 2). NO2 is a
reddish-brown, highly reactive gas that is formed in the air through the oxidation of NO.
When NO2 reacts with other chemicals in the atmosphere, it contributes to the formation
of ozone and may also form particulate matter (PM), haze, and acid rain. Sources of NO
and NO2 include motor vehicle exhaust (including both gasoline- and diesel-fueled
vehicles), the burning of coal, oil, and natural gas, and industrial processes such as
welding and electroplating.
Although most NOx is emitted as NO, it is readily converted to NO 2 in the atmosphere.
Since a considerable portion of the NOx in the air is attributed to motor vehicles,
concentrations tend to peak during the morning and afternoon rush hours.
A challenging aspect of controlling ozone pollution in New York City is the nonlinear
response of ozone to precursor concentrations. Local ozone concentrations may be
suppressed by excess NOx emissions in a process referred to as NOx titration.
Controlling excess NOx emissions can reduce this suppressive effect and increase
ozone concentrations locally until such time that NOx becomes the limiting precursor.
Figure 1 shows the national breakdown of NOx emissions by category. In this chart, fuel
combustion refers to stationary sources (i.e., from electric utility, industrial, and other
sources). Transportation is considered a mainly localized contributor of NOx, while fossil
fuel combustion and industrial sources have transport impacts, making them more of a
regional issue. Figure 2 provides these data for New York State. 1
Figure 1. National Anthropogenic NOx Emissions by Source Category for 2019
Miscellaneous
5%
Stationary fuel
combustion
28%
Industrial and
Transportation other
54% processes
13%
1
U.S. EPA; Air Pollutant Emissions Trends Data. https://www.epa.gov/air-emissions-inventories/air-pollutant-
emissions-trends-data. Accessed January 6, 2020.
Section 1 | Page 2 of 8Figure 2. New York State Anthropogenic NOx Emissions by Source Category for 2019
Miscellaneous
0% Stationary fuel
combustion
30%
Industrial and
Transportation other
65% processes
5%
The following figure displays 2019 per-capita NOx emissions at the New York State and
national levels for the same categories as in Figures 1 and 2. 2 For each category,
emissions in New York State are well below the national emission rate.
Figure 3. New York State and National NOx Emissions per Capita for 2019
NY NOx Nat'l NOx
60.0
54.5
50.0
Pounds per Capita
40.0
29.7
30.0
22.7
20.0 15.4 14.7
10.0 6.9 6.9
1.2 2.5
0.0
0.0
Stationary fuel Industrial and Transportation Miscellaneous TOTAL
combustion other processes
2. Ozone Precursor: Volatile Organic Compounds
VOCs are chemicals that evaporate (or volatilize) when they are exposed to air. They
are referred to as organic because they contain carbon. Some VOC compounds are
2
Ibid.; Population data via U.S. Census Bureau. https://www.census.gov/newsroom/press-releases/2019/popest-
nation.html. Accessed January 6, 2020.
Section 1 | Page 3 of 8highly reactive with a short atmospheric lifespan, while others can have a very long
lifespan. The short-lived compounds contribute substantially to atmospheric
photochemical reactions and thus the formation of ozone.
VOCs are used in the manufacture of, or are present in, many products used daily in
both homes and businesses. Some products, like gasoline, actually are VOCs. VOCs
are used as fuels (gasoline and heating oil) and are components of many common
household items (polishes, cosmetics, perfumes, and cleansers). They are also used in
industry as degreasers and solvents, and in dry cleaning. VOCs are present in many
fabrics and furnishings, construction materials, adhesives, and paints. Examples of
more well-known VOC species include carbon tetrachloride, benzene, and toluene.
Because of their widespread historical use and past lack of stringent disposal
requirements, they remain in our air, soil, and water in varying concentrations.
Anthropogenic VOCs are primarily emitted into the air by motor vehicle exhaust,
industrial processes, and the evaporation of solvents, oil-based paints, and gasoline
from gas pumps. Biogenic VOCs, such as isoprene, are commonly emitted by
vegetation.
Figure 4 shows the national breakdown of anthropogenic VOC emissions by category.
As with the NOx chart, fuel combustion refers to stationary sources (i.e., from electric
utility, industrial, and other sources). Figure 5 provides these data for New York State. 3
Figure 4. National Anthropogenic VOC Emissions by Source Category for 2019
Stationary fuel
combustion
3%
Miscellaneous
41%
Industrial and
other
processes
40%
Transportation
16%
3
U.S. EPA; Air Pollutant Emissions Trends Data; https://www.epa.gov/air-emissions-inventories/air-pollutant-
emissions-trends-data. Accessed January 6, 2020.
Section 1 | Page 4 of 8Figure 5. New York State Anthropogenic VOC Emissions by Source Category for 2019
Miscellaneous Stationary fuel
1% combustion
5%
Transportation
37%
Industrial and
other
processes
57%
The following figure displays 2019 per-capita VOC emissions at the New York State and
national levels for the same categories as in Figures 4 and 5. 4 For each category,
emissions in New York State are well below the national emission rate.
Figure 6. New York State and National VOC Emissions per Capita for 2019
NY VOC Nat'l VOC
120.0
102.7
100.0
Pounds per Capita
80.0
60.0
41.3 42.0
40.0
27.2
20.0 15.7 16.4
10.0
1.4 3.1 0.2
0.0
Stationary fuel Industrial and Transportation Miscellaneous TOTAL
combustion other processes
C. Health and Welfare Effects
EPA’s Integrated Science Assessment (ISA) for ozone has determined that a ‘‘causal’’
relationship exists between short-term exposure to ozone in ambient air and effects on
4
Ibid.; Population data via U.S. Census Bureau. https://www.census.gov/newsroom/press-releases/2019/popest-
nation.html. Accessed January 6, 2020.
Section 1 | Page 5 of 8the respiratory system and that a ‘‘likely to be causal’’ relationship exists between long-
term exposure to ozone in ambient air and respiratory effects. 5 The ISA also determined
that the relationships between short-term exposures to ozone in ambient air and
cardiovascular effects are likely to be causal, based on expanded evidence in the
current review.6 Additionally, the latest review strengthened the body of evidence
indicating the occurrence of respiratory effects due to long-term ozone exposure. 7
Ground-level ozone can irritate lung airways and cause skin inflammation much like
sunburn. Other symptoms from exposure include wheezing, coughing, pain when taking
a deep breath, and breathing difficulties during exercise or outdoor activities. Even at
very low levels, exposure to ground-level ozone can result in decreased lung function,
primarily in children active outdoors, as well as increased hospital admissions and
emergency room visits for respiratory illnesses among children and adults with pre-
existing respiratory diseases (e.g. asthma). People with respiratory problems are most
vulnerable to the health effects associated with ozone exposure, but even healthy
people that are active outdoors can be affected when ozone levels are high.
In addition to its health effects, ozone interferes with the ability of plants to produce and
store nutrients, which makes them more susceptible to disease, insects, harsh weather,
and other pollutants. This impacts annual crop production throughout the United States,
resulting in significant losses and injury to native vegetation and ecosystems. In
addition, ozone damages the leaves of trees and other plants, ruining the appearance of
cities, national parks, and recreation areas. Ozone can also damage certain man-made
materials, such as textile fibers, dyes, rubber products, and paints.
D. Clean Air Act Amendments of 1990
During the fall of 1990, and after years of debate, the U.S. Congress approved changes
to the federal CAA – the first since 1977. Congress added provisions that addressed
acid rain, hazardous air pollutants (HAPs), and stratospheric ozone concerns, and also
significantly changed the way in which states were to address remaining attainment
problems for criteria pollutants, including ground-level ozone. As opposed to the past
when areas were merely designated as attainment, nonattainment, or unclassifiable, the
1990 Amendments required areas to also be classified according to severity. Additional
requirements were placed on areas with more severe classifications, and additional time
was provided to demonstrate attainment with the NAAQS.
E. History of the 8-Hour Ozone NAAQS
In an effort to develop a standard more protective of public health than the existing 1-
hour standards, EPA promulgated ozone standards of 0.08 parts per million (ppm)
5
U.S. EPA; “Integrated Science Assessment for Ozone and Related Photochemical Oxidants; External Review
Draft.” September 2019. EPA/600/R-19/093. Table IS-1.
6
Ibid. Section IS.1.3.1.
7
Ibid. Appendix 3 Section 3.2.6.
Section 1 | Page 6 of 8measured over an 8-hour period (known as the 8-hour standard or 1997 NAAQS) on
July 18, 1997.8 After a long period of litigation, EPA finalized designations for the 1997
NAAQS on April 30, 2004.9 A number of areas within New York State were designated
nonattainment for the 1997 NAAQS at the time, including the New York-Northern New
Jersey-Long Island, NY-NJ-CT area (hereafter “New York metropolitan area” or NYMA).
All nonattainment areas located in New York now monitor attainment of the 1997
NAAQS. The 1997 NAAQS was revoked by EPA effective April 6, 2015. 10
The next iteration of the NAAQS – and the focus of this SIP revision – was published on
March 27, 2008.11 The 2008 standards modified only the level of the existing standards,
lowering both the primary and secondary standards from 0.08 ppm to 0.075 ppm in
response to the latest health and welfare studies. EPA’s designations and
classifications were delayed due to a reconsideration of the 2008 NAAQS that was
proposed on January 19, 2010, but ultimately abandoned. 12 Designations for the 2008
standards became effective on July 20, 2012.13
On October 1, 2015, EPA announced a new, more stringent ozone NAAQS in light of
evidence that the 2008 standards were not sufficiently protective of public health and
welfare.14 The levels of the primary and secondary standards were both lowered to
0.070 ppm.
A subsequent NAAQS review that was finalized in late 2020 retained the level of the
NAAQS at 0.070 ppm.15 This 2020 review was included among the agency actions that
the new EPA Administrator will review in accordance with President Biden’s Executive
Order, “Protecting Public Health and the Environment and Restoring Science to Tackle
the Climate Crisis.”16
8
“National Ambient Air Quality Standards.” Final Rule. Published July 18, 1997; effective September 16, 1997. 62 FR
38856-38896.
9
“Air Quality Designations and Classifications for the 8-Hour Ozone National Ambient Air Quality Standards; Early
Action Compact Areas with Deferred Effective Dates.” Final Rule. Published April 30, 2004; effective June 15,
2004. 69 FR 23858-23951.
10
“Implementation of the 2008 National Ambient Air Quality Standards for Ozone: State Implementation Plan
Requirements.” Final Rule. Published March 6, 2015; effective April 6, 2015. 80 FR 12264-12319.
11
“National Ambient Air Quality Standards for Ozone.” Final Rule. Published March 27, 2008; effective May 27, 2008.
12
“National Ambient Air Quality Standards for Ozone.” Proposed Rule. Published January 19, 2010. 75 FR 2938-
3052.
13
“Air Quality Designations for the 2008 Ozone National Ambient Air Quality Standards.” Final Rule. Published May
21, 2012; effective July 20, 2012. 77 FR 30088-30160.
14
“National Ambient Air Quality Standards for Ozone.” Final Rule. Published October 26, 2015; effective December
28, 2015. 80 FR 65292-65468.
15 “Review of the Ozone National Ambient Air Quality Standards.” Final Rule. Published and effective December 31,
2020. 85 FR 87256-87351.
16
https://www.whitehouse.gov/briefing-room/statements-releases/2021/01/20/fact-sheet-list-of-agency-actions-for-
review/
Section 1 | Page 7 of 8F. Designation and Requirements of the 2008 Ozone NAAQS
The CAA requires states to ensure that all areas within their jurisdiction meet and
maintain air quality levels that comply with the NAAQS prescribed by the federal
government.
Effective July 20, 2012, EPA designated two areas as nonattainment for the 2008
NAAQS: the Jamestown, NY area, comprised of Chautauqua County; and the New
York-N. New Jersey-Long Island, NY-NJ-CT area, comprised of the New York State
counties of Bronx, Kings, Nassau, New York, Queens, Richmond, Rockland, Suffolk,
and Westchester, as well as twelve counties from New Jersey and three from
Connecticut. Both areas were classified as marginal nonattainment, with an attainment
date of July 20, 2015.17
EPA published its final actions for marginal nonattainment areas on May 4, 2016. 18 In
this final reclassification rule, EPA determined that the Jamestown, NY area had
demonstrated attainment with the 2008 ozone NAAQS based on monitored air quality
data from 2012-2014, whereas the NYMA continued to exceed the NAAQS. EPA
reclassified the NYMA to moderate nonattainment with an attainment date of July 20,
2018.
DEC formally requested a reclassification to serious nonattainment on November 10,
2017 in light of monitoring and modeling evidence that demonstrated continued
nonattainment. The NYMA indeed surpassed its July 20, 2018 attainment date without
complying with the NAAQS. EPA finalized a reclassification of the NYMA to serious
nonattainment effective September 23, 2019.19
17
“Air Quality Designations for the 2008 Ozone National Ambient Air Quality Standards.” Final Rule. Published May
21, 2012; effective July 20, 2012. 77 FR 30088-30160.
18
“Determinations of Attainment by the Attainment Date, Extensions of the Attainment Date, and Reclassification of
Several Areas for the 2008 Ozone National Ambient Air Quality Standards”; Final Rule. Published May 4, 2016.
Effective June 3, 2016. 81 FR 26697-26722.
19
“Determinations of Attainment by the Attainment Date, Extensions of the Attainment Date, and Reclassification of
Several Areas Classified as Moderate for the 2008 Ozone National Ambient Air Quality Standards”; Final Rule.
Published August 23, 2019. Effective September 23, 2019. 84 FR 44238-44245.
Section 1 | Page 8 of 8SECTION 2: NEW YORK REGULATIONS FOR OZONE PRECURSORS
A. Introduction
This section summarizes previous regulatory commitments in New York State and the
NYMA that control emissions of NOx and VOCs from the mobile, stationary, and area
source sectors, as well as newly adopted or revised regulations. Many control measures
were adopted or revised since 2008 as part of the state’s efforts to attain the NAAQS in
the NYMA. Part D of Title I of the CAA requires that these measures be implemented
and meet Reasonable Further Progress (RFP) goals as the area strives to reach
attainment. Due to anti-backsliding requirements, these past commitments continue
indefinitely unless replaced by an equivalent or stricter emission reduction strategy.
DEC works closely with the Ozone Transport Commission (OTC) to develop stationary-
and area-source control measures that states can implement to help reduce ozone
precursor emissions throughout the Ozone Transport Region (OTR). DEC also
develops its own regulations that target source categories that have meaningful
potential emission reductions of NOx and VOCs, and implements regulations that mirror
federal programs (e.g., EPA’s interstate trading rules) as well.
A number of these regulations set Reasonably Available Control Technology (RACT)
standards for NOx and VOCs, where RACT is defined as “the lowest emission limitation
that a particular source is capable of meeting by the application of control technology
that is reasonably available considering technological and economic feasibility.” 20 RACT
standards take the form of either presumptive emission limits (based on available
control technologies and cost) or facility-specific emission limits.
DEC has long called for EPA to adopt or update control programs at the federal level -
e.g., rules targeting emissions from architectural and industrial maintenance coatings,
consumer products, and heavy-duty diesel engines. Consistent national standards will
improve air quality and reduce burdens on manufacturers. Additionally, on April 21,
2021, a group of bipartisan governors wrote to President Biden about leveraging his
American Jobs Plan to provide a strong framework for the American-made zero-
emission vehicle (ZEV) market, in part by setting national standards for light-, medium-,
and heavy-duty vehicles.21 EPA must also ensure RACT is properly enforced in
applicable upwind areas to reduce inequities between upwind and downwind states.
Control measures that have been proposed or adopted that did not yield emission
reductions in time to benefit the 2020 ozone season are listed in Section 2.C.
20
“State Implementation Plans; Nitrogen Oxides Supplement to the General Preamble; Clean Air Act Amendments of
1990 Implementation of Title I.” Proposed Rule. Published November 25, 1992. 57 FR 55620.
21
April 21, 2021 letter to President Biden from the Governors of the States of California, Connecticut, Hawaii, Maine,
Massachusetts, New Jersey, New York, New Mexico, North Carolina, Oregon, Rhode Island, and Washington.
Section 2 | Page 1 of 11B. Previously Implemented Control Measures
Part 205: Architectural and Industrial Maintenance (AIM) Coatings
VOC content limits for AIM coatings contained in Part 205 reduce VOC emissions from
the area source sector. It is periodically updated with new and/or more stringent VOC
limits informed by OTC model rules. (DEC recently finalized a revision to Part 205; see
Section 2.C). Part 205 also contains labeling and reporting requirements, compliance
provisions, and test methods.
Part 210: Emissions and Labeling Requirements for Personal Watercraft Engines
New York adopted California’s emissions standards for personal watercraft in 2003,
which reduce emissions of hydrocarbons, NOx, and PM beyond the levels achieved by
federal standards by imposing lower emission certification levels beginning with model
year 2006 and becoming increasingly stringent thereafter. In addition, the personal
watercraft engine program includes test procedures for new and in-use engines, which
guarantees compliance with the standards, establishes an environmental label program,
and extends emission warranty requirements. Emissions from manufacturers’ entire
product lines must be certified as meeting the corporate average requirement.
Subpart 212-3: Reasonably Available Control Technology for Major Facilities
This regulation requires a source-specific RACT analysis for each emission point at a
facility that emits NOx at major NOx facilities or VOCs at major VOC facilities. Its
requirements are mostly generic, with specific requirements only for coating operations
not subject to Part 228.
Subpart 212-4: Control of Nitrogen Oxides for Hot Mix Asphalt Production Plants
This new subpart was promulgated on September 30, 2010 to control NOx from asphalt
production plants. Currently, all asphalt production plants in New York State are minor
facilities. The dryer operation is the main source of NOx emissions at these facilities.
This regulation requires best management practices and the installation of low NOx
burners where economically feasible to reduce emissions.
Subpart 217-6: Motor Vehicle Enhanced Inspection and Maintenance Program
Beginning January 1, 2011
New York State has implemented an approved statewide, enhanced motor vehicle
inspection and maintenance (I/M) program under Title 6 of the New York Codes, Rules,
and Regulations (NYCRR) Part 217-6 and 15 NYCRR Part 79 to limit ozone precursor
emissions from motor vehicles. The current New York Vehicle Inspection Program
(NYVIP2) requires an appropriate emissions inspection (e.g., onboard diagnostic
(OBDII) or low enhanced inspection) for most vehicles annually and with change of
vehicle ownership. The emissions inspection is completed along with a safety
inspection. The appropriate emissions inspection is determined by vehicle model year,
gross vehicle weight rating (GVWR), fuel type, and registration class. The latest NYVIP2
Section 2 | Page 2 of 11annual I/M report (2019) can be found at the following webpage:
http://www.dec.ny.gov/chemical/85985.html
Part 218: Emission Standards for Motor Vehicles and Motor Vehicle Engines
Section 177 of the CAA permits states to adopt new motor vehicle emissions standards
that are identical to California's. DEC has exercised this option by incorporating the
latest California emissions standards for light-duty vehicles through Part 218. In this
regulation, New York State requires that new on-road motor vehicles sold in New York
meet the California emissions standards. (DEC recently finalized a revision to
incorporate aftermarket catalytic converter (AMCC) standards; see Section 2.C).
The low-emission vehicle (LEV) regulations provide flexibility to auto manufacturers by
allowing them to certify their vehicle models to one of several different emissions
standards. These consist of several different tiers of increasingly stringent LEV emission
standards to which a manufacturer may certify a vehicle, including LEV, ultra-low-
emission vehicle (ULEV), super-ultra-low-emission vehicle (SULEV), and ZEV. The
different standards are intended to provide flexibility to manufacturers in meeting
program requirements. However, manufacturers must demonstrate that the overall fleet
for each model year meets the specified non-methane organic gas standard for that
year. These requirements are progressively more stringent with each model year.
A 2016 update to Part 218 incorporated California’s latest LEV standards (LEV III) and
ZEV standards into New York’s program. The LEV III amendment takes effect for 2017
through 2025 model year passenger cars, light-duty trucks, and medium-duty
passenger vehicles. The ZEV revisions apply to 2018 through 2025 model year
passenger cars, light-duty trucks, and medium-duty vehicles.
The LEV III amendments allow vehicle manufacturers the voluntary option of
demonstrating compliance with EPA Tier 3 emission standards rather than LEV III
standards for model years 2017 through 2025. EPA’s rule coupled the more stringent
vehicle emissions standards with a reduction in gasoline sulfur content, which will allow
for more effective emission control systems. 22
Part 220: Portland Cement Plants and Glass Plants
Revisions were made to Part 220 effective July 11, 2010. In updating the regulation, the
existing requirements for Portland cement plants were moved to Subpart 220-1 and new
requirements for glass manufacturing plants were placed in Subpart 220-2. The update
also required sources from each sector to perform a source-specific RACT analysis.
(Due to the variation in processes and NOx control technologies for each source type,
DEC opted against presumptive NOx limits.) Analyses must be updated upon
subsequent renewal of Title V permits pursuant to DEC’s guidance document DAR-20.
Two cement plants and four glass manufacturing plants in New York State are subject
to these regulations, though none are located within the NYMA.
22
“Control of Air Pollution from Motor Vehicles: Tier 3 Motor Vehicle Emission and Fuel Standards.” Final Rule.
Published April 28, 2014; effective June 27, 2014. 79 FR 23414-23886.
Section 2 | Page 3 of 11Subpart 225-3: Fuel Consumption and Use - Gasoline
New York State adopted Subpart 225-3 to limit the volatility, or Reid Vapor Pressure
(RVP), of motor fuel statewide as a strategy for controlling VOC emissions from motor
vehicles. Specifically, this regulation established a maximum RVP of 9.0 pounds per
square inch for all gasoline sold or supplied to retailers and wholesale purchaser-
consumers anywhere in New York State from May 1 through September 15 of each
year. Subpart 225-3 requires DEC to grant case-by-case exceptions for gasoline-
alcohol blends to exceed 9.0 pounds per square inch RVP.
Part 226: Solvent Cleaning Processes and Industrial Cleaning Solvents
Part 226 sets guidelines for the cleaning of metal surfaces by VOC-containing
substances. (DEC recently finalized a revision to incorporate the industrial cleaning
solvents CTG; see Section 2.C). This regulation limits the vapor pressure of solvents
and contains specifications for control equipment and proper operating practices for a
variety of degreasing operations, in addition to general requirements for storage and
record-keeping.
Subpart 227-2: Reasonably Available Control Technology (RACT) for Major
Sources of Oxides of Nitrogen (NOx)
Subpart 227-2 controls NOx emissions from a variety of emission sources at major
facilities, including utility/industrial/commercial/institutional boilers, combustion turbines,
and stationary internal combustion engines. More stringent emission limits went into
effect July 1, 2014.
Presumptive NOx RACT emission rates are set for most unit types based on the size of
the unit and fuel type. Units that cannot meet the presumptive NOx limits, in addition to
certain other types of units (e.g., all combined cycle (including cogeneration)
combustion turbines), must submit a case-by-case RACT analysis to DEC to determine
a facility-specific emission limit.
The regulation also allows for alternate compliance options such as fuel switching and
system-wide averaging. Testing, monitoring, and reporting requirements are also
included.
Subpart 228-1: Surface Coating Processes
Part 228 limits the VOC content for each gallon of coating and sets minimum efficiency
standards for VOC control equipment. It also contains requirements for application
techniques, opacity limits, and housekeeping.
Subpart 228-2: Commercial and Industrial Adhesives, Sealants and Primers
DEC updated this regulation on June 5, 2013 utilizing the 2006 OTC model rule for
adhesives, sealants, adhesive primers and sealant primers which was based, in turn, on
California Air Resources Board (CARB) standards. This regulation places VOC content
limits on these products, requires specific labeling standards, and provides an option for
Section 2 | Page 4 of 11add-on control systems to meet the required content limits. Also included are
requirements for surface preparation and cleanup solvents. Emission reductions from
this regulation are primarily observed from the area source sector.
Part 229: Petroleum and Volatile Organic Liquid Storage and Transfer
This regulation limits VOC emissions from applicable gasoline bulk plants, gasoline
loading terminals, marine loading vessels, petroleum liquid storage tanks, or organic
liquid storage tanks.
Part 230: Gasoline Dispensing Sites and Transport Vehicles
This regulation contains requirements for Stage I and Stage II gasoline dispensing sites
(DEC recently finalized a revision to discontinue the State II requirements; see Section
2.C). Stage I systems are required statewide, while Stage II systems are mandated only
in the NYMA and the lower Orange County towns of Blooming Grove, Chester,
Highlands, Monroe, Tuxedo, Warwick, and Woodbury. Part 230 affects gasoline-
dispensing sites whose annual throughput exceeds 120,000 gallons, although this
minimum throughput level does not apply to the NYMA.
A Stage I vapor collection system captures gasoline vapors which are displaced from
underground gasoline storage tanks when those tanks are filled. These vapors are
forced into a vapor-tight gasoline transport vehicle or vapor control system through
direct displacement by the gasoline being loaded. A Stage II vapor collection system
captures at least 90 percent, by weight, of the gasoline vapors that are displaced or
drawn from a vehicle fuel tank during refueling; these vapors are then captured and
either retained in the storage tanks or destroyed in an emission control device. DEC,
however, has ceased enforcement of the Stage II requirements in favor of the onboard
refueling and vapor recovery systems that come equipped in newer model year
vehicles, as they have demonstrated a greater degree of VOC emissions control.
Part 231: New Source Review for New and Modified Facilities
Part 231 has regulated the New Source Review (NSR) program for nonattainment areas
since 1979. Part 231 was revised in 2009 to include the regulation of emission
increases of attainment pollutants under Prevention of Significant Deterioration (PSD).
The regulation was written and amended to conform to federal guidelines and
requirements on new sources and modifications at major facilities in nonattainment and
attainment areas which would cause emission increases exceeding de minimis levels
set forth in the regulation. The base requirements for applicable sources in
nonattainment areas are that Lowest Achievable Emission Rate (LAER) control
technology be applied and that emission offsets be provided. The base requirements for
applicable sources in attainment areas are that Best Available Control Technology
(BACT) be applied and the facility conducts modeling and ambient air monitoring of the
applicable pollutants with respect to ambient air quality standards.
Section 2 | Page 5 of 11Part 233: Pharmaceutical and Cosmetic Manufacturing Processes
This regulation limits VOC emissions from synthesized pharmaceutical or cosmetic
manufacturing processes. Compliance requires the installation of control devices, along
with monitoring, recordkeeping, and leak repair.
Part 234: Graphic Arts
This regulation sets control requirements and/or limits VOC contents to reduce
emissions from packaging rotogravure, publication rotogravure, flexographic, offset
lithographic, and screen-printing processes. It was updated on July 8, 2010 to address
recent Control Techniques Guidelines (CTGs) for flexible package printing and offset
lithographic and letterpress printing.
Part 235: Consumer Products
The consumer products rule regulates the VOC content of consumer and commercial
products that are sold to retail customers for personal, household, or automotive use,
along with the products marketed by wholesale distributors for use in commercial or
institutional settings such as schools and hospitals. The regulation also includes
labeling, reporting and compliance requirements that apply to manufacturers of these
products. An update to this regulation was effective on October 15, 2009 based on a
2006 OTC model rule which, in turn, was informed by amendments put forth by CARB
in 2005. Section 2.C discusses a subsequent update effective early in 2021.
Part 239: Portable Fuel Container Spillage Control
DEC updated this regulation in 2009 to better control VOC emissions resulting from
evaporation through the diurnal cycle and spillage from portable fuel containers. The
update eliminated the automatic shutoff feature, fill height, and flow rate standards from
the previous rule to simplify fueling and lessen spillage. The revisions also required
certification and compliance of portable fuel containers prior to their sale and expanded
the definition of a non-compliant container, effectively regulating diesel and kerosene
containers in the same manner as portable fuel containers.
Part 241: Asphalt Pavement and Asphalt-Based Surface Coating
DEC adopted the new Part 241 on January 1, 2011 to regulate the use of cutback and
emulsified asphalts in paving operations. The regulation limits the amount of petroleum
distillate allowed in emulsified asphalt, while prohibiting the use of cutback asphalt in
most circumstances. It also places VOC content limits on asphalt-based surface
coatings.
Part 243: Transport Rule NOx Ozone Season Trading Program
Part 243 codifies the “good neighbor” requirements of CAA section 100(a)(2)(D)(i) at the
state level. Part 243 was initially effective on October 19, 2007 to manage the NOx
ozone season trading program for the Clean Air Interstate Rule. EPA later updated its
Section 2 | Page 6 of 11NOx trading program through the July 6, 2011 Cross-State Air Pollution Rule
(CSAPR),23 and Part 243 was revised to reflect this update.
The ozone season trading program was again updated in October 2016, resulting in
adjusted NOx emission budgets to address the 2008 ozone NAAQS. DEC revised Part
243 to replace the default allowance allocation provisions with its own allocation
methodology. EPA approved the Part 243 revisions effective August 8, 2019. 24
Additionally, for the recently finalized Revised CSAPR Update, EPA will establish initial
allowance allocations to existing units under a Federal Implementation Plan using the
allocation methodology contained in this approved regulation. 25
CSAPR targets NOx emissions from fossil fuel-fired electric generating unit (EGU)
sources serving, at any time on or after January 1, 2005, a generator with nameplate
capacity of more than 25 megawatts producing electricity for sale. CSAPR allows these
sources to trade emissions allowances with other sources within or across states, while
firmly constraining any emissions shifting that may occur by requiring a strict emission
ceiling in each state (i.e. the budget plus variability limit). It also includes assurance
provisions that ensure each state will make the necessary emission reductions by
requiring additional allowance surrenders in the instance that emissions in the state
exceed the state’s assurance level.
Part 249: Best Available Retrofit Technology (BART)
DEC’s BART regulation was promulgated in response to the federal rule for regional
haze which is aimed at reducing the impacts of visibility-impairing pollutants on Class I
areas. The BART program targets emissions of NOx (as well as SO 2 and coarse
particulate matter (PM10)) from certain categories of stationary sources which began
operation between 1962 and 1977. DEC identified 19 subject facilities in New York
State, which are complying through a variety of options including unit shutdown,
emission caps, add-on control technology, and process modifications.
MACT
Under section 112 of the 1990 CAA Amendments, HAPs are required to be controlled
by what is determined to be the Maximum Achievable Control Technology (MACT).
Since many organic HAPs are also VOCs, the use of MACT results in the reduction of
VOC as well as NOx emissions. DEC has been adopting MACT control requirements as
they have been developed by EPA and has therefore been realizing the reductions
resulting from the MACT program. These federal regulations are incorporated by
reference in 6 NYCRR 200.10 (Tables 3 and 4).
23
“Federal Implementation Plans: Interstate Transport of Fine Particulate Matter and Ozone and Correction of SIP
Approvals.” Final Rule. Published August 8, 2011; effective October 7, 2011. 76 FR 48208-48483.
24
“Approval of Air Quality Implementation Plans; New York; Cross-State Air Pollution Rule; NOx.” Final Rule.
Published and effective August 8, 2019. 84 FR 38878-38882.
25
“Revised Cross-State Air Pollution Rule Update for the 2008 Ozone NAAQS,” Final Rule. Published April 30, 2021;
effective June 29, 2021. 86 FR 23054.
Section 2 | Page 7 of 11Federal Reformulated Gasoline – Phase I and II
CAA section 211(k) requires that reformulated gasoline be sold in certain ozone
nonattainment areas. The current federal Phase II reformulated gasoline standards,
effective January 1, 2000, require 25 to 29 percent VOC emission reductions. Retail
distribution of reformulated gasoline is required in the NYMA and Orange County.
Dutchess County has also opted into the reformulated gasoline program.
Federal Highway Diesel Fuel (with State Backstop) and Heavy-Duty Highway
Diesel Emissions Standards
New York State’s motor vehicle diesel fuel program is identical to the EPA motor vehicle
diesel fuel regulations, which regulate the heavy-duty vehicle and its fuel as a single
system. EPA published its final rule for heavy-duty diesel engines that would reduce
NOx emissions by 95 percent from then-current levels (in addition to reducing PM by 90
percent) on January 18, 2001.26
These standards, which apply to heavy-duty highway engines and vehicles greater than
8,500 pounds GVWR, are based on the use of high-efficiency catalytic exhaust
emission control devices or comparably effective advanced technologies. DEC adopted
CARB heavy-duty diesel standards for model years 2005-2007 (to prevent backsliding
that may have occurred under the federal standards) and reverted to the federal
standards for 2008 and beyond.
The rule’s emission limits were phased in between 2007 and 2010. It established
standards for NOx and non-methane hydrocarbons of 0.20 grams per brake
horsepower-hour (g/bhp-hr) and 0.14 g/bhp-hr, respectively. EPA projects a 2.6 million-
ton reduction of NOx emissions in 2030 when the current heavy-duty vehicle fleet is
completely replaced with newer heavy-duty vehicles that comply with these emission
standards. The sulfur content of diesel fuel was reduced by 97 percent to 15 ppm to
allow for the necessary control devices to achieve such a reduction.
Federal Non-Highway Diesel Fuel and Emissions Standards
EPA published a rule to regulate emissions of NOx and PM from nonroad diesel
vehicles on June 29, 2004.27 Overall, the rule is projected to result in a 90 percent
reduction in NOx emissions, equivalent to 738,000 tons annually by 2030.
The non-road standards apply to diesel engines that are used in construction,
agricultural, industrial, and airport applications. Standards varied by engine size with
implementation dates beginning in 2008. The rule was fully phased-in as of 2015. This
rule also took advantage of the new low-sulfur fuel requirements in order to achieve the
necessary NOx and PM reductions.
26
“Control of Air Pollution from New Motor Vehicles: Heavy-Duty Engine and Vehicle Standards and Highway Diesel
Fuel Sulfur Control Requirements.” Final Rule. Published January 18, 2001; effective March 19, 2001. 66 FR 5002-
5193.
27
“Control of Emissions of Air Pollution from Nonroad Diesel Engines and Fuel.” Final Rule. Published June 29, 2004;
effective August 30, 2004. 69 FR 38958-39273.
Section 2 | Page 8 of 11You can also read