Multi-modal volumetric concept activation to explain detection and classification of metastatic prostate cancer on PSMA-PET/CT
←
→
Page content transcription
If your browser does not render page correctly, please read the page content below
Multi-modal volumetric concept activation to
                                          explain detection and classification of metastatic
                                                prostate cancer on PSMA-PET/CT

                                              R.C.J. Kraaijveld1 , M.E.P. Philippens2 , W.S.C. Eppinga2 , I.M. Jürgenliemk
                                                 -Schulz2 , K.G.A. Gilhuijs1 , P.S. Kroon2 , and B.H.M. van der Velden1
arXiv:2208.02555v1 [eess.IV] 4 Aug 2022

                                              1
                                               Image Sciences Institute, University Medical Center Utrecht, The Netherlands
                                          2
                                              Department of Radiotherapy, University Medical Center Utrecht, The Netherlands

                                                   Abstract. Explainable artificial intelligence (XAI) is increasingly used
                                                   to analyze the behavior of neural networks. Concept activation uses
                                                   human-interpretable concepts to explain neural network behavior. This
                                                   study aimed at assessing the feasibility of regression concept activation
                                                   to explain detection and classification of multi-modal volumetric data.
                                                   Proof-of-concept was demonstrated in metastatic prostate cancer pa-
                                                   tients imaged with positron emission tomography/computed tomogra-
                                                   phy (PET/CT). Multi-modal volumetric concept activation was used to
                                                   provide global and local explanations.
                                                   Sensitivity was 80% at 1.78 false positive per patient. Global explanations
                                                   showed that detection focused on CT for anatomical location and on PET
                                                   for its confidence in the detection. Local explanations showed promise
                                                   to aid in distinguishing true positives from false positives. Hence, this
                                                   study demonstrated feasibility to explain detection and classification of
                                                   multi-modal volumetric data using regression concept activation.

                                                   Keywords: Explainable artificial intelligence · XAI · Interpretable deep
                                                   learning · Medical image analysis · Prostate cancer · PET/CT

                                          1       Introduction

                                             Deep learning has revolutionized medical image analysis. The neural net-
                                          works used in deep learning typically consist of many layers connected via many
                                          nonlinear intertwined connections. Even if one was to inspect all these layers
                                          and connections, it is impossible to fully understand how the neural network
                                          reached its decision [17]. Hence, deep learning is often regarded as a “black box”
                                              This paper has been accepted as: Kraaijveld, R.C.J., Philippens, M.E.P., Eppinga,
                                              W.S.C., Jürgenliemk-Schulz, I.M., Gilhuijs, K.G.A., Kroon, P.S., van der Velden,
                                              B.H.M. “Multi-modal volumetric concept activation to explain detection and clas-
                                              sification of metastatic prostate cancer on PSMA-PET/CT.” Medical Image Com-
                                              puting and Computer Assisted Intervention (MICCAI) workshop on Interpretability
                                              of Machine Intelligence in Medical Image Computing (iMIMIC), 2022.
2 R.C.J. Kraaijveld et al.
[17]. In high-stakes decision-making such as medical applications, this can have
far-reaching consequences [18].
Medical experts have voiced their concern about this black box nature, and
called for approaches to better understand the black box [11]. Such approaches
are commonly referred to as interpretable deep learning or explainable artifi-
cial intelligence (XAI) [1]. Visual explanation is the most frequently used XAI
[21]. There is increasing evidence that the saliency maps that provide this visual
explanation are to be used with caution [2,3,6]. For example, they can be in-
correct and not correspond to what the end-user expected from the explanation
(i.e., low validity) or lack robustness [21]. Hence, such methods may not be as
interpretable as desired.
In response to “uninterpretable” XAI, Kim et al. proposed to use human-
interpretable concepts for explaining models (e.g. a neural network) [12]. Exam-
ples of such concepts are a spiculated tumor margin – a sign of malignant breast
cancer [8] – or the short axis of a metastatic lymph node in a prostate cancer
patient, which has been related to patient prognosis [16]. Using concepts, Kim
et al. were able to test how much a concept influenced the decision of the model
(i.e., concept activation) [12].
Concept activation has been used in medical image analysis to explain clas-
sification techniques using binary concepts [12] – such as the presence of micro-
aneurysms in diabetic retinopathy – and continuous concepts (i.e., regression
concept activation) [9] – such as the area of nuclei in breast histopathology. To
the best of our knowledge, the promise of concept activation has not yet been
shown in detection, 3-dimensional volumetric data, or multi-modal data.
The aim of this study was to assess the feasibility of regression concept acti-
vation to explain detection and classification of multi-modal volumetric data. We
demonstrated proof-of-concept in patients who had metastatic prostate cancer.
2 Data
A total of 88 consecutively included male patients with oligometastatic (i.e., five
or less metastatic lymph nodes) prostate cancer from the University Medical
Center Utrecht were analysed. All patients gave written informed consent and
the study was approved by the local medical ethics committee [22]. Median age
was 71 years with an interquartile interval of 67–74 years.
Patients were imaged using 68 Ga prostate-specific membrane antigen positron
emission tomography and computed tomography (PSMA-PET/CT) (Figure 1).
The in-plane voxel size of the PET scans ranged from 1.5 mm2 to 4.1 mm2 , slice
thickness ranged from 1.5 mm to 5.0 mm. The in-plane voxel size of the CT
scans ranged from 0.84 mm2 to 1.4 mm2 , slice thickness was 2.0 mm.
Metastatic lymph nodes were delineated by a radiation oncologist in consen-
sus with a nuclear medicine physician. Furthermore, lymph nodes were confirmed
on magnetic resonance imaging.Multi-modal volumetric concept activation 3 Fig. 1. Example of a prostate cancer patient with three metastatic lymph nodes. Left: maximum intensity projection (MIP) of prostate-specific membrane antigen positron emission tomography (PSMA-PET) showing three metastatic lymph nodes. Right: re- gion of interest (ROI) showing one of the metastatic lymph nodes on PSMA-PET and on computed tomography (CT). 3 Method In short, we first detected the metastases and subsequently filtered out false pos- itive detections at high sensitivity using classification. XAI was used on both the detection and the classification to provide global and local explanation (Figure 2).
4       R.C.J. Kraaijveld et al.

Fig. 2. Schematic overview of the method. First, nnDetection detects metastatic lymph
nodes on multi-modal volumetric positron emission tomography and computed tomog-
raphy (PET/CT) images. These detections are then refined using EfficientNet. An
XAI – multi-modal volumetric concept activation – is used to provide global and local
explanations. CS = confidence score.

3.1   Preprocessing

PET scans were registered to the CT scans. Data was split into 70 patients for
training/validation and 18 patients for testing. This resulted in 109 metastatic
lymph nodes for training and 30 for testing.

3.2   Detection

nnDetection [4] was used to detect the metastatic lymph nodes. Input to nnDe-
tection were PET/CT images, output were 3D bounding boxes with correspond-
ing intersection-over-union and confidence scores. Hyperparameters were opti-
mized by nnDetection.
    The results of nnDetection were evaluated using Free-response Receiver Op-
erating Characteristics. To ensure high metastatic lymph node detection rate,
the intersection-over-union and confidence scores were thresholded at high sen-
sitivity.
Multi-modal volumetric concept activation 5
3.3 Classification
EfficientNet [19] was used to subsequently filter out false positive detections by
classifying bounding boxes originating from nnDetection. PET/CT volumes of
96 × 96 × 96 (i.e., patches) were extracted. These patches were input to Efficient-
Net, output were binary classes representing whether there was a metastatic
lymph node present or not. EfficientNet was trained using Adam optimizer and
cross entropy loss. The initial learning rate was set as 0.001 and decreased step-
wise by 0.10 every 5 epochs. EfficientNet was trained for 25 epochs with early-
stopping. Augmentation included horizontal and vertical flipping, translation,
scaling and rotation. Weighted random sampling was used to minimize the ef-
fect of class imbalance.
The results of EfficientNet were evaluated using Receiver Operating Charac-
teristics. To preserve true positives while reducing false positive that originated
from nnDetection, the posterior probability per patch was thresholded at high
sensitivity.
3.4 Explainable AI
We provided explanations of both nnDetection and EfficientNet using volumetric
regression concept attribution.
Volumetric regression concept attribution yields global explanations, i.e.,
which concepts explain the overall behavior of the neural network, and local
explanations, i.e., which concepts explain how the neural network came to a
decision for a specific lymph node.
The concepts used in this study were extracted using PyRadiomics [20]. This
yields human-interpretable concepts per lymph node such as volume, circularity
in 3D, and intensity on PET and CT, but also less interpretable concepts such
as higher order texture features. The concepts were calculated from PET and
CT, after applying masks which were automatically generated using an adaptive
PET threshold of 40% [7,10].
Global explanations were provided using four measures that quantify volu-
metric regression concept attribution:
1. Pearson’s correlation coefficient ρ was calculated between each feature and
either the confidence scores in case of nnDetection or the posterior proba-
bility in case of EfficientNet.
2. The regression coefficient and regression concept vector were assessed per
feature by fitting a linear model between layer activations and feature values.
For each layer in the neural network, a regression coefficient can be quantified
per concept, revealing the learning behavior of the neural network.
3. Sensitivity scores were calculated which indicate the influence of the concept
on the outcome of the neural network result.
4. The bidirectional relevance was calculated for each concept by taking the
product of the regression coefficient and the inverse of the coefficient of
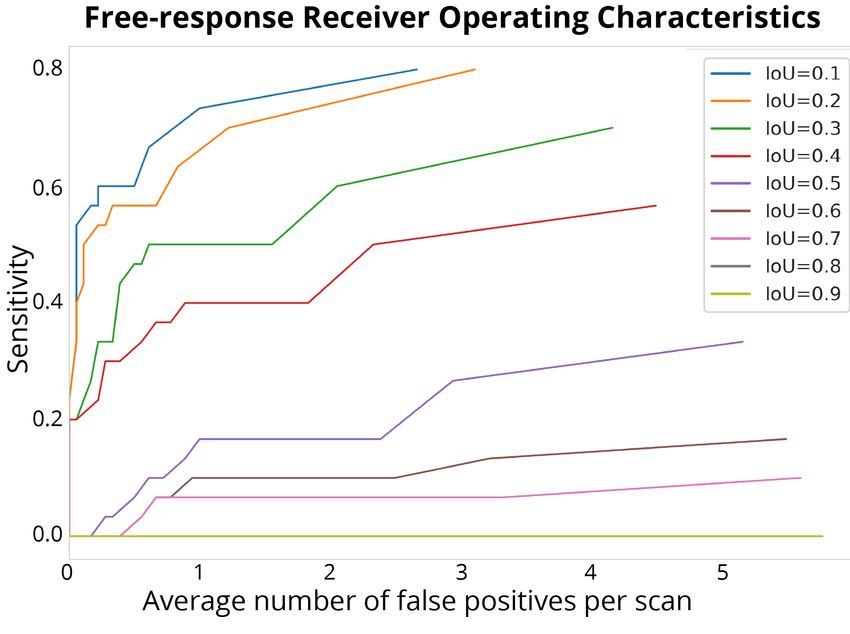
variation of the sensitivity scores.6 R.C.J. Kraaijveld et al. Local explanations were provided by comparing the sensitivity score of a concept per input image to the mean sensitivity of that concept. The difference between these sensitivity scores can be used as a similarity measure of that input image to an output class (e.g., metastatic lymph node). Computation: Deep learning was done in PyTorch 1.8 on an NVIDIA GeForce 2080Ti. Code will be available at https://github.com/basvandervelden/mmvca. 4 Results 4.1 Detection Fig. 3. At an intersection-over-union (IoU) of 0.1, 0.80 sensitivity was obtained at 2.66 false positives per patient (top line). At an intersection-over-union of 0.1, a sensitivity of 0.80 was obtained at an average of 2.66 false positive per patient (Figure 3). In total, 24 out of 30 lymph nodes were detected at the cost of 48 false positives. 4.2 Classification EfficientNet showed an additional reduction of 16 of the 48 false positives that originated from nnDetection (33% reduction), while maintaining all true posi- tives. Hence, the final amount of false positives per patient was 1.78.
Multi-modal volumetric concept activation       7

4.3   Explainable AI
Global explanations: Table 1 shows the top ten concepts with the highest
Pearson’s correlation coefficient ρ between the concepts and confidence scores
of the bounding boxes from nnDetection. All these top ten concepts originate
from the PET scan. Figure 4 shows the top ten bidirectional relevance scores for
nnDetection. All these top ten concepts originate from the CT scan.

          Concept                                   ρ         P-value
          PET GLCM DifferenceAverage                0.186     5 0.001
          PET GLCM DifferenceEntropy                0.185     5 0.001
          PET Firstorder Range                      0.185     5 0.001
          PET GLSZM SizeZoneNonUniformity           0.176     5 0.001
          PET Firstorder Maximum                    0.175     5 0.001
          PET GLRLM RunEntropy                      0.168     5 0.001
          PET Firstorder Entropy                    0.152     5 0.001
          PET GLCM SumEntropy                       0.148     5 0.001
          PET Firstorder MeanAbsoluteDeviation 0.147          5 0.001
          PET GLDM SmallDependenceEmphasis 0.140              5 0.001
Table 1. All of the top ten correlations between concepts and the confidence scores
of the bounding boxes originate from the positron emission tomography (PET) scan.
GLCM = Gray Level Cooccurence Matrix, First order = First order statistics, GLSZM
= Gray Level Size Zone Matrix, GLRLM = Gray Level Run Length Matrix, GLDM
= Gray Level Dependence Matrix.

    Table 2 shows the top ten concepts with the highest Pearson’s correlation
coefficient ρ between the concept and the posterior probability of a metastatic
lymph node in the patch. Figure 4 shows which concepts influence the classifica-
tion results the most. These top ten concepts for both XAI measures originate
from the PET scan.

Local explanations: Figure 5 shows how the local explanations can be used by
a physician. Each case was ranked according to its similarity with a metastatic
lymph node and its top ten concepts.
    To further investigate the six undetected lymph nodes from nnDetection, we
also evaluated these in a post hoc analysis with EfficientNet. Four of the six
(66%) false negatives were correctly classified as a lymph node. Local explana-
tions showed that the two incorrectly classified lymph nodes had low similarity
with the class metastatic lymph node, according to the top ten concepts.

5     Discussion
This study showed feasibility of regression concept activation to explain detec-
tion and classification of multi-modal volumetric data. In 88 oligometastatic
8 R.C.J. Kraaijveld et al.
Fig. 4. The top ten concepts with the highest bidirectional relevance originate from the
computed tomography (CT) scan for nnDetection (left) and from the positron emission
tomography (PET) scan for EfficientNet (right). GL = Gray level, Norm = normalized,
GLRLM = Gray Level Run Length Matrix, GLSZM = Gray Level Size Zone Matrix,
First order = First order statistics, GLCM = Gray Level Cooccurence Matrix, GLDM
= Gray Level Dependence Matrix.
Concept ρ p-value
PET First order Range 0.449 5 0.001
PET GLCM SumAverage 0.444 5 0.001
PET GLCM JointAverage 0.444 5 0.001
PET First order Median 0.442 5 0.001
PET First order Maximum 0.436 5 0.001
PET First order Mean 0.430 5 0.001
PET First order RootMeanSquared 0.429 5 0.001
PET GLCM MCC 0.428 5 0.001
PET First order 10Percentile 0.425 5 0.001
PET First order 90Percentile 0.423 5 0.001
Table 2. All of the top ten correlations between concepts and the posterior probability
of a metastatic lymph node in the patch originate from the positron emission tomogra-
phy (PET) scan. First order = First order statistics, GLCM = Gray Level Cooccurence
Matrix.
prostate cancer patients, our method was able to provide realistic global and
local explanations.
The global explanations for nnDetection yielded plausible results. Confidence
scores of nnDetection’s bounding boxes were all positively correlated with con-
cepts from the PET scan, whereas the concepts that influenced the position of
the bounding boxes came from the CT scan. In other words, the CT scan pro-
vides detailed anatomical information explaining in which region of the patient
lymph nodes could be present, whereas the PET scan influences how confidentMulti-modal volumetric concept activation 9
Fig. 5. True positive (left) and false positive finding (right) with their corresponding
local explanation underneath. It can be seen that the sensitivity scores of the left
PET/CT patch reflects the class sensitivity scores. In the right PET/CT patch the
sensitivity scores differ substantially from the class sensitivity scores. Hence, this local
explanation can give an extra confirmation to the physician to rule this a false positive.
GLCM = Gray Level Cooccurence Matrix, GLRLM = Gray Level Run Length Matrix,
GLDM = Gray Level Dependence Matrix, First order = First order statistics.
the network is that the detection is actually a metastatic lymph node. Since
PSMA-PET is designed for this specific goal, these explanations are plausible.
The global explanations for EfficientNet also yielded plausible results. The
posterior probability whether a metastatic lymph node was present in a patch
was mostly correlated with concepts from the PET scan. This again makes sense,
since the volume of interest was already narrowed down, making the anatomical
information from the CT scan less important in this part of the analysis.
Local explanations were aimed at providing a framework for physicians to
evaluate on an individual lesion basis how the algorithm came to its conclusion,
and whether they trust the algorithms decision. This has potential for decision
support in the more difficult lesion in which the physician is potentially unsure.
This study has some limitations. Firstly, nnDetection misses six metastatic
lymph nodes, leading to a sensitivity of 80%. This is, however, similar to sen-
sitivities reported in literature [13]. The local explanations yielded insight into
why these six false negative lymph nodes were not detected: Their concepts
showed a large contrast with for example the detected lymph nodes. By taking10 R.C.J. Kraaijveld et al.
this into account, in future work, the explanations can be used to further opti-
mize the neural network [14,15]. Secondly, we did not evaluate our explanations
with end-users such as radiation oncologists. Future work should evaluate these
explanations with intended end-users, i.e., application-grounded evaluation [5].
Lastly, we demonstrate our approach in a single center study population. Larger
validation would be desired in future research.
6 Conclusion
To conclude, we showed that it is feasible to explain detection and classification
of multi-modal volumetric data using regression concept activation.
References
1. Adadi, A., Berrada, M.: Peeking inside the black-box: a survey on explainable
artificial intelligence (XAI). IEEE access 6, 52138–52160 (2018)
2. Adebayo, J., Gilmer, J., Muelly, M., Goodfellow, I., Hardt, M., Kim, B.: Sanity
checks for saliency maps. Advances in neural information processing systems 31
(2018)
3. Arun, N., Gaw, N., Singh, P., Chang, K., Aggarwal, M., Chen, B., Hoebel, K.,
Gupta, S., Patel, J., Gidwani, M., et al.: Assessing the trustworthiness of saliency
maps for localizing abnormalities in medical imaging. Radiology: Artificial Intelli-
gence 3(6) (2021)
4. Baumgartner, M., Jäger, P.F., Isensee, F., Maier-Hein, K.H.: nndetection: A self-
configuring method for medical object detection. In: International Conference
on Medical Image Computing and Computer-Assisted Intervention. pp. 530–539.
Springer (2021)
5. Doshi-Velez, F., Kim, B.: Towards a rigorous science of interpretable machine learn-
ing. arXiv preprint arXiv:1702.08608 (2017)
6. Eitel, F., Ritter, K., (ADNI, A.D.N.I., et al.: Testing the robustness of attribution
methods for convolutional neural networks in MRI-based Alzheimer’s disease clas-
sification. In: Interpretability of machine intelligence in medical image computing
and multimodal learning for clinical decision support, pp. 3–11. Springer (2019)
7. Erdi, Y.E., Mawlawi, O., Larson, S.M., Imbriaco, M., Yeung, H., Finn, R., Humm,
J.L.: Segmentation of lung lesion volume by adaptive positron emission tomog-
raphy image thresholding. Cancer: Interdisciplinary International Journal of the
American Cancer Society 80(S12), 2505–2509 (1997)
8. Gilhuijs, K.G., Giger, M.L., Bick, U.: Computerized analysis of breast lesions
in three dimensions using dynamic magnetic-resonance imaging. Medical physics
25(9), 1647–1654 (1998)
9. Graziani, M., Andrearczyk, V., Marchand-Maillet, S., Müller, H.: Concept attribu-
tion: Explaining CNN decisions to physicians. Computers in biology and medicine
123, 103865 (2020)
10. Im, H.J., Bradshaw, T., Solaiyappan, M., Cho, S.Y.: Current methods to define
metabolic tumor volume in positron emission tomography: which one is better?
Nuclear medicine and molecular imaging 52(1), 5–15 (2018)
11. Jia, X., Ren, L., Cai, J.: Clinical implementation of AI technologies will require
interpretable AI models. Medical physics 47(1), 1–4 (2020)Multi-modal volumetric concept activation 11
12. Kim, B., Wattenberg, M., Gilmer, J., Cai, C., Wexler, J., Viegas, F., et al.: Inter-
pretability beyond feature attribution: Quantitative testing with concept activation
vectors (tcav). In: International conference on machine learning. pp. 2668–2677.
PMLR (2018)
13. Kim, S.J., Lee, S.W., Ha, H.K.: Diagnostic performance of radiolabeled prostate-
specific membrane antigen positron emission tomography/computed tomography
for primary lymph node staging in newly diagnosed intermediate to high-risk
prostate cancer patients: a systematic review and meta-analysis. Urologia inter-
nationalis 102(1), 27–36 (2019)
14. Lund, C.B., van der Velden, B.H.: Leveraging clinical characteristics for improved
deep learning-based kidney tumor segmentation on CT. In: International Challenge
on Kidney and Kidney Tumor Segmentation. pp. 129–136. Springer (2022)
15. Mahapatra, D., Ge, Z., Reyes, M.: Self-supervised generalized zero shot learning for
medical image classification using novel interpretable saliency maps. IEEE Trans-
actions on Medical Imaging (2022)
16. Meijer, H.J., Debats, O.A., van Lin, E.N., Witjes, J.A., Kaanders, J.H., Barentsz,
J.O.: A retrospective analysis of the prognosis of prostate cancer patients with
lymph node involvement on MR lymphography: who might be cured. Radiation
Oncology 8(1), 1–7 (2013)
17. Murdoch, W.J., Singh, C., Kumbier, K., Abbasi-Asl, R., Yu, B.: Definitions, meth-
ods, and applications in interpretable machine learning. Proceedings of the Na-
tional Academy of Sciences 116(44), 22071–22080 (2019)
18. Rudin, C.: Stop explaining black box machine learning models for high stakes
decisions and use interpretable models instead. Nature Machine Intelligence 1(5),
206–215 (2019)
19. Tan, M., Le, Q.: Efficientnet: Rethinking model scaling for convolutional neural
networks. In: International conference on machine learning. pp. 6105–6114. PMLR
(2019)
20. Van Griethuysen, J.J., Fedorov, A., Parmar, C., Hosny, A., Aucoin, N., Narayan,
V., Beets-Tan, R.G., Fillion-Robin, J.C., Pieper, S., Aerts, H.J.: Computational
radiomics system to decode the radiographic phenotype. Cancer research 77(21),
e104–e107 (2017)
21. van der Velden, B.H., Kuijf, H.J., Gilhuijs, K.G., Viergever, M.A.: Explainable
artificial intelligence (XAI) in deep learning-based medical image analysis. Medical
Image Analysis p. 102470 (2022)
22. Werensteijn-Honingh, A.M., Wevers, A.F., Peters, M., Kroon, P.S., Intven, M., Ep-
pinga, W.S., Jürgenliemk-Schulz, I.M.: Progression-free survival in patients with
68Ga-PSMA-PET-directed SBRT for lymph node oligometastases. Acta Oncolog-
ica 60(10), 1342–1351 (2021)You can also read