Mitochondrial metabolism drives hypercholesterolemia-induced breast cancer cell migration
←
→
Page content transcription
If your browser does not render page correctly, please read the page content below
Mitochondrial metabolism drives hypercholesterolemia-induced breast cancer cell migration Sandrina Nobrega-Pereira ( sandrina.pereira@ua.pt ) Instituto de Biomedicina (iBiMED), Departamento de Ciências Médicas, Universidade de Aveiro https://orcid.org/0000-0002-9652-1382 Teresa Sera m Instituto de Medicina Molecular, Faculdade de Medicina, Universidade de Lisboa https://orcid.org/0000-0003-4924-5204 Ana Patrícia Lopes Instituto de Medicina Molecular, Faculdade de Medicina, Universidade de Lisboa Miguel Santos Instituto de Medicina Molecular, Faculdade de Medicina, Universidade de Lisboa Filipa Carvalho University Lisbon - Faculty of Sciences Bruno Bernardes de Jesus Instituto de Biomedicina (iBiMED), Departamento de Ciências Médicas, Universidade de Aveiro Vanessa Morais iMM - Institute of Molecular Medicine Sérgio Dias Instituto de Medicina Molecular, Faculdade de Medicina, Universidade de Lisboa Article Keywords: mitochondria, ROS, cell migration, low-density lipoprotein, triple negative breast cancer Posted Date: February 22nd, 2022 DOI: https://doi.org/10.21203/rs.3.rs-1338648/v1 License: This work is licensed under a Creative Commons Attribution 4.0 International License. Read Full License
1

 2

 3       Mitochondrial metabolism drives hypercholesterolemia-induced breast
 4                                     cancer cell migration
 5

 6

 7   Sandrina Nóbrega-Pereira1,2,♯ , Teresa L. Serafim1, Ana Patrícia Lopes1, Miguel

 8       Santos3, Filipa S. Carvalho1, Bruno Bernardes de Jesus2, Vanessa A. Morais1

 9                                      and Sérgio Dias1,3, ♯

10
     1
11     Instituto de Medicina Molecular, Faculdade de Medicina, Universidade de
12   Lisboa, 1649-028 Lisboa, Portugal; 2 Instituto de Biomedicina (iBiMED),
13   Departamento de Ciências Médicas, Universidade de Aveiro, 3810-193 Aveiro,
14   Portugal; 3 Faculdade de Medicina, Universidade de Lisboa, 1649-028 Lisboa,
15   Portugal.
16
17
18   Keywords: mitochondria, ROS, cell migration, low-density lipoprotein, triple
19   negative breast cancer
20
     ♯
21    Corresponding Authors:
22   E-mail: sandrina.pereira@ua.pt; sergiodias@medicina.ulisboa.pt.
23
24
25
26
27

     Nóbrega-Pereira et al., manuscript in preparation
                                                                                       1
28

29
30   Abstract

31   Most cancer related deaths are due to metastases. Systemic factors, such as

32   lipid-enriched environments (particularly LDL-cholesterol), favor breast cancer

33   (including triple negative breast cancer, TNBC) metastasis formation.

34   Mitochondria metabolism impacts TNBC invasive behavior but its involvement in

35   a lipid-enriched setting is undisclosed. Here we show that LDL-cholesterol

36   induces CD36, increases lipid droplets and augments TNBC cells migration and

37   invasion in vivo and in vitro. LDL increases mitochondrial mass and mitochondria

38   spread in migrating cells, and energetic analyses revealed that LDL renders

39   TNBC dependent on fatty acids for mitochondrial respiration. Indeed,

40   engagement of fatty acid oxidation, but not glycolysis, is required for LDL-induced

41   migration and mitochondrial remodeling. Moreover, LDL induced reactive oxygen

42   species (ROS) production by TNBC cells. Importantly, CD36 or ROS blockade

43   abolished LDL-induced cell migration and mitochondria metabolic adaptations.

44   Our data suggest that LDL induces TNBC cells migration by reprogramming

45   mitochondrial metabolism, revealing a new vulnerability in metastatic breast

46   cancer.

47

48

49

     Nóbrega-Pereira et al., manuscript in preparation
                                                                                      2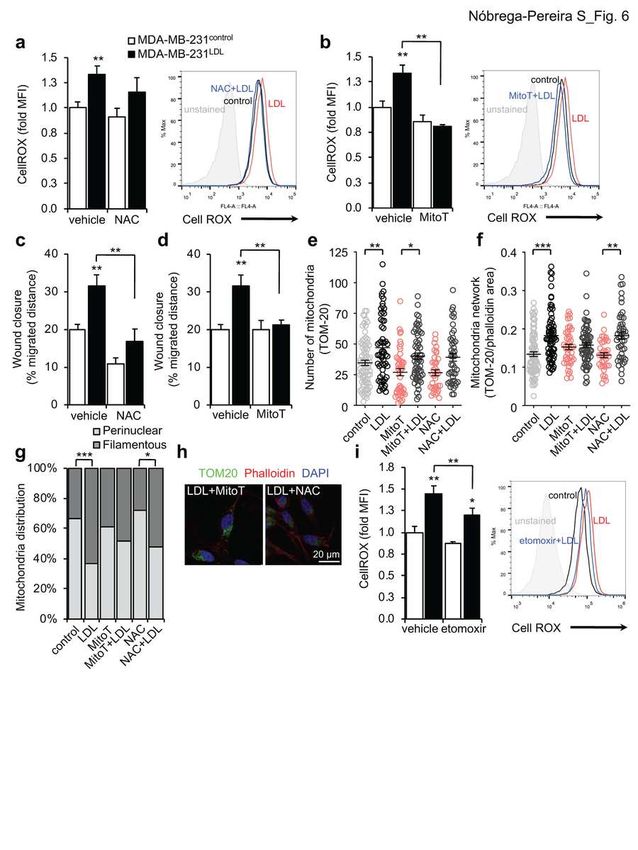
50   Introduction

51   Cancer metabolism is widely recognized as a key aspect of tumor initiation and

52   progression, and several metabolic adaptations carried by cancer cells to support

53   tumor growth and proliferation have been described1–3. Cancer cells are no

54   longer thought to obtain all of their energy solely from glycolysis (the so-called

55   “Warburg’s effect”), and, certainly, not because of mitochondrial defects. Tumors

56   are heterogeneous masses that comprise different cell types, which have the

57   ability to adopt to different metabolic programs. There is compelling evidence,

58   particularly in breast cancer, that migratory/invasive cancer cells specifically favor

59   mitochondrial respiration over aerobic glycolysis. It was shown that triple negative

60   breast cancer (TNBC) cells enhance oxidative phosphorylation (OXPHOS) and

61   mitochondrial biogenesis during metastasis formation and rely in fatty acid

62   oxidation (FAO) for the acquisition of an aggressive phenotype4–6. Lipid

63   metabolism is known to have a crucial role in cancer development and lipid

64   synthesis and consumption in tumors have been under scrutiny. There is a vast

65   epidemiological literature suggesting that obesity, and high cholesterol levels in

66   particular, may result in greater tumor incidence and worse cancer patient

67   outcomes7–9. In particular, our lab has described that elevated cholesterol levels

68   in untreated breast cancer patients strongly correlates with bigger and more

69   metastatic tumors10. Although this data suggests a strong association between

70   lipid-enriched environments and tumor progression, the exact nature of the lipidic

71   metabolic alterations that fuel tumorigenesis is not well understood. Importantly,

72   results from our lab and others, have shown that lipid-enriched environments

73   (particularly LDL-cholesterol) favor tumor progression in experimental murine

74   models of breast cancer by modulating the tumor microenvironment and favoring

     Nóbrega-Pereira et al., manuscript in preparation
                                                                                         3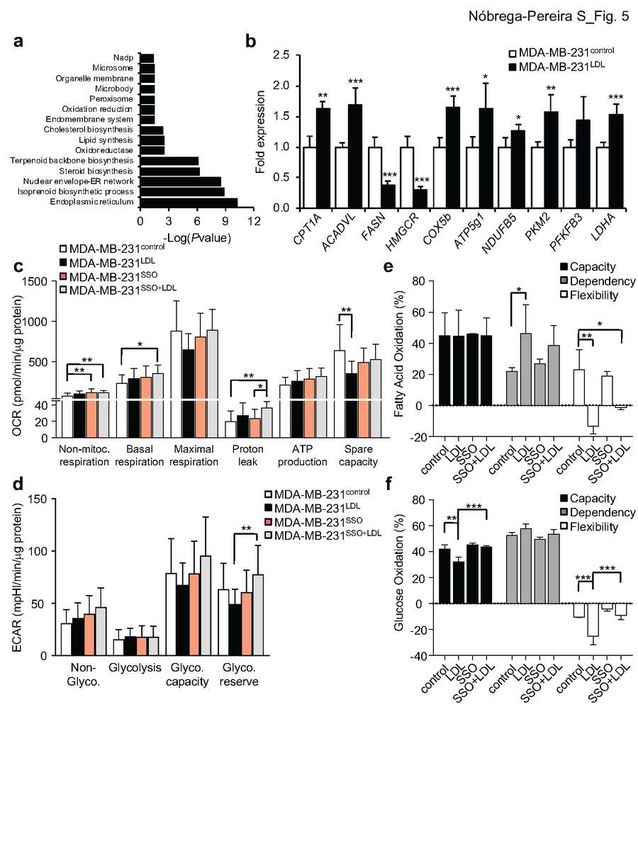
75   aggressive cancer cell autonomous properties, including increase TNBC cell

76   migration, proliferation and metastatic behavior11,12.

77   Whether the acquisition of such an aggressive, pro-metastatic, phenotype by

78   breast cancer cells exposed to elevated systemic lipid levels - and of LDL-

79   cholesterol in particular- is the result of specific mitochondria and metabolic

80   alterations is undisclosed and was the focus of the present study.

81

82

83

84

85
86

     Nóbrega-Pereira et al., manuscript in preparation
                                                                                  4
87 Results
88 LDL exposed TNBC cells display enhanced metastatic spread to distant
89 (and less vascularized) organs in xenotransplanted zebrafish larvae.
90 To explore the impact of LDL exposure on the behavior of BC cells in vivo, we
91 xenotransplanted human TNBC MDA-MB-231 cells into zebrafish larvae as a
92 model to study metastasis13,14. In the xenotransplanted zebrafish larvae, we
93 investigated whether pre-exposure of MDA-MB-231 cells to LDL for 2 days would
94 impact their migratory behavior and invasion to secondary organs (tropism) and
95 whether this was accompanied by alterations in the mitochondria network. Since
96 both cell conditions were inoculated in the same larvae, we used different cell
97 tracers (DiI for control and Cy5 for LDL-exposed cells) to discriminate the
98 experimental groups and cells were additionally transiently transfected with the
99 mitochondrial reporter Mito-YFP15.
100 We first analyzed the ability of LDL-exposed and control MDA-MB-231 cells to
101 migrate to distant organs in the zebrafish larvae at 4 days post-injection (dpi;
102 corresponding to 6 days post-fertilization) using inverted spinning disk confocal
103 microscopy (Fig. 1a). LDL-exposed MDA-MB-231 cells presented a trend toward
104 a differential migration pattern in the zebrafish larvae as compared to control cells
105 (Chi-square p=0.06, n=11) (Fig. 1a and Extended Data Fig. 1a), with a significant
106 number of zebrafish larvae accumulating LDL-exposed cells in the eye and
107 control cells in the caudal hematopoietic tissue (CHT), a highly vascularized
108 region with a dense plexus unifying caudal artery and caudal vein16. Moreover,
109 there was an increased number of zebrafish larvae displaying LDL-exposed
110 MDA-MB-231 cells at distant sites, being the dorsal fin, notochord, ventral fin and
111 tail fin invaded solely by LDL-exposed MDA-MB-231 cells (Fig. 1a).
Nóbrega-Pereira et al., manuscript in preparation
5112 To assess differential cell distribution in the whole organism, we quantified the
113 number of individual cells in each organ and the presence of tumor cell masses
114 in xenotransplanted zebrafish larvae at 4dpi. Similarly, LDL-exposed MDA-MB-
115 231 cells were found in all organs analyzed (Fig. 1b). Notably, less vascularized
116 organs were invaded preferentially by LDL-exposed MDA-MB-231 cells (Fig. 1b).
117 Of these, some were pierced by collateral vessels (dorsal muscle and ventral
118 muscle), by a single vessel (eye), or lied just beneath CHT (anal fin) and were
119 still invaded by MDA-MB-231 control cells; others (such as notochord, ventral fin,
120 dorsal fin, tail fin) have no detectable vessels in angiographic studies16 and in
121 xenotransplanted Tg (fli1:eGFP) zebrafish larvae at 6dpf (Extended Data Fig. 1b)
122 and were exclusively infiltrated by LDL-exposed MDA-MB-231 cells (Fig. 1b).
123 Although MDA-MB-231 control cells were found in higher proportion in extremely
124 vascularized organs (such as optic vesicle, heart, gills and CHT), LDL-exposed
125 MDA-MB-231 cells could also invade those vascularized organs displaying for
126 instance preferred accumulation in the intestinal tract (Fig. 1b).
127 We could also assess the colonization capability of MDA-MB-231 cells by
128 quantifying the presence of tumor cell masses (>20 cells) established after organ
129 colonization17 . There was no difference in the total number (LDL-exposed n=8
130 and control n=7) or distant location of the tumor masses (n=5 for both)
131 established between LDL-exposed and control MDA-MB-231 cells (Extended
132 Data Fig. 1c).
133 These results indicate that LDL alters the migratory and invasive capacity of
134 MDA-MB-231 cells, with cells invading organs with peripheral and less
135 vascularized location, which differ from the distribution of control cells that
136 preferentially accumulate in central and highly vascularized organs of the
Nóbrega-Pereira et al., manuscript in preparation
6137 zebrafish larvae.
138
139 LDL exposed TNBC cells display differential mitochondrial network in
140 xenotransplanted zebrafish larvae.
141 Since alterations in mitochondrial mass, network and dynamics have been
142 implicated in the acquisition of more aggressive and migratory behavior of cancer
143 cells4,18, we assessed if LDL-exposed TNBC cells present mitochondrial
144 alterations in the xenotransplanted zebrafish larvae, using the Mito-YFP reporter.
145 We observed an overall increased number of Mito-YFP particles in zebrafish
146 larvae xenotransplanted with LDL-exposed MDA-MB-231 cells (Fig. 1c). This
147 difference was statistically significant in most organs analyzed, including PVS,
148 intestinal tract and brain (Extended Data Fig. 1d), suggesting that LDL exposure
149 cell-autonomously increased the number of mitochondria in MDA-MB-231 cells.
150 Moreover, the average area of Mito-YFP particles, which reflects the size of
151 mitochondria, was overall reduced in LDL-exposed MDA-MB-231 cells
152 xenotransplanted into zebrafish larvae (Fig. 1d) and this difference was
153 particularly prominent in the PVS and intestinal tract (Extended Data Fig. 1e),
154 suggesting that LDL may reduce mitochondrial area per particle in MDA-MB-231
155 cells migrating in vivo. Finally, we quantified the mitochondrial network as the
156 total area occupied by Mito-YFP particles in the cell area delineated by the DiI
157 and Cy5 tracers and in general, LDL-exposed MDA-MB-231 cells presented a
158 higher mitochondrial network in xenotransplated zebrafish larvae as compared to
159 control MDA-MB-231 cells (Fig. 1e) and this difference was significant in the brain
160 (Extended Data Fig. 1f). Interestingly, LDL-exposed MDA-MB-231 cells also
161 present increased Mito-YFP and cell tracer total area (Extended Data Fig. 1g,h).
Nóbrega-Pereira et al., manuscript in preparation
7162 We could observe two phenotypes of mitochondrial network distribution:
163 mitochondrial aggregates (clusters) around the nucleus, often located
164 unilaterally, which we designated perinuclear mitochondria (Fig. 1f,g) and long
165 mitochondrial filaments, located unilaterally or bilaterally around the nucleus and
166 distributed throughout the whole cell, designated as filamentous mitochondria
167 (Fig. 1f,g). We observed that the majority of LDL-exposed MDA-MB-231
168 migrating cells in zebrafish larvae presented a filamentous distribution (54.7%
169 versus 33.3% for control cells) contrasting with control cells that adopted
170 preferentially a perinuclear mitochondrial network (66,7% versus 45.3% for LDL
171 cells). Filamentous distribution was more prevalent in LDL-exposed MDA-MB-
172 231 cells in most organs analyzed, being particularly evident in the brain, in
173 agreement with the qualitative analysis (Extended Data Fig. 1f, i).
174
175 LDL exposed migrating TNBC cells display differential mitochondrial
176 network and increased cristae destabilization.
177 To explore the mechanistic action of LDL, we went on to characterize the
178 mitochondrial alterations upon LDL exposure in migrating MDA-231 cells in vitro.
11
179 We have previously reported that LDL exposed MDA-MB-231 cells proliferate
180 two times more and display increased migratory capacity in a wound-healing
181 assay (Extended Data Fig. 2d). In accordance to what was observed in the
182 zebrafish xenotransplanted larvae, MDA-MB-231 migrating cells in the wound-
183 healing assay (for 18-24h with Mitomycin C for cell cycle arrest) exhibit increased
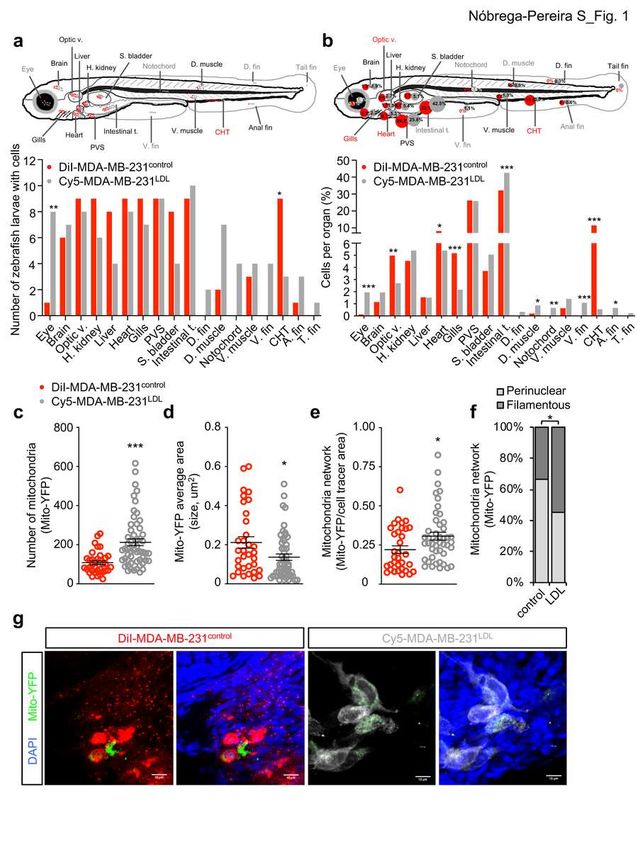
184 number of HSP-60 labelled mitochondria in the presence of LDL (Fig. 2a).
185 Additionally, we observed increase mitochondrial mass as determined by
186 mitochondrial DNA (mtDNA) content and MitoTracker Deep Red staining by flow
Nóbrega-Pereira et al., manuscript in preparation
8187 cytometry in LDL-exposed MDA-MB-231 migrating cells (Fig. 2b,c). LDL
188 exposure promoted a similar effect in the TNBC cell line MDA-MB-436, with
189 increased mitochondrial mass and migration in the wound healing assay
190 (Extended Data Fig. 2a,b). In agreement with the in vivo data, the impact of LDL
191 exposure in the HSP-60 labelled mitochondrial network of MDA-MB-231
192 migrating cells was very striking (Fig. 2d) with virtually all control cells presenting
193 a perinuclear (around the nucleus) mitochondrial network (96.8% versus 54.8%
194 for LDL cells; Fig. 2d) whereas the majority of LDL-exposed cells exhibited a
195 filamentous (extended through the cell area) network distribution (45.2% versus
196 3.2% for control cells; Fig. 2d). In order to account for technical artefacts inherent
197 to cell fixation, we confirmed these results using live MitoTracker Deep Red
198 imaging (Extended Data Fig. 2c). In order to investigate if mitochondrial network
199 adaptations in migrating MDA-MB-231 cells was exclusive for LDL exposure or
200 more broadly applies to other agents that induce cell migration, we treated cells
201 with lysophosphatidic acid (LPA), a phospholipid ligand that stimulates cell
202 migration through activation of PI3K/PAK1/ERK signaling19. As for LDL, MDA-
203 MB-231 cells exposed to LPA present increased migration in the wound-healing
204 assay (Extended Data Fig. 2d). However, and as opposed to LDL, LPA exposure
205 did not significantly alter the number of TOM-20 mitochondrial particles
206 (Extended Data Fig. 2e) or the mitochondrial network adopted by migrating cells
207 compared to the control situation (Extended Data Fig. 2f). We additionally
208 quantified the mitochondrial network as the total area occupied by TOM-20
209 mitochondrial particles in the cell area (delineated by phalloidin staining) and
210 observed that LDL-exposed MDA-MB-231 migrating cells presented increased
Nóbrega-Pereira et al., manuscript in preparation
9211 mitochondrial network as compared to the control or LPA-exposed MDA-MB-231
212 migrating cells (Fig. 2e).
213 Mitochondria are double membrane composed by an outer membrane (OM) that
214 surrounds the organelle and an inner membrane (IM), which is aligned adjacently
215 to the OM and forms numerous invaginations termed cristae20. In order to obtain
216 further insights into the impact of LDL in the mitochondria network of MDA-MB-
217 231 cells, we used transmission electron microscopy (TEM) to obtain high-
218 resolution micrographs and evaluate the organization of the mitochondrial inner
219 membrane cristae. TEM analysis confirmed that LDL-treated MDA-MB-231 cells
220 present increased number of mitochondria (Fig. 2f,g) and a tendency for
221 decreased average area of mitochondrial particles (Extended Data Fig. 2g),
222 similarly to what was observed in the xenotransplanted zebrafish larvae (Fig. 1d).
223 LDL-exposed cells presented mitochondria with more heterogeneous cristae
224 density compared to control cells, where the number of cristae range only from 1
225 to 4 cristae per µm2 (Fig. 2h). Moreover, the mitochondria of control cells
226 presented increased proportion of cristae with smallest incident angle (0º, Fig.
227 2i), more parallel cristae arrangement, compared to LDL-exposed cells. Overall
228 these results suggest that LDL exposure promoted a cristae disarrangement in
229 the mitochondria inner membrane of MDA-MB-231 cells.
230 Mitochondria are highly dynamic organelles that undergo continuous changes in
231 morphology, degree of biogenesis and mitophagy21. Upon 48h exposure to LDL,
232 the expression of several mitochondrial biogenesis factors, including the master
233 regulator PGC-1α and the FAO coactivator PPARα were either unchanged or
234 reduced in migrating MDA-MB-231 cells (Extended Data Fig. 2h) and additionally
Nóbrega-Pereira et al., manuscript in preparation
10235 PGC-1α protein levels were pronouncedly reduced (Extended Data Fig. 2i),
236 suggesting that the mitochondrial adaptations in migrating TNBC cells upon LDL
237 exposure do not rely in PGC-1α expression. Regarding mitochondrial dynamics,
238 LDL-exposed MDA-MB-231 cells display increased expression of the
239 mitochondrial fission protein Drp1 with no difference in the expression of the
240 mitochondrial fusion proteins Mfn1 and Mfn2 (Fig. 2j and Extended Data Fig. 2j),
241 suggesting that LDL-exposure may potentiate mitochondrial fission resulting in
242 smaller mitochondria in MDA-MB-231 cells. Additional mitochondrial
243 morphological parameters can provide insight into mitochondrial dynamics,
244 where for instance, an elongation score closer to 1 is indicative of circular
245 mitochondria and more fragmented network and higher elongation scores are
246 characteristic of fused mitochondria22,23. Quantification of mitochondrial
247 morphology using a macro developed for ImageJ software23 revealed that MDA-
248 MB-231 cells present an elongation score close to 1 (Fig. 2k) under control or
249 under LDL exposure, suggesting that, and in accordance with the literature24
250 TNBC cells exhibit fragmented mitochondria and LDL-exposure did not alter this
251 parameter in a statistically significant manner.
252
253 LDL-induced TNBC cell migration is mediated by the fatty acid transporter
254 CD36.
255 Lipoproteins are complex particles composed of multiple proteins and lipids,
256 including cholesterol, phospholipids and triglycerides. Once internalized, LDL is
257 hydrolyzed in the endosome and lysosome and lipids are stored into lipid
Nóbrega-Pereira et al., manuscript in preparation
11258 droplets, being subsequently mobilized for several cellular processes, including
259 ATP production through FAO25. Indeed, we observed that exposure of MDA-MB-
260 231 cells to LDL for 48h in vitro resulted in a significant increase in lipid droplets
261 content as assayed by the neutral lipid dye BODIPY 493/503 (Bodipy) by flow
262 cytometry and live imaging (Fig. 3a,b). There are several types of membrane LDL
263 receptors and scavengers that mediate the endocytosis of native and modified
264 LDL, including the LDL receptor (LDL-R), SRBP1 and CD3626,27. We observed
265 that exposure to LDL for 48h promoted a dramatic reduction in the expression of
266 LDL-R and SRBP1 in MDA-MB-231 cells (Extended Data Fig. 3a) whereas the
267 expression of CD36 transcript and protein by flow cytometry is augmented (Fig.
268 3c and Extended Data Fig. 3a). To further explore the requirement of CD36 for
269 LDL-induced TNBC cell migratory phenotype, we inhibited CD36 using the small-
270 molecule inhibitor sulfosuccinimidyl oleate (SSO)28 and observed that SSO
271 treatment abrogated the LDL-induced migration of MDA-MB-231 cells in the
272 wound-healing assay (Fig. 3d) and this was accompanied by reduction in lipid
273 droplets content (Fig. 3e). Treatment with SSO was also effective at blocking the
274 increased proliferation of MDA-231 cells induced by LDL-exposure (Extended
275 Data Fig. 3b). Similarly, short hairpin RNA (shRNA)-mediated depletion of CD36
276 (Extended Data Fig. 3c) abrogated the LDL-induced increase migration of MDA-
277 MB-231 cells (Fig. 3f), and the lipid droplet content (Extended Data Fig. 3d). In
278 contrast, a neutralizing antibody against LDL-R had no impact in the LDL-induced
279 migration, proliferation or lipid droplet accumulation in MDA-MB-231 cells
280 (Extended Data Fig. 3e-g). Next, we went on to determine the impact of CD36
Nóbrega-Pereira et al., manuscript in preparation
12281 inhibition in the LDL-induced mitochondrial adaptations in migrating MDA-MB-
282 231 cells. Treatment with SSO abrogated the LDL-induced increase in
283 mitochondrial mass, as determined by relative mtDNA content (Fig. 3g) and the
284 mitochondrial markersTOM-20 (Fig. 3h) and HSP-60 (Fig. 3i and Extended Data
285 Fig. 3h) in migrating MDA-MB-231 cells. Moreover, CD36 knockdown also
286 abolished the LDL-induced increase in mtDNA content in MDA-MB-231 cells
287 (Extended Data Fig. 3i). SSO treatment abrogated the prevalent filamentous
288 mitochondrial network distribution present in LDL-exposed MDA-MB-231
289 migrating cells (Fig. 3j and Extended Data Fig. 3i) with an increase proportion of
290 co-treated SSO+LDL cells presenting a perinuclear network distribution (Fig. 3j:
291 perinuclear network 36.8% in LDL versus 45.5% in SSO+LDL). We additionally
292 performed a qualitative assessment of the mitochondrial network determined as
293 the area occupied by TOM-20 particles in the overall cell area delineated by
294 phalloidin staining, and observed that in the presence of SSO, LDL exposure did
295 not increase the mitochondrial network in migrating MDA-MB-231 cells (Fig. 3k).
296 Taken together, these results reveal that CD36 is specifically required for the
297 LDL-induced increase in lipid droplets, migration and mitochondrial network
298 remodeling in migrating MDA-MB-231 cells.
299
300 LDL-induced migratory behavior of TNBC cells relies in increased usage of
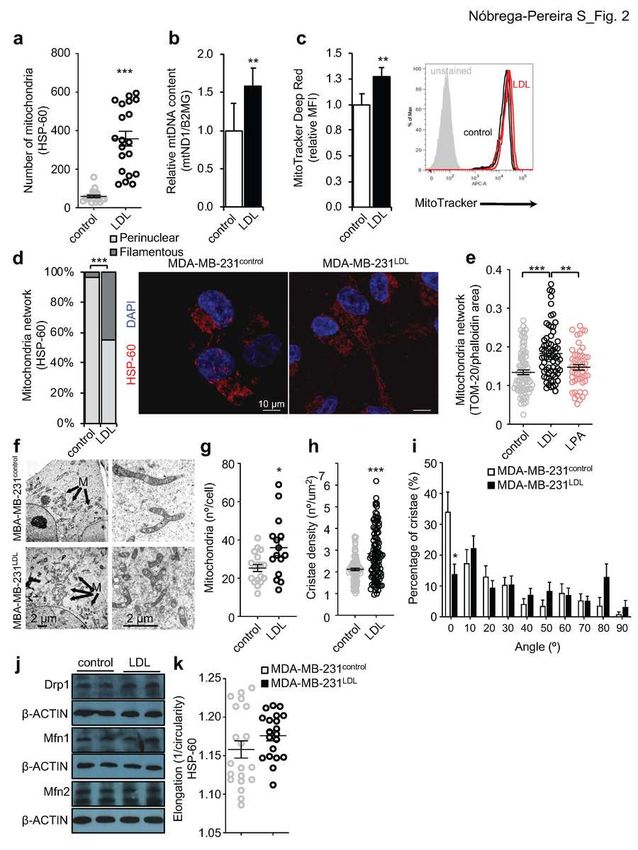
301 fatty acids and FAO-dependent mitochondrial metabolism.
302 In order to determine the contribution of fatty acids and FAO in the LDL-induced
303 aggressive properties of TNBC cells , we exposed cells to palmitic acid (PA), a
Nóbrega-Pereira et al., manuscript in preparation
13304 common saturated fatty acid implicated in the metastatic initiating potential of
305 CD36-positive cells29. Similarly to LDL, exposure to PA produced an increase in
306 the migratory phenotype (Fig. 4a) and mitochondrial mass of MDA-MB-231 cells,
307 as measured by mtDNA content (Fig. 4b) and MitoTracker Deep Red flow
308 cytometry staining (Extended Data Fig. 4a), suggesting that, at least part of the,
309 LDL impact in TNBC cells migration is due to the fatty acids content. To address
310 the requirement of FAO oxidation in the LDL and PA-induced migration of MDA-
311 MB-231 cells, we selectively inhibited the carnitine palmitoyltransferase system
312 (CPT1) that catalyzes the first reaction to shuttle long-chain fatty acids into the
313 mitochondria for FAO. Inhibition of the outer membrane isoform CPT1a with
314 etomoxir abrogated both LDL and PA increased migratory capabilities (Fig. 4a),
315 the augmented mtDNA content (Fig. 4b) and MitoTracker staining (Extended
316 Data Fig. 4a) in migrating MDA-MB-231 cells. Etomoxir treatment produced no
317 major changes in the LDL or PA-induced lipid droplet content and proliferative
318 potential (Extended data Fig. 4b,c).
319 Inhibition of CPT1a interrupts fatty acids transportation into the mitochondria and
320 thereby, blocks the whole process of long-chain fatty acid metabolism.
321 Quantification of the number of TOM-20 labelled mitochondria in immunostained
322 fixed cells revealed that etomoxir alone produced a dramatic decrease in the
323 number of mitochondria in migrating MDA-MB-231 cells (Fig. 4c) and LDL was
324 still able to increase the number of mitochondrial particles even in the presence
325 of etomoxir (Fig. 4c). Moreover, etomoxir treated cells present increased
326 mitochondria average area and LDL treatment was able to restore it in migrating
Nóbrega-Pereira et al., manuscript in preparation
14327 MDA-MB-231 cells (Extended Data Fig. 4d). Regarding mitochondrial network, 328 CPT1a blockade produced an increase in the proportion of migrating cells with 329 perinuclear network distribution (Fig. 4d: eto, perinuclear 82.5% and filamentous 330 17.5%) and LDL co-treatment was still able to increase the proportion of MDA- 331 MB-231 cells displaying filamentous network distribution (Fig. 4d; eto vs. eto+LDL 332 p
350   a dynamic remodeling between mitochondria energetic processes and actin

351   cytoskeleton as mitochondria deliver localized ATP for Arp2/3-F-actin network

352   growth during cell invasion30. Indeed, co-treatment with the Arp2/3 Inhibitor

353   CK66631 abolished the LDL-induced migratory effect (Extended data Fig. 4i), and

354   the LDL-induced increase in mitochondrial mass and network distribution in

355   migrating MDA-MB-231 cells (Fig. 4i,j), suggesting that LDL-induced migration is

356   accompanied by actin cytoskeleton-mitochondria network remodeling.

357   Overall, these results suggest that both mitochondrial bioenergetic metabolism

358   (glucose and fatty acid-dependent) and co-ordination with actin cytoskeleton is

359   required for the LDL-induced mitochondrial network adaptations and migratory

360   advantage in TNBC cells.

361

362   Increased       lipid    exposure       induces     metabolic    and   bioenergetic

363   dependencies in TNBC cells.

364   When fatty acids are the most abundant energy substrate, mitochondrial

365   bioenergetics and oxidative phosphorylation (OXPHOS) can be tuned by

366   transcriptional regulation of metabolic enzymes and electron transport chain

367   (ETC) complexes32. In order to assess if LDL exposure impacts the bioenergetic

368   program adopted by TNBC cells, we used gene expression microarray data from

369   control and 48h LDL-exposed MDA-MB-231 cells11. Gene set enrichment

370   analysis revealed several genes significantly reduced upon LDL exposure,

371   including endoplasmic reticulum-related and several metabolic pathways (Fig.

372   5a), with a significant decrease in the biosynthesis of lipids (steroid, isoprenoid,

373   cholesterol)    and     membrane       structures   (nuclear   envelope-ER   network,

      Nóbrega-Pereira et al., manuscript in preparation
                                                                                         16
374 endomembrane system, organelle membrane) (Fig. 5a). In addition, there was a
375 non-significant increase in fatty acid beta-oxidation (FAO) and carbohydrate
376 catabolism (Extended Data Fig. 5a), suggesting that LDL exposure induces
377 remodeling of anabolic and bioenergetic pathways in TNBC cells. These findings
378 were further validated by qPCR analysis which confirmed increased expression
379 of FAO enzymes (CPT1A, ACADVL), decreased expression of lipid biosynthetic
380 enzymes, including the rate-limiting FASN and HMGCR, and an overall increase
381 expression of bioenergetic enzymes, both OXPHOS (COX5b, ATP5g1, NDUFB5)
382 and glycolytic (PKM2, PFKFB3, LDHA), in LDL-exposed MDA-MB-231 cells (Fig.
383 5b).
384 To understand the impact of LDL exposure in the bioenergetics of TNBC cells,
385 we performed a series of functional mitochondrial stress tests using the Seahorse
386 extracellular flux analysis on cultured MDA-MB-231 cells untreated or LDL-
387 exposed in the presence or absence of the CD36 pharmacological inhibitor SSO.
388 No significant differences were observed in the oxygen consumption rate (OCR)
389 between control and LDL-treated MDA-MB-231 cells, including basal and
390 maximal mitochondrial respiration and ATP production (Fig. 5c and Extended
391 Data Fig. 5b). However, comparing to untreated cells, LDL-exposed cells present
392 a trend for increased proton leak and a significant decrease in spare capacity
393 (Fig. 5c; p=0.0036), which is obtained by the differential between the basal and
394 maximal respiration and lower spare capacity has been associated with increase
395 susceptibility to oxidative stress33. In addition, LDL treatment did not significantly
396 impact the extracellular acidification rate (ECAR) of MDA-MB-231 cells, with only
397 a (non-significant) decrease in the glycolytic reserve observed (Fig. 5d and
398 Extended data Fig. 5c). Blockade of CD36 by SSO treatment alone or combined
Nóbrega-Pereira et al., manuscript in preparation
17399 with LDL promoted several OCR bioenergetic adaptations, including increased
400 non-mitochondrial respiration, basal respiration, proton-leak (Fig. 5c and
401 Extended Data Fig. 5b) and glycolytic reserve (Fig. 5d and Extended data Fig.
402 5c) suggesting that decreased cellular lipid uptake upon CD36 blockade
403 potentiates bioenergetics either by recruitment of endogenous lipid storage (see
404 Fig. 3e) or usage of alternative fuels (glucose or glutamine). Next, we decided to
405 investigate if LDL exposure impacts the main energetic fuel preferentially used
406 by TNBC cells. For that, we performed substrate dependency assays (Seahorse
407 Mito Fuel Flex Test) based on OCRs response to glutamine-, glucose-, and FA-
408 oxidation inhibitors (BPTES, UK5099, and etomoxir, respectively) in cultured
409 MDA-MB-231 cells untreated or LDL-exposed cells in the presence or absence
410 of the CD36 inhibitor SSO. We observed that LDL-exposed MDA-MB-231 cells
411 present increase FAO dependency and decreased flexibility for mitochondrial
412 respiration (Fig. 5e) and CD36 blockade did not significantly alter this effect (Fig.
413 5e). On the contrary, LDL exposure led to a decrease glucose oxidation capacity
414 and flexibility in MDA-MB-231 cells and CD36 blockade was able to revert this
415 effect (Fig. 5f). Overall these results suggest that LDL exposure does not impact
416 the main bioenergetic pathway adopted by MDA-MB-231 cells but promotes a
417 dependency on fatty acids usage for mitochondrial respiration, decreasing the
418 capacity of TNBC cells to adapt to other fuels, such as glucose.
419
420 LDL-induced migratory behavior and mitochondrial adaptations rely in
421 reactive oxygen species signaling.
Nóbrega-Pereira et al., manuscript in preparation
18422 In macrophages, CD36-dependent oxidized LDL import leads to mitochondrial
423 fatty acid accumulation which shifts the mitochondrial function from electron
424 transport chain to reactive oxygen species (ROS) production34. Indeed, ROS are
425 important secondary messengers that regulate ECM, cytoskeleton remodeling
426 and cell motility also in cancer35,36. LDL-exposed MDA-MB-231 cells present
427 several pathways related to ROS production and metabolism deregulated, as
428 repression of Oxidoreductase and Oxidation reduction (Fig. 5a) and induction of
429 disulfide bond and metabolism of xenobiotics by cytochrome P450 (Extended
430 Data Fig. 5a), and a lower respiratory spare capacity (Fig. 5c), raising the
431 possibility that the mitochondria of LDL-treated MDA-MB-231 cells are producing
432 excessive oxidative stress. Using the cellular ROS indicator Cell ROX, we
433 observed that LDL stimulated cellular ROS production in migrating MDA-MB-231
434 cells (Fig. 6a, vehicle and Extended Data Fig. 6a) in a CD36-dependent manner
435 as SSO treatment (Extended Data Fig. 6b) or CD36 knock-down (Extended Data
436 Fig. 6c) blocked the LDL-induced increase in cellular ROS. Moreover, no
437 differences in ROS production were observed upon LPA treatment (Extended
438 Data Fig. 6a). Consistent with previous studies by others34, ROS production
439 induced by LDL was unlikely due to down-regulation of antioxidant enzymes
440 (Extended Data Fig. 6d) and LDL-exposed cells present even higher levels of
441 catalase, a peroxisome enzyme that converts hydrogen peroxide to water,
442 probably as an attempt to counterbalance the oxidative stress. LDL-induced
443 increase in cellular ROS was abolished using the cellular antioxidant N-
444 acetylcysteine (NAC, Fig. 6a) and the mitochondria targeted antioxidant
Nóbrega-Pereira et al., manuscript in preparation
19445 MitoTEMPO (MitoT, Fig. 6b) suggesting that mitochondria contribute, at least in
446 part, for the increased ROS levels in LDL-exposed MDA-MB-231 cells.
447 Importantly, both cellular and mitochondria-specific antioxidants were able to
448 block LDL-induced migration (Fig. 6c,d) and no effect in cell migration was
449 observed for the cellular antioxidant NAC in CD36-depleted MDA-MB-231 cells
450 (Extended Data Fig. 6e). Antioxidant supplementation also impacted the
451 mitochondrial network of MDA-MB-231 migrating cells, with NAC abolishing the
452 increase in TOM-20-labeled mitochondria (Fig. 6e) and MitoTEMPO blocking the
453 remodeling of mitochondrial network and acquisition of a filamentous distribution
454 (Fig. 6f-h) in LDL-exposed cells. Supplementation with NAC or MitoTEMPO did
455 not alter the mitochondria average area of LDL-treated cells (Extended Data Fig.
456 6f). This data is consistent with LDL promoting fatty acids trafficking and
457 accumulation into the mitochondria, leading to local ROS production and
458 induction of cell motility35,37. Indeed, LDL-exposed MDA-MB-231 cells treated
459 simultaneously with the CPT1a inhibitor etomoxir, which blocks mitochondrial
460 import of LCFA38, present a significant reduction in the production of cellular ROS
461 (Fig. 6h; LDL vs. etomoxir+LDL p=0.007). Moreover, we use the fluorescent
462 analog of palmitic acid (BODIPY FLC16) to visualize exogenous FA uptake
463 together with mitochondria labeling using MitoTracker Deep Red (Extended Data
464 Fig. 6i). Confocal microscopy analysis revealed that in the presence of LDL,
465 shSCR MDA-MB-231 exhibited enhanced uptake of the FA analog relative to the
466 CD36-depleted cells, being FA staining more prominent in the perinuclear region
467 with more intense MitoTracker Deep Red staining.
Nóbrega-Pereira et al., manuscript in preparation
20468 Etomoxir co-treatment decreased the co-localization of FA in the perinuclear
469 MitoTracker Deep Red-stained region, being virtually absent for the shCD36
470 MDA-MB-231 cells (Extended Data Fig. 6g).
471
472
473
474
475
Nóbrega-Pereira et al., manuscript in preparation
21476 Discussion
477 The role of hypercholesterolemia in cancer has been under scrutiny by our lab
7–12
478 and others . In detail, we have shown that high LDL cholesterol in particular
479 promotes breast cancer progression (by acting directly on cancer cells inducing
10,11
480 proliferation and migration and by suppressing immune responses, namely
12
481 the action of gamma delta T cells .
482 Given the role of lipids in several metabolic processes, most notably in
483 mitochondria (where lipid oxidation mainly occurs), here, we exploited the
484 hypothesis that LDL cholesterol induces breast cancer cells migration by
485 modulating mitochondrial metabolism. In particular, CD36 mediated metabolic
486 adaptations have recently been implicated in lipid-dependent breast cancer
487 aggressive phenotypes, including metastasis, resistance to HER2-targeted
488 therapy and modulation of the tumor microenvironment by T cells dysfunction
29,39–41
489 . In macrophages, CD36-dependent import of lipids induces mitochondrial
490 reprogramming, with increase accumulation of fatty acids leading to ROS
491 production and activation of inflammatory patterns 34.
492 Our data shows in vivo and in vitro that LDL exposure induces cell migration and
493 invasion and that this is accompanied by altered (spread) network distribution
494 throughout the migrating cells, classified here as filamentous. The resulting
495 alterations in cellular metabolism indicate that breast cancer cells exposed to high
496 lipid levels depend on lipid oxidation (OXPHOS) as their main energy source and
497 that this results in increased oxidative stress (similar to what is, systemically, seen
498 in hyperlipidemia patients 42. Accordingly, ROS levels (cellular and mitochondrial
Nóbrega-Pereira et al., manuscript in preparation
22499 ROS) are significantly elevated in LDL exposed breast cancer cells. Our studies
500 further show that blocking LDL uptake and the resulting lipid entry into
501 mitochondria via CD36 and CPT1a blockade, respectively, or dumping ROS
502 levels by antioxidants completely abrogate cell migration and mitochondria
503 metabolism reprogramming.
504 Taken together, we reveal novel and detailed mechanistic cellular and metabolic
505 changes underlying the migratory behavior of breast cancer cells exposed to
506 systemic lipids, and propose that CD36 and/or ROS signaling may provide a
507 novel therapeutic strategy for subsets of invasive breast cancer.
508
509
510
511
Nóbrega-Pereira et al., manuscript in preparation
23512
513
514 Fig.1 - LDL-exposed TNBC cells show different invasion potential,
515 metastatic tropism and mitochondrial network distribution in
516 xenotransplanted zebrafish larvae at 4dpi (6dpf). a, Top, Schematic
517 representation of MDA-MB-231 cell invasion potential throughout the zebrafish
518 body in xenotransplanted larvae at 2dpf and analyzed at 4dpi (6dpf) with DiI-
519 labelled MDA-MB-231 control (red) and Cy5-labelled LDL-exposed (grey) cells
520 detected in the indicated organs (grey and red depicts organs with increase
521 tropism for LDL-exposed and control cells, respectively, and each dot represents
522 one xenograft). Bottom, Quantification of the invasive potential depicted as the
523 number of zebrafish larvae xenografts (n=11 from 1 independent experiment)
524 with DiI-labelled MDA-MB-231 control (red) and Cy5-labelled LDL-exposed (grey)
525 cells in the indicated organs. b, Top, Schematic representation of the total
526 distribution of labelled MDA-MB-231 control (red, n=1567) and Cy5-labelled LDL-
527 exposed (grey, n=931) cells throughout the zebrafish larvae (n=11), each circle
528 represents the proportion of cells of each condition in that organ (grey and red
529 depicts organs with statistical significance for LDL-exposed and control cells,
530 respectively). Bottom, Quantification of cells distribution depicted as the
531 percentage of DiI-labelled MDA-MB-231 control (red) and Cy5-labelled LDL-
532 exposed (grey) cells present in the indicated organs over total. c, d, e, Total Mito-
533 YFP number (c), average area (d) and mitochondria network (e) determined as
534 the Mito-YFP area by cell tracer DiI or Cy5 area (for control and LDL cells
535 respectively) in control (n=33/35) and LDL-exposed (n=46/55) MDA-MB-231 cells
536 throughout the body of immunolabelled xenotransplanted zebrafish larvae
Nóbrega-Pereira et al., manuscript in preparation
24537 (n=11). Each circle represents individual cell measurement, lines represent the 538 mean ± sem for each condition. f, Chart representing Mito-YFP-labelled 539 mitochondrial network distribution of control (n=39) and LDL-exposed (n=64) 540 MDA-MB-231 cells in the xenotransplated zebrafish larvae. g, Representative 541 images of maximum intensity projection of DiI-labelled MDA-MB-231 control (red) 542 and a Cy5-labelled MDA-MB-231LDL (grey) cells expressing Mito-YFP (green) 543 and displaying a perinuclear (control) and filamentous (LDL) mitochondrial 544 network distribution acquired from the PVS (control) and eye (LDL) of 545 xenotransplanted zebrafish larvae at 4dpi. Nuclei are labelled with DAPI (blue). 546 Scale bar, 10 μm. 547 Legend: A. (anal), CHT (caudal hematopoietic tissue), D. (dorsal), H. kidney 548 (head kidney), Intestinal t. (intestinal tract), Optic v. (optic vesicle), PVS 549 (perivitelline space), S. Bladder (swim bladder), T. (tail), V. (ventral). Statistical 550 analysis was performed by applying the Fisher’s exact test (a, b, f) and two-tailed 551 Student’s t-test (c-e). * p
562   MB-231 cells and histograms (right; n=5 each from a representative experiment).

563   d, HSP-60-labelled mitochondrial network distribution of control and LDL-

564   exposed migrating MDA-MB-231 cells (left; n=31 each) and representative

565   images of cells displaying perinuclear (control) and filamentous (LDL)

566   mitochondrial network distribution (right; 63x objective). Nuclei are labelled with

567   DAPI (blue). Scale bar, 10μm. e, Mitochondrial network determined as the TOM-

568   20 total area over the phalloidin area of immunolabelled control, LDL or LPA-

569   exposed MDA-MB-231 migrating cells (n=50/82 cells per condition). f,g,h,i.

570   Representative electron microscope images (TEM) images (left 1500x and right

571   3000x; scale bar equals 2 μm; M: mitochondria) (f) and quantitative plots of

572   mitochondria number per cell (n=15/18 cells) (g), cristae density as the number

573   of cristae per μm2 mitochondrial area (n=100 mitochondria) (h) and percentage

574   of cristae in the angles displayed (n=12/27 mitochondria) (i) in untreated (control)

575   or LDL-exposed MDA-MB-231 cells. j, Western blot for Drp1, Mfn1 and Mfn2

576   protein in untreated (control) or LDL-exposed MDA-MB-231 cells (representative

577   images, uncropped images of blots are shown in Extended Data Fig. 7). k, Mean

578   elongation of HSP-60-labelled mitochondria number in control and LDL-exposed

579   migrating MDA-MB-231 cells (n=20 each) in the wound-healing assay.

580   Data are presented as mean ± s.d. Each circle in the plot represents individual

581   cell measurement. Statistical analysis was performed by the Fisher’s exact test

582   (d), One-way ANOVA with multiple comparison correction (e,h) and two-tailed

583   Student’s t-test. * p
585   Fig.3 - LDL-induced migration of TNBC cells is mediated by the fatty acid

586   transporter CD36.

587   a, Flow cytometry quantification of BODIPY 493/503 (Bodipy) staining depicted

588   as relative median fluorescence intensity (MFI) (left) in untreated (control) or LDL-

589   exposed MDA-MB-231 cells (n=5 each) and representative histograms (right). b,

590   Representative live fluorescent microscopy images of control and LDL-treated

591   MDA-MB-231 cells stained with BODIPY 493/503 (Bodipy, 63x objective, scale

592   bar 20 μm) c, Flow cytometry quantification of CD36 cell surface expression

593   depicted as fold median fluorescence intensity (MFI) (left) in untreated (control)

594   or LDL-exposed MDA-MB-231 cells and histograms (right; n=4 each). d,

595   Migratory capacity represented as percentage of wound closure at 24h of control

596   or LDL-exposed MDA-MB-231 cells in the absence (vehicle) or presence of

597   sulfosuccinimidyl oleate (SSO, 50 uM) (n=4 each) and representative images of

598   wound closure at 0h and 20h by optical microscopy (4x objective). e, Flow

599   cytometry quantification of BODIPY 493/503 (Bodipy) staining of control or LDL-

600   exposed MDA-MB-231 cells in the absence (vehicle) or presence of SSO (n=4

601   each). f, Wound closure at 18h of shSCR or shCD36 MDA-MB-231 cells in the

602   absence (control) or presence of LDL (n=5/7 each). g, Relative mitochondrial

603   DNA (mtDNA) content from control or LDL-exposed MDA-MB-231 cells in the

604   absence (control) or presence of SSO (n=6/8 each). h, Number of TOM-20

605   labelled mitochondria in control or LDL-exposed migrating MDA-MB-231 cells in

606   the absence (vehicle) or presence of SSO (n=44/78 cells per condition). i,

607   Representative images of control, LDL and LDL+SSO treated MDA-MB-231

608   migrating cells immunolabelled for HSP-60 (red) and lipid droplets (Bodipy,

609   green). Nuclei are labelled with DAPI (blue). 63x objective, scale bar 20 μm. j,

      Nóbrega-Pereira et al., manuscript in preparation
                                                                                        27
610 Chart representing TOM-20-labelled mitochondrial network distribution of control 611 or LDL-exposed MDA-MB-231 migrating cells in the absence or presence of SSO 612 (n=44/87 cells per condition). k, Mitochondrial network determined as the TOM- 613 20 total area over the phalloidin area of immunolabelled control or LDL-exposed 614 MDA-MB-231 migrating cells in the absence or presence of SSO (n=44/82 cells 615 per condition). Data are presented as mean ± s.d. Each circle in the plot 616 represents individual cell measurement. Statistical analysis was performed by 617 One-way ANOVA with multiple comparison correction (h,k), Fisher’s exact test 618 (j), and two-tailed Student’s t-test. * p
634   exposed MDA-MB-231 migrating cells in the absence or presence of etomoxir

635   (n=63/82 cells per condition). f, Representative images of control, LDL and

636   LDL+eto treated MDA-MB-231 migrating cells immunolabelled for TOM20

637   (green) and phalloidin (red). Nuclei are labelled with DAPI (blue). 63x objective,

638   scale bar 20 μm. g,h, Migratory capacity represented as percentage of wound

639   closure at 18h of control or LDL-exposed MDA-MB-231 cells in the absence

640   (vehicle) or presence of 2-DG (2 mM, n=4 each) (g) and oligomycin (2 µM, n=4

641   each) (h). i,j Number of TOM-20 labelled mitochondria (i) and mitochondrial

642   network determined as the TOM-20 total area over the phalloidin area (j) of

643   immunolabelled control or LDL-exposed MDA-MB-231 migrating cells in the

644   absence or presence of CK666 (n=10/15 cells per condition).

645   Data are presented as mean ± s.d. Each circle in the plot represents individual

646   cell measurement. Statistical analysis was performed by One-way ANOVA with

647   multiple comparison correction (c,e,i,j), Fisher’s exact test (d), and two-tailed

648   Student’s t-test. * p
658   in the absence (vehicle) or presence of SSO for 48h (n=14/15 each from 3

659   independent experiments). d, Extracellular acidification rate (ECAR) of control or

660   LDL-exposed MDA-MB-231 cells cultured in the absence (vehicle) or presence

661   of SSO for 48h (n=12/15 each from 3 independent experiments). e,f, Fuel

662   dependency depicting oxygen consumption rate for fatty acid oxidation (e) and

663   glucose oxidation (f) of control or LDL-exposed MDA-MB-231 cells cultured in the

664   absence (vehicle) or presence of SSO (n=3 each).

665   Data are presented as mean ± s.d. Statistical analysis was performed by the two-

666   tailed Student’s t-test (b) and One-way ANOVA with multiple comparison. For (a),

667   statistic cut-off [-log10 (0.05)] was applied for Benjamini false discovery rate

668   (FDR) correction. * p
682   condition) (f) and TOM-20-labelled mitochondrial network distribution (n=36/87

683   cells per condition) (g) in control or LDL-exposed migrating MDA-MB-231 cells in

684   the absence or presence of N-acetylcysteine (NAC, 5 mM) or MitoTEMPO (MitoT,

685   100 µM). h, Representative images of control, LDL and LDL+eto treated MDA-

686   MB-231 migrating cells immunolabelled for TOM20 (green) and phalloidin (red).

687   Nuclei are labelled with DAPI (blue). 63x objective, scale bar 20 μm. i, Flow

688   cytometry quantification of Cell ROX Deep Red staining depicted as relative

689   median fluorescence intensity (MFI) (left) in control or LDL-exposed MDA-MB-

690   231 cells in the absence (vehicle) or presence of etomoxir (200 µM, n=3/6 each).

691   Data are presented as mean ± s.d. Each circle in the plot represents individual

692   cell measurement. Statistical analysis was performed by One-way ANOVA with

693   multiple comparison correction (e,f), Fisher’s exact test (g), and two-tailed

694   Student’s t-test. * p
705   Methods

706   Zebrafish welfare and handling. Zebrafish (Danio rerio) casper, nacre, and Tg

707   (fli1:eGFP) fish were handled and maintained according to the standard protocols

708   of the European Animal Welfare Legislation, Directive 2010/63/EU (European

709   Commission, 2016) and Champalimaud Fish Platform. All protocols were

710   approved by the Champalimaud Animal Ethical Committee and Portuguese

711   institutional organizations—ORBEA (Orgão de Bem-Estar e Ética Animal/ Animal

712   Welfare and Ethics Body) and DGAV (Direção Geral de Alimentação e

713   Veterinária/Directorate General for Food and Veterinary).

714   Cell culture. Human triple negative breast cancer cells lines (MDA-MB-231,

715   MDA-MB-436) were purchased from ATCC between 2012 and 2016, tested as

716   being mycoplasma free and authenticated by examination of morphology and

717   consistent in vitro performance. Cells were cultured in DMEM (ThermoFisher)

718   supplemented with 10% (v/v) heat-inactivated FBS (Gibco) and 1% Antibiotic-

719   Antimycotic (Gibco) at 37ºC and 5% CO2 atmosphere. For cell proliferation and

720   wound healing assays, cells were seeded in round bottom 24-well plates, after

721   24h the medium was replaced by DMEM 1% FBS-LPF (fetal bovine serum-

722   lipoprotein free) (Bio West) for 12h, after which fresh DMEM 1% FBS-LPF growth

723   medium only (control) or supplemented with LDL (Merck Milipore, 100 ug/mL) or

724   palmitic acid (PA):BSA (Sigma, 0,4mM) was added alone or with the following

725   compounds pre-incubated 1 h before: 2-DG (Calbiochem, 2mM), Oligomycin

726   (Sigma, 2μM), Etomoxir (Sigma, 150-200μM), SSO (Sigma, 50μM), LPA (Sigma,

727   10μM), NAC (Sigma, 5mM), MitoTempo (Sigma, 100μM), CK666 (Sigma, 50-

      Nóbrega-Pereira et al., manuscript in preparation
                                                                                   32
728 75μM), anti-human LDL receptor blocking antibody (AF2148, R&D Systems,
729 5μg/ml). Palmitic acid:BSA solution was prepared according to18. Briefly, sodium
730 palmitate (Sigma) was dissolved in 0.1M NaOH and warmed at 80 °C until clear.
731 The solution was complexed with fatty acid-free BSA (Sigma) in a molar ratio fatty
732 acid:BSA of 5:1, where BSA was dissolved in 0.9% NaCl, and the mixture was
733 warmed to 45 °C. The clear solution of palmitate was added drop-by-drop by
734 pipette with agitation and the final solution was filtered at 0.45 μm. Cell count ratio
735 was determined by Trypan Blue (0.4% solution, Amresco) exclusion and cell
736 counts (with the aid of a hemocytometer) in a Burker chamber (Blau Brand) after
737 48h. For the wound-healing assay, two hundred microliters tips were used to
738 make a scratch (“wound”) in the center of the well, followed by washing with PBS,
739 and replacement with DMEM 1% FBS-LPF with Mitomycin C (Merck Milipore,
740 0,5μM) and the appropriate experimental conditions and images were acquired
741 with 4x objective on a Zeiss Primovert microscope coupled with a Zeiss AxioCam
742 ERc or a EVOS M500 microscope at time 0h and after 18/24h. The migrated
743 distance was by subtracting the wound length at 18/24h from 0h and expressed
744 as percentage of wound closure. Lentiviral shRNA construct targeting CD36 and
745 a non-targeting scramble shRNA sequence (TRCN0000056999 Sigma; kindly
29
746 provided by Dr. Salvador Aznar Benitah) were used as before . For shRNA
747 transduction, lentiviruses were produced in HEK293T cells with co-vectors
748 (pCMV delta R8.2, pMD2.G) using X-tremeGENE DNA Transfection Reagent
749 (Roche). Lentivirus particles were collected 48h post-transfection and used to
750 transduce MDA-MB-231 cells in the presence of 8μg/ml polybrene. Transduced
Nóbrega-Pereira et al., manuscript in preparation
33751 cells were selected for during 3 days before experiments through addition of
752 1μg/ml of puromycin (In vivoGen) in the culture media. Cells were transfected
753 with 2-6μg Mito-YFP using FuGENE (ThermoFisher) and according to the
754 manufacturer instructions.
755 Zebrafish xenografts. For cell preparation, MDA-MB-231 cells were seeded at
756 day 1 at a density of 6x10⁶ (control) or 4,5x10⁶ (LDL) cells in a T-175 flask with
757 complete DMEM and 6h later, growth medium was replaced by DMEM
758 supplemented with 1% FBS-LPF. At day 2, growth medium was replaced by
759 DMEM with 1% FBS-LPF alone or supplemented with LDL for a total of 48h. At
760 day 3, cells were transfected with Mito-YFP and in the next day, cells were
761 detached with non-enzymatic methods (Cell Dissociation Buffer, enzyme-free,
762 PBS; ThermoFisher), washed with Dulbecco’s phosphate-buffered saline (DPBS)
763 1X (Bio West) and stained separately with the lipophilic dyes Vybrant CM-DiI (4
764 μl/ml in DPBS 1X) or Deep Red Cell Tracker (1 μl/ml in DPBS 1X, 10mM stock)
765 (ThermoFisher), for 10 min at 37ºC, in the dark. Fluorescently labeled control and
766 LDL-treated cells were mixed (1:1 proportion at 0.5x10⁶ cells/μl) and injected
767 using borosilicate glass microcapillaries under a fluorescence scope (Zeiss Axio
768 Zoom V16) with a mechanical micropipetor attached (World Precision
769 Instruments, Pneumatic Pico pump PV820). Approximately 500–1000 cells were
770 injected into the periviteline space (PVS) of 2 dpf zebrafish embryo, previously
771 anesthetized withTricaine 1X (Sigma). After injection, zebrafish xenografts
772 remained for ~10 min in Tricaine 1X and then transferred to E3 medium and kept
773 at 34 ºC. Every day xenografts were checked—dead ones removed and E3
Nóbrega-Pereira et al., manuscript in preparation
34774 medium refreshed. Four days after injection zebrafish xenografts were sacrificed,
775 fixed with 4% (v/v) Formaldehyde (FA) (Thermo Fisher) at 4ºC overnight and
776 preserved at -20º C in 100% (v/v) methanol (MetOH).
777 Immuno and cell staining. Zebrafish larvae whole-mount immunofluorescence
778 was performed starting hydration through methanol series (75% > 50% > 25%).
779 Next, xenografts were permeabilized with 0.1% (w/v) Triton X-100 (Sigma) in
780 PBS 1x and blocked with a mixture of PBS 1X, 1% BSA , 1% DMSO (Sigma),
781 0.05% Triton X-100, 1.5% goat serum (DAKO) for 1 h at room temperature (RT).
782 The xenografts were then incubated with primary anti-GFP rabbit polyclonal
783 antibody Alexa 488 conjugate (Invitrogen, 1:100) and DAPI (50 μg/ml; Merck
784 Millipore) by overnight at 4ºC. Wash and fixation steps were performed, and
785 xenografts mounted between two coverslips, allowing double side acquisition
786 using Mowiol mounting media (Sigma). For immunofluorescence in cultured cells,
787 cells were seeded in glass coverslips fixed with 4% Paraformaldehyde (PFA)
788 (ThermoFisher) following by permeabilization with 0,5% Triton X-100 and
789 blocking with 0.5% BSA-PBS1x. For BODIPY 493/503 co-staining, cells were
790 permeabilized with 0.2M glycine (Sigma), 0.1mg/ml saponin (Sigma) and 3%
791 BSA. Cells were then incubated with primary antibody anti-human mouse HSP60
792 antibody (BD Biosciences,1:250) or mouse TOM20 (F10, Santa Cruz, 1:200)
793 over-night at 4ºC and followed by incubation of the secondary antibody donkey
794 anti-mouse Alexa 488 (Invitrogen, 1:400), donkey anti-mouse Alexa 594,
795 (Invitrogen; at 1:500), Alexa Fluor 594 Phalloidin (ThermoFisher, 1:200) or
796 BODIPY 493/503 (ThermoFisher; 0,2μg/mL) for 1h at RT. For BODIPY FLC16
Nóbrega-Pereira et al., manuscript in preparation
35797 and MitoTracker co-staining, seeded cells were washed with 0.1% free fatty acid-
798 BSA (Sigma) in pre-warmed Hank’s Balanced Salt Solution (HBSS 1x,
799 ThermoFisher), followed by incubation with BODIPY FLC16 (2μM) and
800 Mitotracker Deep Red (25nM) (ThermoFisher) at 37ºC for 20 minutes and fixation
801 with 4% PFA. Mounting was performed using Vectashield with DAPI mounting
802 medium (vectorlabs).
803 Microscopy acquisition and analysis. For zebrafish xenografts imaging and
804 analysis, initial screening was performed using an inverted fluorescence widefield
805 microscope Zeiss Axiovert 200M, with 10x amplification. For the tropism
806 evaluation, tiles of zebrafish larvae were acquired using the spinning disk
807 confocal microscope Zeiss Cell Observer SD, with 10x magnification. Generated
808 images were processed using the Fiji software. Acquired z-stacks were projected
809 using maximum intensity projection. Number of cells was quantified with ImageJ
810 software Cell counter plugin. For the quantification of cells per organ, Imaris 9.0.1
811 was used. Tiles were converted into three-dimensional reconstructions, and
812 cancer cells in each organ were quantified. For mitochondrial network
813 quantification, confocal microscopy was performed in a Zeiss LSM 880
814 microscope and the images were acquired with a 63x oil objective (with 1.2-1.6x
815 zoom). For live cell imaging, MitoTracker Deep Red (50 nM) and BODIPY
816 493/503 (0,2μg/mL) (ThermoFisher) were added in complete DMEM for 30
817 minutes and imaging was performed in a Zeiss Cell Observer Microscope with
818 63x oil objective. Mitochondrial morphological parameters, as number of
819 mitochondria, mitochondria average area, mitochondria network (the area
Nóbrega-Pereira et al., manuscript in preparation
36You can also read