Mississippi River - St. Cloud - Upper Mississippi River Basin - St. Cloud Watershed assessment and ...
←
→
Page content transcription
If your browser does not render page correctly, please read the page content below
Watershed assessment and trends update

Mississippi River- St. Cloud
Upper Mississippi River Basin

Why is it important?
Water quality monitoring is essential in determining whether lakes and streams meet water quality
standards designed for protecting beneficial uses like fishing and swimming. Regional and local
water-stewardship groups, along with some state and federal agencies, continually monitor their
respective watersheds on an ongoing basis. Once every 10 years, the Minnesota Pollution Control
Agency (MPCA) joins local partners and the Minnesota Department of Natural Resources (MNDNR)
in conducting intensive monitoring of the lakes and streams in each of the state’s 80 major
watersheds. For the Mississippi River-St. Cloud Watershed (MRSCW), this update summarizes the
second round of intensive monitoring. The monitoring effort looks at fish and macroinvertebrate
(aquatic insect) communities as a measure of aquatic life health, in addition to water chemistry, to
evaluate water quality. Agency staff and local stakeholder partners collaborate to review and
assess the monitoring data to identify healthy (or stressed) waters in need of protection, and
impaired waters in need of restoration. Furthermore, there is an evaluation of how conditions
have changed over the 10-year period. This continually increasing understanding of the watershed
leads to refined restoration and protection strategies and better focus of resources toward
beneficial on-the-ground efforts to improve water quality.

Is the water quality improving?
Over the past decade, scientists observed many positive
improvements in water quality within the MRSCW. Between 2009 and
2019, the overall health of fish and macroinvertebrate communities
in the watershed improved. Lake conditions told a similar story of
improving quality with a number of restored waters earning approval
to remove some nutrient impairments from the impaired waters list.
These improvements are a testament to the efforts of local
watershed managers and the partnerships they build. However,
continued problems include loss of shoreline buffers and habitat due
to development, excess nutrients, elevated levels of bacteria, and low
dissolved oxygen levels.
•   Across the watershed, there has been a statistically significant
    improvement in both fish and macroinvertebrate community
    condition over the last 10 years.
•   Water clarity trends were improving on 17 different lakes and
    only slightly declining on three (Albion, Fish, and Crooked).
    Thirteen lakes showed no change.

                                                     2                           August 2022 | wq-ws3-07010203d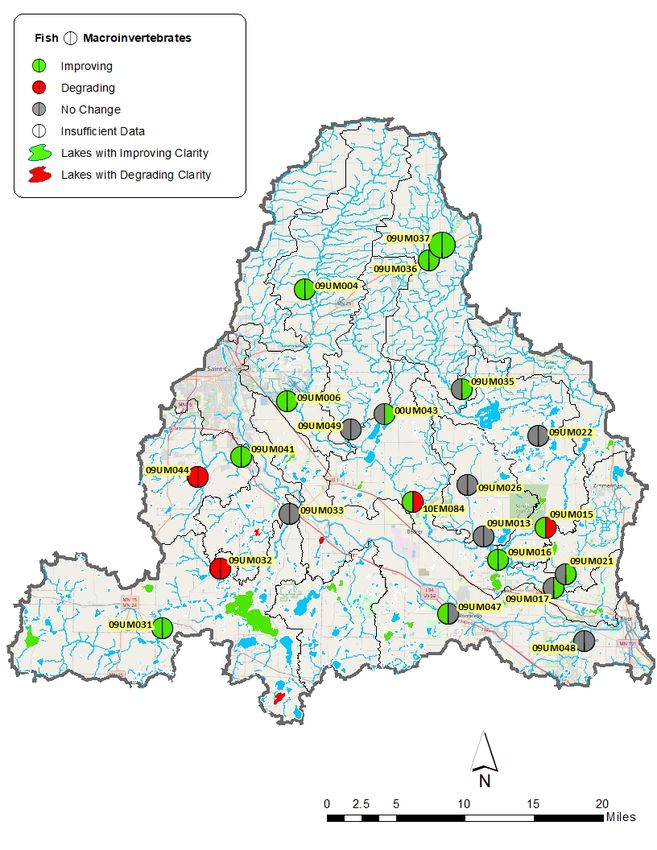
•   Average fish and macroinvertebrate community IBI scores in the watershed were statistically
    higher between 2009 and 2019. This watershed demonstrates some of the most dramatic
    positive changes over the 10-year time period compared to other Minnesota watersheds for
    which this analysis has been done.
•   Since 2009, landowners have implemented hundreds of best management practices (BMPs) to
    improve water quality throughout the watershed. The headwaters of the Elk River, upper
    portion of the Clearwater River, and Mayhew Creek are a few areas where BMP
    implementation has flourished. In many areas, it takes time for these practices to show lasting
    results.
•   Four streams and four lakes were removed from the impaired waters list (delisting). These
    delistings highlight the collaborative efforts by landowners and local partners to improve
    water quality through on-the-ground practices and outreach. Plum Creek highlights this effort
    with local partners leading the charge to identify and address the water quality issues and
    collect the data necessary to identify change.
•   Clearwater River Watershed District (CRWD) demonstrated
    that the Kingston Wetland Restoration Project (WRP) and
    stream diversion efforts are creating positive results. The
    construction of channel meanders and a high-flow wetland
    diversion have already led to reduced sediment and total
    phosphorus loads that will benefit lakes downstream of the
    project. Within 10 miles, the river flows through a series of five
    nutrient impaired lakes, each of which comes close to, or are
    meeting Secchi transparency standards. Long-term nutrient
    reductions from the Kingston WRP will help move these lakes toward delistings.
•   Beginning in 2009, a partnership between the city and
    residents of St. Cloud, Benton County SWCD, Short
    Elliot Hendrickson Inc. (SEH), MPCA, and Board of Soil
    and Water Resources (BWSR) assessed concerns of
    untreated stormwater runoff draining directly into the
    Mississippi River from 367 acres of residential and
    industrial northeast St. Cloud. By creating and
    implementing the Northeast Water Quality
    Improvement Plan, local enforcement, enhancing
    education, and five stormwater improvement projects,
    the goal of reducing total suspended solids (TSS) and
    total phosphorus (TP) concentrations was initiated. The
    five projects included underground treatment systems,
    parking lot bioretention, green spaces, and sump catch basins. In total, these projects are
    significantly reducing TSS and TP entering the Mississippi River by roughly 16.9 tons TSS and
    48.6 pounds TP per year, respectively. For more information on this project, please see the NE
    St. Cloud Water Quality Improvements story board.

Highlights of monitoring
•   During fish sampling, a total of 46 species were captured in 31 lakes. Eleven of these species
    are considered to be intolerant to anthropogenic stressors, while five species are considered
    to be tolerant to shoreline and watershed stressors. A total of 87 fish species and 303
    macroinvertebrate taxa were captured in streams.

                                                    3                            August 2022 | wq-ws3-07010203d
•   Intense monitoring (2014-2019), state, local partners, and landowner partnerships, and
    strategic implementation of numerous best management practices have led to the removal of
    the bacteria impairment on Plum Creek.
•   For the first time, fish-based indices of biological integrity (IBIs) were used to assess aquatic
    life in lakes.
•   Several lakes in this watershed support fish Species of Greatest Conservation Need, including
    the least darter and pugnose shiner.
•   Sugar Lake was noted to have an exceptional fish community.
•   Augusta, Caroline, Clearwater, and Sugar Lake have cold water habitats and contain cisco
    (tullibee). This is noteworthy as this watershed is located along the southern range of this
    species.
•   Many of the largely popular recreational lakes had improving clarity trends (Clearwater,
    Orono, Big, Mitchell, etc.).

Success story
The watershed has seen several successfully restored streams and lakes. One common theme that
ties all these successes together is that through partnerships, planning and action, the state-
supported approach to restoring and protecting water quality is working. This assessment cycle
brought us three chemistry delistings with documented improvements in water quality.
The strategic benefits of promoting watershed engagement through partnerships between various
governmental agencies beyond the two-year intensive watershed monitoring (IWM) process
through watershed restoration and protection strategies (WRAPS) has led to successful civic
engagement. That, in turn, has resulted in the successful implementation of several restoration
projects. Some of the monitoring carried out in 2019-2020 was managed by the Sherburne County
Soil and Water Conservation District (SWCD) through a Surface Water Assessment Grant. They
worked with multiple local partners to carry out the intensive monitoring schedule. This data along
with other data that had been collected over the 10-year assessment window led to the following
success stories.
    •   Plum Creek below Warner Lake: This stretch of stream was originally listed for
        excessive bacteria in 2012. In the years that followed, a network of state/local
        partnerships including Stearns Soil and Water Conservation District (SWCD), private
        landowners, citizen volunteers, and the University of Minnesota (U of M) successfully
        completed a number of best management practices. Consequently, the average bacteria
        concentrations were low enough to delist bacteria in 2020. Efforts included a septic
        upgrade, culvert replacement/erosion control, buffer establishment, and a minor change
        to nearby agricultural practices. https://www.epa.gov/sites/default/files/2020-
        10/documents/mn_plum_creek_1923_508.pdf
    •   Lake George nutrient delisting (St. Cloud): The lake was listed for excessive nutrients in
        2012, and by 2017 there was an approved action plan in place. Starting in 2018, the City of
        St. Cloud completed in-lake alum treatments, and an underground stormwater treatment
        upgrade is nearly completed. These efforts and residential raingardens have helped lower
        the seasonal concentrations of nutrients in the lake to the point of earning a delisting.
        More information is available on the Lake George Water Quality Improvement Project
        story board.

                                                     4                            August 2022 | wq-ws3-07010203d
•   Union Lake and Lake Augusta nutrient delistings: Both lakes near South Haven, Minnesota,
        show that restoration efforts have been successful, and standards are now being met. The
        Tri-County Conservation Project spearheaded significant collaborative efforts between
        Meeker, Stearns, and in 2020, the Minnesota Department of Natural Resources removed
        an old dam on Drywood Creek, a tributary to the Pomme de Terrre River.
    •   Birch Lake nutrient delisting: Birch Lake in Sherburne
        County has been restored and is now meeting
        standards. Public-private partnerships completed
        shoreline restoration projects, which reduced
        erosion and supported rooted plant growth.
        Installation of a stormwater filtration basin in
        partnership with Big Lake township has also helped
        reduce the amount of untreated runoff reaching the
        lake. Sherburne SWCD has documented the
        restoration efforts.
    •   Unnamed Creek fish and macroinvertebrate
        delisting: Restoration activity (culvert replacement) has led to the delisting of biological
        impairments (fish and macroinvertebrates) on a tributary to the Elk River at CR 65 near St.
        Cloud. The culvert replacement completed by Sherburne County Public Works restored
        perennial flow to the stream and reduced pooling and sediment build-up.

Watershed assessment results
The MPCA and partners monitored water chemistry in 2009-2010 and again in 2019-2020. The
chemistry data collected between 2009 and 2019 were used to assess if the water quality
standards for aquatic life, recreation, and consumption were being met. The overall goal of these
assessments is to ultimately determine which waters are healthy and in need of protection, or are
polluted and require restoration.
Streams and rivers
One way to assess the health of a stream or lake is to look at the organisms that live in it. These
aquatic communities reflect the cumulative effects of natural and human-caused influences. Both
the MNDNR and MPCA use the index of biological integrity (IBI) as a tool to assess these aquatic
communities in lakes (MNDNR) and streams (MPCA). These indices are scaled 0-100; the higher
the score, the better the condition of the aquatic community.
Between the first and second rounds of biological monitoring in this watershed, the MPCA
adopted new rules to assess aquatic life in channelized streams and ditches. The new rules provide
reasonable aquatic life protections for waterbodies that were legally altered prior to the advent of
the Clean Water Act. As a consequence of the new rules, the most recent assessments include
assessment results for five channelized stream segments. In addition, IBIs for cold water streams
have also been developed, allowing for the assessment of cold-water tributary streams such as
Thiel Creek, Luxemburg Creek, Threemile Creek, and Snake River.
The MNDNR uses a similar IBI tool for assessing aquatic life in lakes, using fish communities. The
FIBI is used to measure a lake’s health and identify lakes that may be impacted by watershed
disturbance, shoreline degradation, or other environmental stressors. FIBI data are used to help
determine stressors affecting lakes and make recommendations for protection and restoration
activities.

                                                     5                            August 2022 | wq-ws3-07010203d
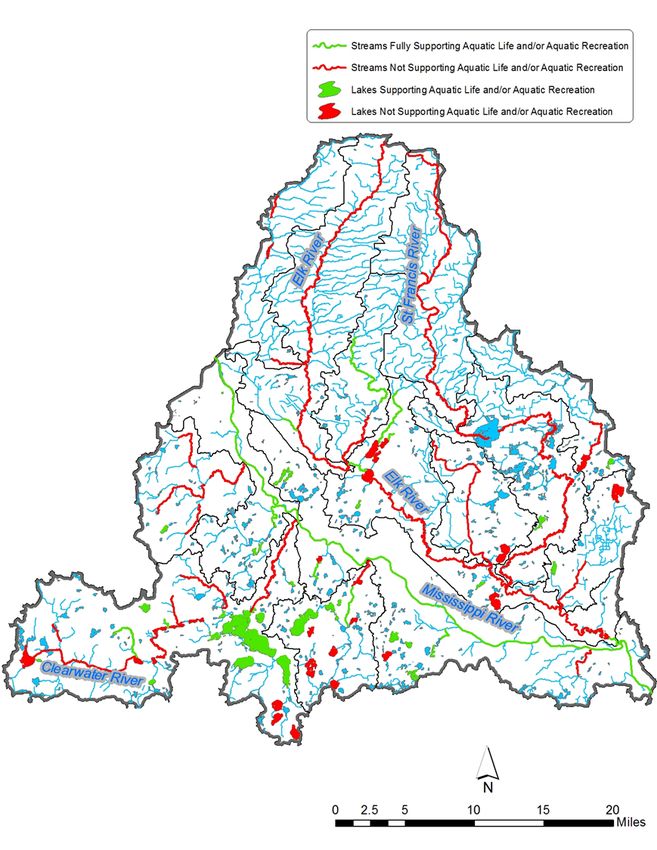
Overall, 40% of the assessed stream reaches in the MRSCW support aquatic life use (Figure 1).
The lower reaches of the Elk and St. Francis Rivers have fish and macroinvertebrate
communities that are in good condition, but many streams, particularly in the lower two-
thirds of the watershed, have biological communities that are severely degraded (Figure 2).
Although some dramatic improvements have occurred, most fish and macroinvertebrate
communities in the watershed exhibit signs of degradation characterized by a dominance of
pollution-tolerant species.
There were four new biological listings added to the 2022 Impaired Waters List. All of the new
listings were on coldwater tributaries to the Elk (Snake River) and Clearwater Rivers (Threemile
Creek). Cold water temperatures and numerous coldwater benthic macroinvertebrates suggest
that these streams could support coldwater fish species (e.g., brook and brown trout), but poor
habitat appears to be a limiting factor. With improved habitat and given the proximity of these
streams to large metropolitan areas, they could provide coldwater angling opportunities to local
anglers.
For the most part, general stream chemistry assessments met, or were close to, meeting
water quality standards. Continued high bacteria concentrations throughout the watershed
are still impacting stream recreational uses, with one shining exception: the Plum Creek
bacteria impairment between Warner Lake and the Mississippi River is being delisted.

Water chemistry parameters generally stayed the same or improved slightly between the two
assessment periods. Only two new chemistry impairments were identified during this cycle:
excessive bacteria in Johnson (Meyer) Creek, and excessive total suspended solids (TSS) in the
Clearwater River (focus is upstream of the Kingston Wetland complex).
Elevated nutrients (such as total phosphorus) were noted on several stream sections in the
headwaters area of the Clearwater River. However, thanks in part to the Kingston Wetland project,
river nutrients and sediments entering Lake Betty are now lower than they used to be. Low
dissolved oxygen remains a potential problem in Rice and Mayhew Creeks, the St. Francis
River and the Clearwater River below Clearwater Lake.

Figure 1. Watershed assessment results for aquatic life and aquatic recreation in streams and lakes.

                                                          6                               August 2022 | wq-ws3-07010203d
Lakes
Lake water quality overall has improved since 2009. A handful of lakes that were previously listed
for excessive nutrients have successfully been removed from the Impaired Waters List (Augusta,
Union, George, and Birch). The City of St. Cloud, Sherburne & Stearns SWCD, and Clearwater River
Watershed District have each worked to successfully restore water quality in these lakes. All
groups have plans of continued diligence as long-term
protection efforts begin.                                   Figure 2. Assessment results for aquatic life and aquatic recreation on
There are now 21 lakes that support recreational uses,          rivers, streams, and lakes.
and 19 that are impaired (Fremont, Julia, and Indian
Lakes are all close to meeting standards). Flow through
type “riverine” lakes are often more likely to be nutrient
impaired (like the chain of Betty-Scott-Louisa-Marie-
Caroline-Augusta), but efforts by the Clearwater River
Watershed District (CRWD) to reduce suspended solids
and river nutrients had a hand in the Lake Augusta
nutrient delisting. Hopefully, we will continue to see
improvements in lake water quality in the future
because of the great work our partners are doing on
both sides of the Mississippi River.
Twenty-nine lakes within this watershed were assessed
for aquatic life for the first time using a fish-based IBI
developed for Minnesota lakes. Two lakes (Mayhew and
Long) were not assessable due to size or frequent
winterkill events. A total of 15 lakes (Bass, Beaver, Birch,
Caroline, Cedar, Clearwater, Eagle (71-0067-00), Elk,
Julia, Limestone, Marie, Mink, Rush, School Section, and
Sugar) fully supported aquatic life. Bass and Cedar Lakes
were considered vulnerable with fish IBI scores very near
the impairment threshold. Sugar Lake was noted as
containing an exceptional fish community.
Assessment results for seven lakes (Ann, Augusta, Elk,
Indian, Louisa, Pleasant, and Somers) were inconclusive,
with four of those lakes (Augusta, Elk, Louisa, and
Pleasant) considered vulnerable. Ida and Long lakes did
not have enough data to make a formal assessment. The
final seven lakes (Betty, Big, Briggs, Eagle, Locke, Mary,
and Mitchell) did not support aquatic life use.
Overall fish diversity was similar to other Minnesota watersheds in central Minnesota. Across the
MRSCW, 46 total fish species were captured in 31 lakes during FIBI sampling. Eleven of these
species are considered to be intolerant to anthropogenic shoreline and watershed stressors within
the watershed (e.g., banded killifish, blackchin shiner, blacknose shiner, cisco, Iowa darter, least
darter, logperch, mimic shiner, pugnose shiner, rock bass, and smallmouth bass), while five species
were considered to be tolerant to these stressors (e.g., bigmouth buffalo, black bullhead, common
carp, fathead minnow, and green sunfish). Four lakes (Augusta, Caroline, Clearwater, and Sugar)
have coldwater habitats and contain cisco (tulibee). This is noteworthy as this watershed is located
along the southern range for this species.
Stressors that are likely influencing these communities include excess nutrient inputs from
agricultural and urban land uses. Most of the assessed lakes (21) are in basins with greater than

                                                       7                                August 2022 | wq-ws3-07010203d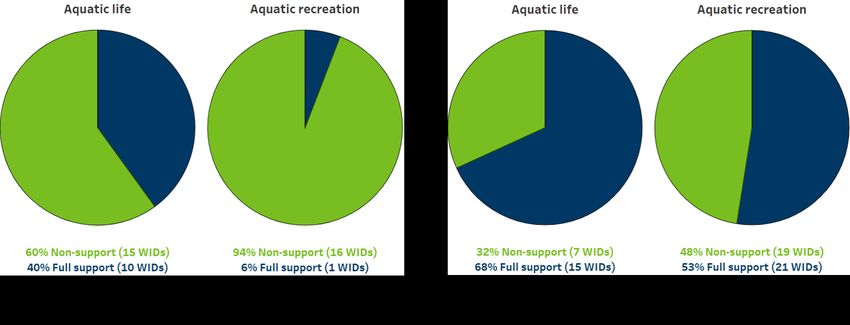
50% disturbed land use, and all the impaired and vulnerable lakes are in highly disturbed basins.
Degraded and/or developed shorelines are another likely stressor. Most of the unimpaired lakes
had shoreline habitat scores that are considered moderate or high, and all impaired lakes had
shoreline habitat scores of very low, or low.
Protection efforts would be particularly beneficial in lakes that are sensitive to an increase in
phosphorus (e.g., Thompson, Bass, Sandy, Ann, Ida, and Laura), with a documented decline in
water quality as measured by Secchi transparency (e.g., Sugar and Nixon Lakes), a comparatively
high percentage of developed land use in the area (e.g., Beaver, Big, Mitchell, School Section,
Ember, Camp, and Pleasant Lakes), or monitored phosphorus concentrations close to the water
quality standard (Figure 5).
Load monitoring results
The MRSCW is in a transitional zone in Minnesota, where the wooded northern portions of the
state begin to meet the agricultural and more urbanized areas of the south. Concentrations of
total phosphorous (TP), nitrogen, and total suspended solids (TSS) reflect the transitional nature of
this watershed, with concentrations generally beginning to increase in this region from north to
south.
The Watershed Pollutant Load Monitoring Network (WPLMN) has three monitoring stations within
the MRSCW. The Clearwater and Elk Rivers discharge directly into Mississippi River, while the St.
Francis River discharges into the Elk River shortly before its confluence with the Mississippi River.
All three subwatershed stations are sampled from snow melt through October 31 annually. The
MRSCW is unique in the fact that unlike other watersheds along the Mississippi River, this
watershed does not have a major/basin station that is monitored year-round. The flow volume and
pollutant loads from the three stations were not only analyzed individually, but cumulative results
from the three subwatershed stations were compared to the Mississippi River site at Anoka, which
is the closest downstream monitoring station on the Mississippi River. This analysis makes it
possible to estimate what contribution the MRSCW has to the Mississippi River.
The three subwatershed stations have good water quality across all three parameters analyzed:
TP, nitrogen, and TSS. All concentrations are expressed as the average flow-weighted mean
concentrations (FWMC), which is the average concentration of a pollutant for all water that passed
a monitoring station over the course of the monitoring period 2015-2019 (Table 1). Each of the
three stations has TSS and nitrogen concentrations in the low range for the regions, all being well
below their respective standards of 30 mg/L (TSS) and 10 mg/L (NO2+NO3). Total phosphorus levels
are low for the Clearwater River and moderate for the Elk and St. Francis, both of which do have
TP concentrations that approach and/or slightly exceed the state standard (0.10 mg/L) As noted
previously, however, there are localized TSS and nutrient concerns in the headwaters of the
Clearwater River; and the total phosphorus levels in the Elk and St. Francis Rivers are high enough
to warrant keeping an eye on. (Figure 3).

                                                     8                            August 2022 | wq-ws3-07010203d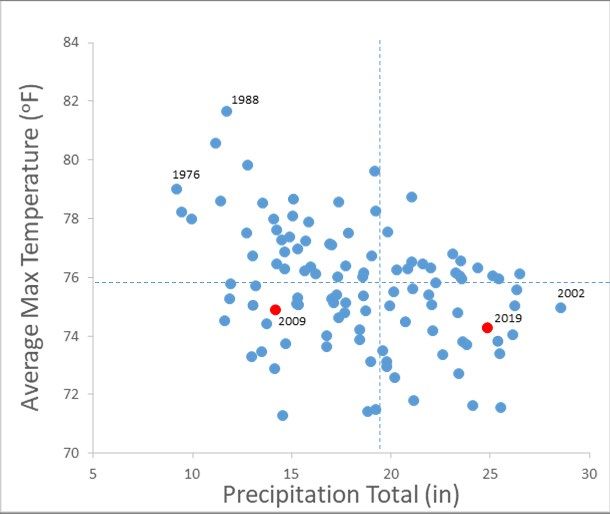
Table 1. Comparison of average total flow-weighted mean concentrations (FWMC) for the Clearwater, Elk, and
St. Francis Rivers (2015-2019).

 Station               Station ID        TSS (mg/L)           NO2+NO3 (mg/L)             TP (mg/L)

 Clearwater             S004-508            5.36                     0.14                   0.028

 Elk                    S000-278            7.00                     0.53                   0.085

 St. Francis            S002-952            5.14                     0.12                   0.078

Nitrate concentrations at the three stations are roughly equal to or slightly higher than the
watersheds to the north but lower than those to the south. Furthermore, the nitrate
concentrations within these systems vary depending on time of year, with concentrations being
higher during spring (specifically during snowmelt runoff) and late fall and lower during the early
summer to early fall time period. Agriculture is more common in this watershed than those to the
north, specifically along the Elk and St. Francis Rivers. It is plausible that nitrates from fertilizers,
manure applications, and decomposition of soils and organic matter are infiltrating the soil and
groundwater below. The groundwater (and nitrates) then enter these rivers during a time when
flows are low and there is less water to dilute the nitrates. Other possible sources of nitrates could
include, but are not limited to, overland flow, municipal and industrial wastewater, as well as other
point and non-point sources.
TP and TSS concentrations are higher than other watersheds further to the north and lower than
concentrations in watersheds in southern Minnesota. Generally, TSS concentrations are associated
with TP concentrations; when one parameter rises so does the other. The increases are commonly
associated with rising flows that occur immediately following heavy rain events. The association
suggests that phosphorus is bound within the sediment particles and when rain events erode the
topsoil and/or river banks surrounding these rivers, the sediment that is washed into the river
from overland flow carries phosphorus along with it.
It should be noted that although agricultural lands are prevalent within the MRSCW, vast areas of
natural landscapes do exist as well, with the most prevalent being the Sherburne National Wildlife
Refuge (NWR) (30,700 acres) and the Sand Dunes State Forest (11,040 acres). Both areas are
located within the St. Francis River Subwatershed with the St. Francis River flowing directly
through the vast network of wetlands within the Sherburne NWR. These wetlands have a strong
influence on the water quality of the St. Francis River and subsequently all downstream waters.
Wetlands provide a multitude of positive benefits, including flood control, sediment trapping, and
nutrient (NO2+NO3 and TP) intake. On balance however, wetlands sometimes have “negative”
impacts on water quality, including exporting some of their stored nutrients and producing water
that is low in dissolved oxygen.
At a local scale, water quality impacts from the three subwatershed sites on the central portion of
the Mississippi River in Minnesota is fairly low for all three parameters when compared to the
average loads measured in the Mississippi River at Anoka. In total, the MRSCW contributes 6% of
the total drainage area and 4.5% of the total flow volume to the Anoka station. Phosphorus is the
largest contributing pollutant at 3.5% of the annual load at Anoka while nitrates and TSS inputs
have a lesser impact, contributing 1.4 and 1.9% percent of the average loads, respectively.
Additional maps and supporting data can be found at
https://www.pca.state.mn.us/water/watershed-pollutant-load-monitoring.

                                                        9                              August 2022 | wq-ws3-07010203d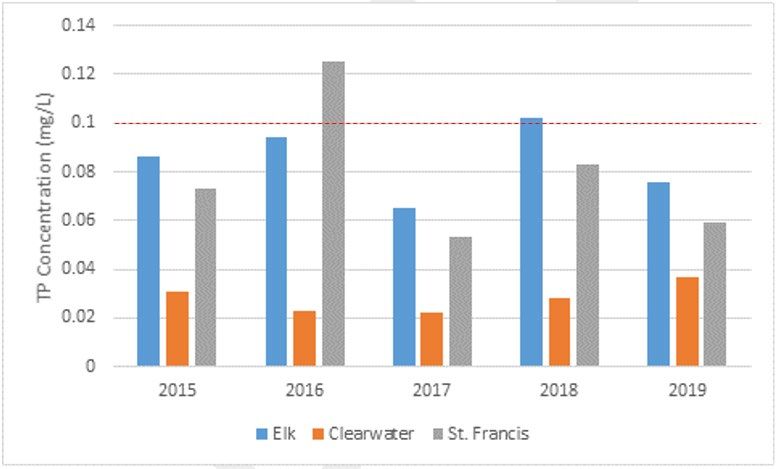
Figure 3. Mississippi River-St. Cloud Subwatershed stations Total phosphorous (TP) flow-weighted mean
concentration (FWMC), 2015-2019. State TP standard is 0.1 mg/L (dashed red line).

Trends
A key objective of the 2017 monitoring effort was to evaluate if and how water quality has
changed since 2007 (Figure 4-next page). If water quality has improved, it is important to
understand to what extent strategy development, planning, and implementation, based on the
initial work and combined with actions that were already underway, may be responsible. It is
equally important to understand if water quality does not appear to be changing, or is declining.
Either way, the knowledge will help inform future activities.
Trends in four different aspects of water quality were analyzed to provide as robust a picture as
possible of what is happening in the MRSCW:
1. Streamflow, sediment (total suspended solids), TP, and nitrogen (nitrate)
2. Biological communities
3. Clarity of lakes
4. Climate

                                                        10                              August 2022 | wq-ws3-07010203d
Streamflow and pollutant concentrations
Without a major/basin station, a direct
                                             Figure 4. Average yearly flow (cfs) at Mississippi River near Anoka, 1940-2020.
measure of flow volume and pollutant
loads within the MRSCW was not
possible. An analysis of flow volume and
pollutant loads at the Mississippi River at
Sartell and Anoka, which bracket this
watershed, provide a useful substitute
for the purpose of determining trends
with the caveat that the Crow River and
Sauk River Watersheds also contribute
water between these two stations.
Short- (10 year) and long- (40 year) term
trend results were mixed between
parameters. TP concentrations declined
over the short- and long-term at both
stations, while TSS concentrations
showed similar declines except for the short-term (10 year) analysis at Anoka, which showed a
slight increase. Nitrate trend results showed significant increases in concentrations at both stations
over the short- and long-term time periods. Figure 4 displays the long-term yearly average flow
data at Mississippi River near Anoka. Flows at the Anoka station have increased by roughly 3,000
cfs or 25% during the 80-year period of record shown in Figure 4. Flows in the Minnesota River, by
contrast, have shown an increase of nearly 300% over the same period. This suggests a higher level
of landscape resiliency to precipitation increases in the Upper Mississippi Basin, including in the
Mississippi River-St. Cloud Watershed.

Biological communities
Paired t-tests of fish and macroinvertebrate IBI scores were used to evaluate if the biological
condition of the watershed’s rivers and streams has changed between
time periods. Independent tests were performed on each community
with 22 sites evaluated for macroinvertebrates and fish (i.e., sites that   Figure 5. Index of Biological Integrity Scores
                                                                            between intensive watershed monitoring
were sampled in both time periods). The average macroinvertebrate           efforts; note IBI score does not correspond to
IBI score for the watershed increased by 12.0 points between 2009           assessment thresholds.
and 2019, which represents a statistically significant increase. Similarly,
FIBI scores across the MRSCW increased by 8.2 points, which was
also a statistically significant increase (Figure 5). Large changes in
IBI score occurred in some streams, namely portions of the Elk, St.
Francis, Clearwater Rivers, and a few smaller streams. MIBI scores
in the Elk River increased by 30 points in the upper reach (-508)
and nearly 50 points in the lower reach (-579). While the lower
reach is still listed as impaired for fish and macroinvertebrates, a
TMDL for the biological stressors on this reach will not be
required. The reach has been classified as vulnerable to provide
added protection from future degradation. MIBI scores on the St.
Francis River also increased, resulting in the delisting of the upper
reach for macroinvertebrates. While this delisting was not directly
attributed to a specific watershed improvement activity, cattle
were excluded from the stream in the upper portions of the
segment where they previously had access.

                                                        11                              August 2022 | wq-ws3-07010203d
For fish, the upper and middle portions of the St. Francis River saw a range of improvements (9-26.5
points) in FIBI score; however, numerous dams within the Sherburne National Wildlife Refuge
continue to restrict the movement of large migratory fish species (e.g., shorthead and silver
redhorse).
A similar change analysis was not completed for lakes because comparable fish community data had
not been collected during the first time.
Climatic conditions can affect aquatic communities in a Figure 6. Characterization of air temperature and rainfall
variety of ways by altering flow volumes, increasing conditions for May-September period across the historical
water temperatures, decreasing dissolved oxygen record of climate data for the Mississippi River-St Cloud
concentrations, degrading habitat, and decreasing Watershed. Dashed lines represent normal (1991-2020)
connectivity. The impact of climatic conditions/weather maximum temperature and total precipitation values for the
events on stream aquatic life are dependent on the watershed. IWM years highlighted in red.
timing, magnitude, frequency, and duration of events
as well as the type of stream or biological community.
Overall, given the dry conditions affecting the
watershed in 2009 and the wet conditions present in
2019, some of the observed changes in biological
condition at either the watershed or individual site
scale may (in part) be due to differences in climatic
conditions between the two years. In 2009, the
MRSCW experienced a moderate rainfall deficit (-4.8
inches) and near normal temperatures (-0.6 o F) during
the period that biological stream monitoring was
conducted by the MPCA (May-September). In contrast,
the watershed had above normal precipitation (+5.9
inches) and was somewhat cooler (-1.2 o F) in 2019
between May and September (Figure 6). The calendar
year of 2019 is just shy of the estimated wettest on
record for the watershed with a total of ~40 inches of
rain.
12 August 2022 | wq-ws3-07010203dClarity of lakes
Figure 7. Change in water quality in the Mississippi River-St. Cloud
Water transparency is typically a good indicator Watershed over the last 10 years. Blue lakes indicate either no change or
of overall lake water quality. As water clarity they were not sampled as part of this effort.
increases, there is a greater likelihood that water
quality standards are being met. There are 64
lakes with some level of transparency data in this
watershed, thanks in large part to volunteer
monitoring. Of those 64 lakes, 58 have enough
data to estimate a long-term change in clarity if it
were present (i.e., at least 50 Secchi
measurements over eight years). An improving
trend was noted in 16 lakes, including some of
the most heavily used recreational lakes
(Clearwater, Orono, Big, Mitchell, etc.) while only
three showed a decline (Albion, Fish, and
Crooked) (Figure 7). For more details of a
particular waterbody, please visit the Water
Quality Assessment Results Data Viewer |
Tableau Public.
Climate
The MNDNR Climate Summary for Watersheds
summarizes regional climate data (available from
1895 through 2018) and provides a comparison
of the most recent 30-year average against the
entire data record. Compared with the historical
average (1895-2018), the MRSCW currently
receives on average an additional 2.3 inches of
rain. Most of this increase occurs in the spring
(March-May; 1.0”) and summer months (June-
August; 0.8”). Meanwhile, the average annual
temperature across the watershed has increased
by 1.4° F, with a more pronounced increase
(+2.8° F) observed during the winter (December-
February).
More precipitation and reduced snow cover can increase soil erosion, pollutant runoff, and stream
flow. Increased stream flow in turn can lead to in-stream channel erosion and degraded habitat for
aquatic life. Longer growing seasons with higher temperatures can lead to more algal blooms,
especially in lakes. These changes will complicate efforts to protect and restore the aquatic
resources in the watershed. For a more comprehensive analysis of climate trends for the MRSCW.
See: DNR climate summary for the Mississippi River-St. Cloud Watershed.
13 August 2022 | wq-ws3-07010203dThis study of MRSCW was conducted as part of Minnesota’s Watershed
For more Approach to restoring and protecting water quality. Efforts to monitor, assess,
study, and restore impaired waters, and to protect healthy waters are funded
information by Minnesota’s Clean Water, Land, and Legacy Amendment. This approach
allows for efficient and effective use of public resources in addressing water
quality challenges across the state. The data and assessments produced by this
study can inform local efforts to restore and protect waters in the MRSCW,
such as the One Watershed One Plan document, a comprehensive watershed
management plan that targets projects to protect and restore the watershed’s
most valuable resources. For more information, go to the MPCA Mississippi
River-St. Cloud webpage, or search for “St. Cloud” on the MPCA website.
Contact Benjamin Lundeen
Minnesota Pollution Control Agency
benjamin.lundeen@state.mn.us
218-316-3894
14 August 2022 | wq-ws3-07010203dYou can also read