Microbiome changes in a stranding simulation of the holopelagic macroalgae Sargassum natans and Sargassum uitans
←
→
Page content transcription
If your browser does not render page correctly, please read the page content below

Microbiome changes in a stranding simulation of the holopelagic macroalgae Sargassum natans and Sargassum uitans Inara R. W. Mendonça inara.regina@gmail.com Universidade de São Paulo Tom Theirlynck tom.theirlynck@nioz.nl Royal Netherlands Institute for Sea Research Erik R. Zettler erik.zettler@nioz.nl Royal Netherlands Institute for Sea Research Linda A. Amaral-Zettler linda.amaral-zettler@nioz.nl Royal Netherlands Institute for Sea Research Mariana Cabral Oliveira mcdolive@ib.usp.br Universidade de São Paulo Research Article Keywords: Golden Tide, microbial community, dysbiosis, high-throughput sequencing, Amplicon Sequence Variants Posted Date: January 3rd, 2024 DOI: https://doi.org/10.21203/rs.3.rs-2556643/v2 License: This work is licensed under a Creative Commons Attribution 4.0 International License. Read Full License Additional Declarations: The authors declare no competing interests. Version of Record: A version of this preprint was published at Ocean and Coastal Research on January 1st, 2024. See the published version at https://doi.org/10.1590/2675-2824072.23111.
1   Title: Microbiome changes in a stranding simulation of the

 2   holopelagic macroalgae Sargassum natans and Sargassum fluitans

 3

 4   Inara R. W. Mendonça*, ORCID: 0000-0003-2680-1431

 5   Department of Botany, Institute of Biosciences, University of Sao

 6   Paulo, São Paulo, Brazil

 7   *Corresponding author: E-mail: inara.regina@gmail.com (Inara

 8   Mendonça)

 9

10   Tom Theirlynck

11   NIOZ Royal Netherlands Institute for Sea Research, Texel, The

12   Netherlands

13   Institute for Biodiversity and Ecosystem Dynamics, University of

14   Amsterdam, The Netherlands

15

16   Erik R. Zettler, ORCID: 0000-0002-9266-1142

17   NIOZ Royal Netherlands Institute for Sea Research, Texel, The

18   Netherlands

19

20   Linda A. Amaral-Zettler, ORCID: 0000-0003-0807-4744

21   NIOZ Royal Netherlands Institute for Sea Research, Texel, The

22   Netherlands

23   Institute for Biodiversity and Ecosystem Dynamics, University of

24   Amsterdam, The Netherlands

25

                                                                         1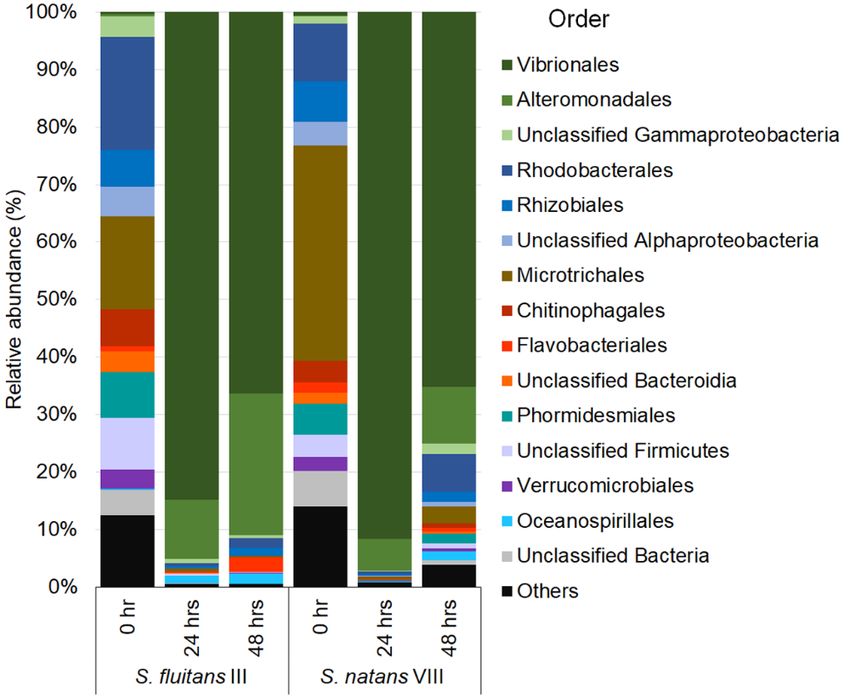
26   Mariana Cabral Oliveira, ORCID: 0000-0001-8495-2962

27   Department of Botany, Institute of Biosciences, University of Sao

28   Paulo, São Paulo, Brazil

29   Acknowledgements

30        We thank the NIOZ R/V Pelagia crew members and scientists

31   aboard the cruise 64PE455, and Vivian Viana and Rosário Petti for

32   technical support at LAM-USP, and Jan van Ooijen in the OCS

33   department at NIOZ for nutrient analyses. This manuscript is a

34   contribution of NP-BioMar, USP.

                                                                         2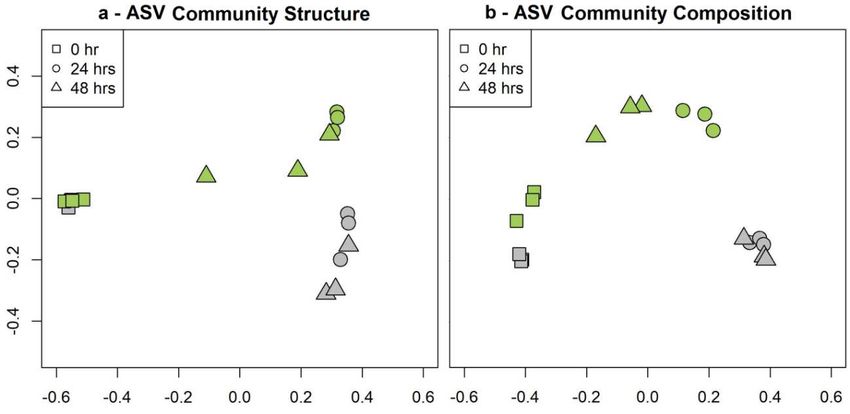
35   Abstract

36

37   Holopelagic Sargassum has been causing massive strandings on

38   tropical Atlantic Ocean shorelines. After stranding, the algal biomass

39   starts to decompose, releasing nutrients, toxic gases, and potentially

40   introduces exogenous macro and microorganisms. Describing the

41   microbiome associated with Sargassum, and how it changes after

42   stranding is important in identifying potential microbial introductions

43   to   coastal   environments,      as   well   as   sources   of     potential

44   biotechnological resources. In this study, stranding simulation

45   exploratory experiments were done for S. fluitans III and S. natans

46   VIII on shipboard. Samples for microbiome identification were taken

47   at 0 hr, just after removing healthy Sargassum from the seawater, and

48   after 24 and 48 hrs of stranding simulation under environmental

49   conditions.    The    bacterial   community      was   identified   through

50   sequencing     of    16S   rRNA   gene   V3-V4     hypervariable    regions,

51   generating a total of 2,005 Amplicon Sequence Variants (ASVs). Of

52   those, 628 were shared between Sargassum species. The stranding

53   simulation changed the microbial community and only 30, out of 2,005

54   ASVs, persisted throughout the experiment. Phototrophs were in the

55   main functional group at 0 hr, shifting to chemoheterotrophs within

56   the first 24 hrs of exposure of Sargassum to air conditions. The most

57   abundant orders Microtrichales and Rhodobacterales at 0 hr, were

58   replaced after 24 hrs of exposure by Alteromonadales and Vibrionales,

59   the latter representing up to 91% of the relative abundance in the

                                                                                3
60   bacterial community. Even though these are initial results they

61   emphasize the need to better investigate the microbiome once its

62   biomass could become a fertile ground for potentially pathogenic

63   bacteria.

64

65   Keywords: Golden Tide, microbial community, dysbiosis, high-

66   throughput sequencing, Amplicon Sequence Variants.

67   Introduction

68         Sargassum is a genus of brown macroalgae (Sargassaceae,

69   Fucales, Phaeophyceae) comprising more than 350 species [1]. Most

70   Sargassum species are benthic and grow attached to a substrate by a

71   structure called a holdfast, except for Sargassum natans and S.

72   fluitans that are holopelagic (floating for their entire life cycle). These

73   species often form floating rafts in open oligotrophic waters and

74   historically had a geographic range largely confined to the Sargasso

75   Sea. The floating holopelagic Sargassum constitutes an ecosystem on

76   its own, with at least ten endemic species, such as the Angler Fish

77   (Histrio histrio), crab species (Planes minutes), Sargassum shrimp

78   (Latreutes fucorum), and Sargassum pipefish (Syngnathus pelagicus)

79   [2, 3]. It provides a habitat, nursery, and haven for endemic and many

80   other marine organisms in oligotrophic waters with limited floating

81   substrate [2, 4]. For those reasons, it has been named a “Golden

82   Floating Rainforest” by Laffoley et al. [3].

83         Floating Sargassum is transported by wind and surface currents

84   towards coastlines where it strands. Due to its golden yellow color,

                                                                              4
85 when healthy, holopelagic Sargassum stranding on coastlines is often
86 referred to as Golden Tides, but some groups have shifted to calling it
87 “Brown Tides” since their golden color turns to dark brown as the
88 biomass accumulates and decays [5]. Up until 2011, the stranding
89 events were mostly limited to the Gulf of Mexico and Bermuda, after
90 which, massive amounts of both Sargassum species started to strand
91 on South American, Caribbean and African shorelines [6–9],
92 introducing the hypothesis of a new region of accumulation of
93 Sargassum in the tropical Atlantic Ocean.
94 In 2018 Wang et al. [10] used remote sensing approaches to
95 describe the Great Atlantic Sargassum Belt (GASB) in the North
96 Equatorial Recirculation Region (NERR), 8,000 km long and estimated
97 to contain more than 20 million metric tons of Sargassum biomass.
98 One proposal for the origin of the GASB is that a negative anomaly at
99 the North Atlantic Oscillation (NAO) during the winter of 2009–2010
100 shifted the wind direction westerly resulting in the transport of
101 Sargassum from the Sargasso Sea into the NERR [11]. The annual
102 recurrence of Sargassum blooms, however, might be the result of
103 changing environmental conditions including: exposure to higher
104 sunlight intensities and seawater temperatures, increased open-ocean
105 upwelling bringing nutrients to surface, elevated Amazon, Orinoco,
106 and Niger Rivers nutrient inputs, and dust deposition from the Sahara
107 Desert [10–12].
108 Sargassum can become a menace to coastal environments when
109 massive coastal accumulations occur. Shortly after stranding the
5110 biomass starts to decompose turning the water brown, blocking
111 sunlight penetration with consequent anoxic conditions, loss of
112 nutrients and causing mass mortality in vulnerable marine
113 communities [5, 13]. After 48 hours onshore, the algae start decaying
114 and releases toxic gases like hydrogen sulfide and ammonia, both
115 reported to affect respiratory, cardiovascular, and neurological
116 system of humans and other animals roaming around the beach [14].
117 Many of the affected regions rely on tourism or fisheries for their
118 livelihoods, making removal of Sargassum biomass essential, but
119 incurring both monetary and environmental costs. Mexican coastal
120 areas have spent up to 284,000 USD per km on cleaning beaches [15],
121 not including financial losses to fisheries, tourism, local biodiversity,
122 coastal erosion and other ecosystem damages. Problems aside,
123 stranded Sargassum biomass has also been seen as an opportunity to
124 extract bioproducts such as biochemicals, animal feed, fertilizer, and
125 fuel [7].
126 Large-scale effects of Sargassum strandings are an active area
127 of research, but we know much less about the contribution of its
128 microbiome to these coastal stranding sites. Recent studies identified
129 Vibrio OTUs (Operational Taxonomic Units) that clustered within
130 pathogenic strains in NERR-collected holopelagic Sargassum
131 microbiomes and Vibrio pathovars were identified at different
132 substrates of Sargasso Sea [16–18]. High abundance of Vibrio was also
133 identified in Sargassum stranded in Caribbean Islands of Martinique
6134 and Guadeloupe [19]. However, an earlier study in 2010 did not report
135 Vibrio OTUs in holopelagic Sargassum from the Gulf of Mexico [20].
136 The possibility of introducing foreign pathogenic
137 microorganisms imposes yet another threat to coastal regions,
138 alongside possible impacts to the local microbiome, with unknown
139 consequences. The concentration of such opportunistic pathogenic
140 bacteria could increase under global warming conditions [21]. For
141 example, elevating water temperature caused Kelp microbiome
142 dysbiosis and enrichment of pathogenic bacteria [22]. Holopelagic
143 Sargassum microbiomes could go through the same process in the
144 open ocean as the sea surface temperature rises.
145 We hypothesized that the Sargassum microbiome undergoes
146 extensive changes in composition and structure during stranding
147 events associated with exposure to desiccation and other
148 environmental conditions. In this work we simulated a Sargassum
149 stranding event to characterize and understand how the Sargassum
150 microbiome changes, and potentially alters the native microbiome of
151 shorelines affected by brown tides.
152
153 Materials and methods
154 Study area
155 Holopelagic Sargassum was collected in the Great Atlantic
156 Sargassum Belt, in the North Equatorial Recirculation Region (NERR),
157 aboard the RV Pelagia cruise 64PE455 in the summer of 2019 (Fig. 1).
158 The NERR extends from Northern Brazil to the Gulf of Guinea in
7159 Western Africa and encompasses the area from approximately 5° S to
160 10° N. This region is bounded by currents including the South
161 Equatorial Current (SEC), North Equatorial Counter Current (NECC)
162 and North Brazil Current (NBC) [8, 23].
163
164 Fig. 1 Sampling sites in the tropical Atlantic Ocean. Sargassum
165 fluitans III was collected at 6.7400° N -37.0879° W on 25 July 2019,
166 and S. natans VIII was collected at 8.5676° N -49.8546° W, on 4
167 August 2019 (green squares). The North Equatorial Recirculation
168 Region (NERR), where holopelagic Sargassum accumulates, is shown
169 in the center of the North Equatorial Countercurrent (NECC), South
170 Equatorial Current (SEC) and North Brazil Current (NBC). Map source
171 GSHHG database version 2.3.7 of 2017. Map source GSHHG database
172 version 2.3.7 of 2017 [24]
173
174 Sampling site
8175 Healthy Sargassum was collected using a manta trawl sterilized
176 with 10% (v/v) bleach solution and 70% (v/v) ethanol solution, then
177 immediately transferred with gloved hands to clean buckets sterilized
178 with 10% (v/v) bleach solution and 70% (v/v) ethanol solution and filled
179 with ambient sea surface water. Sargassum was sorted by
180 morphotypes. The species were identified following Parr [25] and
181 Winge’s [26] descriptions. Vouchers were pressed on paper, free of
182 fixative, and archived at the SPF herbarium - Universidade de São
183 Paulo (USP) under the identification numbers SPF 58583 and SPF
184 58584 (Index Herbariorum, Herbarium Code:SPF
185 http://sweetgum.nybg.org/science/ih/). Shipboard Restriction
186 Fragment Length Polymorphism (RFLP) of molecular mitochondrial
187 markers cox2 and cox3 [27] confirmed our morphology-based species
188 identifications of S. fluitans III and S. natans VIII morphotypes, hereon
189 referred to as Sf III and Sn VIII. A total of 3 kg of Sf III was collected
190 at 6.74° N -37.09° W on 25 July 2019, and 0.7 kg of Sn VIII was
191 collected at 8.57° N -49.85° W on 4 August 2019. At each sampling
192 site, seawater salinity, temperature, and nutrient concentrations
193 (PO43-, NO3/NO2, NO2 and Si) were measured from the shipboard
194 clean seawater system with an intake at 3 meters-depth.
195 Immediately following collection, we cut phylloids from branch
196 tips of three different specimens of each morphotype and preserved
197 them in silica gel (see details below), representing time zero (0 hr)
198 samples. After sampling for the 0 hr time point, Sargassum biomass of
199 each species was placed in an individual sterilized plastic tray (70 cm
9200 x 70 cm) and covered with a nylon net (3 cm x 3 cm mesh) to avoid
201 biomass removal by wind on shipboard. The trays were placed on the
202 roof of the ship’s bridge deck to minimize shading and contamination
203 by activities on lower decks and left exposed to environmental
204 conditions (Fig. S1a). After 24 and 48 hrs of exposure, phylloids were
205 sampled from three different clumps collected from inside the
206 Sargassum pile, characterized by humidity and decomposition, while
207 the outside layer of the pile appeared dehydrated (Fig. S1b). All 18
208 samples (triplicate samples for 0 hr, 24 hrs, 48 hrs for both Sf III and
209 Sn VIII) were cleaned by manual removal of most of the fouling fauna
210 and then preserved in silica gel [28] and -20 ºC and later stored at -80
211 °C in the Laboratório de Algas Marinhas "Edison José de Paula" (USP-
212 Brazil).
213 Environmental conditions such as air temperature, light
214 intensity, biomass weight changes and incidence of rain were
215 monitored during the exposure experiment. Air temperature and light
216 intensity were measured using a sensor data logger (HOBO® Logger
217 Onset USA) placed beside the trays recording measurements at one-
218 minute intervals (Fig. S1a). Complementary air temperature data
219 were obtained from the ship's meteorological thermometer, which is
220 protected from sunlight, unlike the sensor data logger. We estimated
221 total biomass weight with three consecutive measurements by
222 suspending the tray from an electronic scale (WeiHeng® mod 128)
223 before each sampling event. The repetition of measures was necessary
224 to correct for the ship movement reducing the precision of the scale.
10225 In case of rain, trays had drainage holes to allow rainwater to flow
226 away from the Sargassum.
227 Salinity, temperature, and nutrient concentrations were
228 measured at both sampling sites (Table S1a). Illuminance and air
229 temperature were recorded throughout our Sf III experiment,
230 however, during the Sn VIII simulation, we suffered data losses, so we
231 used mean values from before and after the simulation. We also used
232 the ship's meteorological thermometer data to complement on-site air
233 temperature measurements (Table S1b). The ship’s thermometer
234 recorded lower values since it was kept shaded and ventilated to
235 measure air temperature without the sun's influence, unlike the Hobo
236 Logger, which was directly exposed to sunlight (as was the
237 Sargassum). Humidity loss was measured by daily weighing of the
238 biomass and, despite a rainfall after 24 hrs, (Sn VIII) biomass weight
239 decreased 70% in Sf III and 58% in Sn VIII after 48 hrs of the
240 experiment (Table S1c).
241
242 Microbiome - DNA extraction, amplification, and high-
243 throughput sequencing
244 The microbial community associated with Sargassum was
245 extracted and sequenced as a whole, including the endophytic and
246 remaining epiphytic compartments. The DNA extraction, PCR
247 amplification, and high-throughput sequencing were performed at the
248 GoGenetic - Biotechnology Company (Curitiba, Brazil;
249 gogenetic.com.br) using the following steps. The phylloids were
11250 pulverized with a bead beater Vortex Genie2 (Scientific Industries,
251 NY-USA), with adapter SI-H524 for 20 min. The DNA was extracted
252 using the Quick-DNA Fecal/Soil Microbe Miniprep kit (Zymo)
253 according to the Manufacturer’s protocol, following the non-soil
254 procedure. The PCR amplification was based on the Earth Microbiome
255 Project protocol [29], using universal primers 341F
256 (CAGCCTACGGGNGGCWGCAG) and 805R
257 (ACAGGACTACHVGGGTATCTAATCC) to amplify the V3-V4 regions of
258 the 16S rRNA gene with the following modifications. PCR
259 amplification using GoTaqG2 Mastermix (Promega) was performed
260 with the following cycle settings: 94 °C for 3 minutes; 18 cycles of 95
261 °C for 30 seconds, 50 °C for 45 seconds, 72 °C for 30 seconds; final
262 extension of 72 °C for 10 min and hold at 4 °C. 16S PCR results were
263 verified with gel electrophoresis and concentrations were quantified
264 on a Qubit 2.0 Fluorometer (Invitrogen, Life technology, CA, USA).
265 The amplicon sequencing was performed on the Illumina MiSeq
266 platform with the MiSeq Reagent 500 V2 Kit, generating paired-end
267 reads (2 x 250 bp). Raw 16S rRNA sequence data are available on the
268 NCBI Sequence Read Archive (SRA-NCBI) under bio project accession
269 ____, and further sampling information are given in the MIMARKs
270 Table (Table S2).
271
272 Sequence analysis and bioinformatics
273 The microbial community analysis was performed using the
274 Quantitative Insights into Microbial Ecology (QIIME2 version
12275 2019.7.0) bioinformatics platform [30]. Quality read assessment was 276 done using the function qiime demux summarize. The reads were 277 merged, denoised, chimera checked and sequences clustered into 278 Amplicon Sequence Variants (ASVs) with the DADA2 pipeline [31, 32]; 279 parameters were -p-trim-left-f 5 -p-trim-left-r 5 -p-trunc-len-f 180 -p- 280 trunc-len-r 100. Low frequency ASVs were removed (
300   (0 hr, 24 hrs and 48 hrs) nested in the top factor Sargassum (Sf III and

301   Sn VIII) using the GAD package for nested factors [39] after verifying

302   homoscedasticity (Bartlett test) and normality (Shapiro-Wilk test) of

303   the data. Significant results were compared with Tukey HSD post-hoc

304   pairwise tests. Richness of ASV´s was used to build Venn diagrams

305   using VennDiagram package [40]. ASVs shown as shared between Sf

306   III and Sn VIII went through further analyses to compare their

307   abundances (number of reads) over time and between Sargassum

308   species using a Permutational Multivariate ANOVA (PERMANOVA)

309   (Bray Curtis distance matrix and 9999 permutations).

310         To describe beta diversity changes in the microbial community

311   we analyzed Community Structure by using total ASV abundances in

312   a PERMANOVA (Bray Curtis distance matrix and 9999 permutations).

313   Total ASV abundances were then transformed into presence/absence

314   data to perform a Community Composition PERMANOVA (Jaccard

315   distance matrix and 9999). A Principal Coordinate Analysis (PCoA)

316   was performed to show the differences between Sargassum species

317   and the effect of the Exposure experiment. A PERMANOVA statistical

318   test was also used to evaluate microbiome order abundance, and

319   presence/absence variations. All PCoAs and PERMANOVAs were

320   generated in R statistics using the “vegan” package [41] after

321   checking for homogeneity of group dispersions using Betadisper.

322

323   Results

                                                                           14
324 High-throughput sequencing generated a total of 2,360,794 raw
325 paired-end reads. This resulted in a total of 1,281,933 high-quality
326 sequences with mean length of 230 bp (± 14 sd) and corresponding to
327 2,005 ASVs. Taxonomic assignment of ASVs associated with Sf III
328 identified 13 bacteria phyla, corresponding to 18 classes, 51 orders,
329 77 families and 95 genera. For Sn VIII there were 13 Bacteria phyla,
330 corresponding to 27 classes, 75 orders, 105 families and 125 genera
331 identified.
332 Abundance (number of reads) within orders were similar
333 between Sargassum species (PERMANOVA: p = 0.081, Table S4), but
334 not at different time points during the stranding simulation
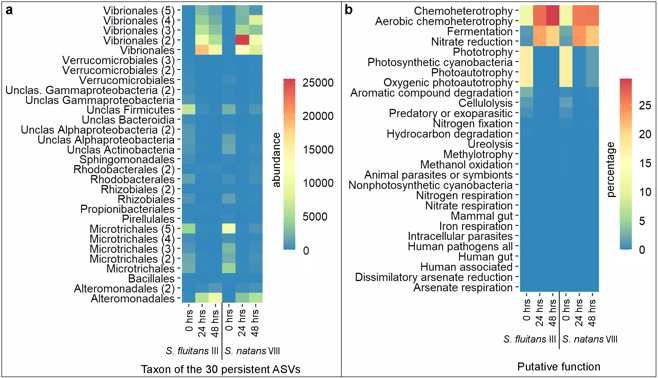
335 (PERMANOVA: p < 0.001, Table S4). The most abundant bacterial
336 orders (Fig. 2) associated with Sf III 0 hr samples were
337 Rhodobacteriales (19%, 14,668 ± 165 sd), Microtrichales (16%,
338 12,092 ± 2,586 sd), unclassified Firmicutes (9%, 6,708 ± 1,731 sd)
339 and Phormidesmiales (8%, 5,984 ± 2,869 sd). A similar distribution
340 was found in Sn VIII 0 hr samples with the dominance of
341 Microtrichales (37%, 23,796 ± 8,780 sd), Rhodobacterales (10%,
342 6,374 ± 1,403 sd), Rhizobiales (7%, 4,487 ± 1,190 sd) and
343 Phormidesmiales (5%, 3,416 ± 2,422 sd). After 24 hrs of simulation,
344 the microbiome went through dysbiosis causing drastic reduction in
345 abundances of the majority of the associated bacteria. In contrast,
346 some orders increased in abundance, such as Alteromonadales (Sf III:
347 7,405 ± 2,516; Sn: VIII 4,438 ± 1,523 sd) but nothing compares to
348 Vibrionales that reached up to 91% (73,040 ± 7,038 sd) of the relative
15349 abundance in 24 hrs in Sn VIII. After 48 hrs, Vibrionales was still the
350 most abundant group (Sf III: 35,188 ± 11,465; Sn: VIII 54,819 ±
351 25,515 sd), however there was an increase in abundance of
352 Flavobacteriales, Rhodobacteriales and Rhizobiales.
353
354 Fig. 2 Distribution of bacterial orders associated with S. fluitans III
355 and S. natans VIII throughout the stranding simulation. Relative
356 abundance (% of reads) of the most abundant microbiome orders
357 associated with S. fluitans III and S. natans VIII within the stranding
358 simulation sampling times (0, 24 and 48 hrs) (n = 3 per sampling time)
359
360 As expected, richness of orders significantly decreased within
361 the stranding simulation with Sf III losing a total of 28 orders, while
362 Sn VIII lost 12 orders. Six of these orders were commonly lost in both
363 simulations: Ardenticatenales, Caldilineales, Candidatus Peribacteria,
364 Psycisphaerales, Rickettsiales and Synechococcales.
16365 Presence/absence of orders was also different between Sargassum
366 species (PERMANOVA: p = 0.003, Table S4). This result is consistent
367 with both species of Sargassum having unique associations at the
368 order level (e.g. Sf III: Thiohalorhabdales and Bacteroidales; Sn VIII:
369 Pseudonocardiales and Clostridiales).
370 The effect of the stranding simulation at ASV level is shown in
371 the PCoA plot in Fig. 3 which demonstrates that at 0 hr the community
372 structure was very similar in both species, and it shifted after the
373 beginning of the stranding simulation (Fig. 3a). Community
374 composition based on presence/absence alone, on the other hand, was
375 not similar between Sargassum species at 0 hr and these differences
376 increased throughout the stranding simulation (Fig. 3b). PCoA
377 patterns agree with the PERMANOVA results, showing significant
378 changes in microbial community structure and composition within the
379 stranding simulation sampling times (PERMANOVA: p < 0.001 for
380 both community structure and composition, Table S5). Significant
381 differences were also recorded when comparing Sargassum species
382 community structure and composition (PERMANOVA: p = 0.003 and
383 p = 0.001, Table S5), owing to the fact that out of 2,005 ASVs only 628
384 were shared between Sf III and Sn VIII (Fig. 4, bottom). Despite being
385 shared, these 628 shared ASVs had significantly different values of
386 relative abundance between Sargassum species (PERMANOVA, p =
387 0.013, Table S5).
388
17389 Fig. 3 Structure and composition of the Sargassum microbiome
390 throughout the stranding simulation. Principal coordinate analysis
391 (PCoA) of the bacterial communities associated with Sf III and Sn VIII
392 throughout the stranding simulation. PCoA of community structure
393 based on abundance data (a) and community composition based on
394 presence/absence data (b) of ASVs associated with Sargassum. Grey
395 symbols – Sf III; Green symbols – Sn VIII; Squares 0 hr; Circles 24 hrs;
396 Triangles 48 hrs (18 samples are plotted)
397
398 Before the experiment began, Sf III and Sn VIII shared only 30%
399 of the ASVs at 0 hr (444 ASVs shared out of a total of 1476 ASVs
400 identified at 0 hrs) (Fig. 4, top). After the first 24 hrs of exposure to
401 environmental conditions in the stranding experiment, there was a
402 five-fold decrease in ASV observed richness for Sf III (0 hr = 1137; 24
403 hrs = 222) and three-fold decrease for Sn VIII (0 hr = 783; 24 hrs =
404 266). After 48 hrs, Sf III had a similar richness to the 24 hrs timepoint
405 (223 ASVs), while there was increase in richness (720 ASVs) for Sn
406 VIII in relation to the 24 hr samples (Fig. 4, side Venns). The
18407 Shannon’s diversity index, based on rarefied data of 38,317 reads per
408 sample, showed similar diversity between Sargassum species and
409 significantly higher microbiome diversity in 0 hr samples compared to
410 those after 24 hrs of exposure. Shannon’s Index at 24 hrs and 48 hrs
411 were similar for Sf III (Tukey HSD: p = 0.99) (Fig. S3; Table S6). The
412 same was not reported for Sn VIII, where after 48 hrs a higher
413 diversity was observed compared to 24 hrs (Tukey HSD: p = 0.008).
414
415 Fig. 4 Venn diagram representing ASV distribution along the
416 stranding simulation in Sf III (left, shades of grey) and Sn VIII (right,
417 shades of green). At the top center, Venn diagram representing ASVs
418 present at 0 hr showing the 444 were shared between species before
419 the stranding simulation. Side Venns show the changes in ASVs in all
420 3 sampling times per species and, in the center, there are the ASVs
421 that persisted throughout the stranding simulation. Among the
422 persistent ASVs, 30 were commonly identified in both Sf III and Sn
423 VIII simulations. The bottom Venn shows the total 2,005 ASVs
424 recovered, 628 were identified in both Sargassum species at some
425 point during the stranding simulation
19426
427 Despite drastic changes in richness and diversity, persistent
428 ASVs were identified throughout the stranding simulation of Sf III (52
429 ASVs) and Sn VIII (112 ASVs) (Fig. 4, center). Among the persistent
430 ASVs, 30 were commonly identified in both Sn VIII and Sf III during
431 the stranding simulation, and those ASVs belonged to orders
432 Vibrionales (5), Microtrichales (5), Verrucomicrobiales (3),
433 Alteromonadales (2), Rhizobiales (2), Rhodobacteriales (2),
434 Propionibacteriales (1), Bacillales (1), Pirellulales (1),
435 Sphingomonadales (1). Other persistent ASVs had identification
436 limited to the taxonomic level of class Alphaproteobacteria (2),
437 Bacteroidia (1), Gammaproteobacteria (2), and phyla Actinobacteria
438 (1) and Firmicutes (1). Among the persistent ASVs, some were present
20439 in low abundance at 0 hr as the case of Vibrio sp. and Alteromonas sp.
440 (Fig. 5a Vibrionales and Alteromonadales) and the abundance
441 increase after exposure to air from less than 300 reads to more than
442 5000 reads on average. On the other hand, Sva0996 and an
443 unidentified Firmicutes reduced abundance from more than 2000
444 reads to less than 700 reads on average (Fig. 5a, Microtrichales (5)
445 and Unclassified Firmicutes).
446
447 Fig. 5 Heatmaps – a) abundance of the 30 persistent ASVs identified
448 at order level. Numbers within parenthesis indicate different ASVs
449 belonging to a same order. b) Percentage (%) of each putative
450 functional group identified among all taxonomic identification
451
452 Functional Annotation of Prokaryotic Taxa (FAPROTAX)
453 identified representatives of 28 functional groups (Fig. 5b). Members
21454 of a taxonomic group can be classified in different functional groups,
455 and that was the case for 24 cyanobacteria assigned to 4 functional
456 groups (phototrophy, photosynthetic cyanobacteria, photoautotrophy
457 and oxygenic photoautotrophy). These 24 cyanobacteria were
458 common at 0 hr, but rarely identified after the stranding simulation
459 started. The chemoheterotrophic taxa present at 0 hr such as Vibrio
460 sp., Alteromonas sp. and Pseudoalteromanas sp. increased in
461 abundance during the stranding simulation, for that reason, various
462 chemoheterotrophic ASVs were also identified as within the 30
463 persistent ASVs. Lastly, fermentation and nitrate reduction functional
464 groups comprised 21 and 9 reported taxa respectively, however only
465 2 were abundant, Vibrio sp. and Vibrio sp. hMe-34 (GenBank:
466 JX411932.1), both also included in the chemoheterotrophic functional
467 groups. The remaining 20 functional groups had less than 7 taxa
468 records and abundance below 3%.
469
470 Discussion
471 This study characterized the changes in the microbial
472 community associated with holopelagic Sargassum species Sf III and
473 Sn VIII under a simulated stranding event. Our results showed that
474 the stranding simulation caused dysbioses of the microbial community
475 of Sf III and Sn VIII in just 24 hrs of exposure to air conditions. The
476 major outcome for both species was a drop in diversity of bacterial
477 orders and a shift of dominant and functional groups. The results were
478 similar between Sf III and Sn VIII even though they were collected
22479 approximatelly 12o of longitude apart and experiments were done 10
480 days apart.
481 The changes in community structure and composition during the
482 stranding simulation indicates that each Sargassum species retains a
483 different microbial community after stranding. Many microorganisms
484 identified at time 0 hr disappeared or had a drastic reduction in
485 abundance after stranding, except Vibrionales, Alteromonadales, and
486 Oceanospirilalles whose relative abundances increased. Vibrio quickly
487 became the dominant genus during our stranding simulation after just
488 24 hrs, which might indicate active alginate degradation during the
489 first days of stranding. The temperature at the site was also ideal for
490 Vibrio proliferation, known to grow in higher sea surface
491 temperatures up to 40 °C [42, 43]. Eventhoug we can not reach
492 species level using V3-V4 16S rRNA, potential pathogenic strains of
493 Vibrio were previously reported associated with holopelagic
494 Sargassum [16, 17, 19]. A more recent study has sequenced the
495 genome of 16 Vibrio spp. isolated from Sargasso Sea substrates
496 (Sargassum sp., leptocephalus eel larvae and plastic marine debris)
497 and the genomes were closely related to phatovars V. alginolyticus, V.
498 campbellii, V. fortis, and V. parahaemolyticus [18]. Nontheless, they
499 also identifieid pathogenic genes including adhesion, toxin, hemolysis
500 and phospholipases, all together these genes make Vibrio a potent
501 opportunistic pathogens. Furthermor, all 16 isolates had alginate
502 lyase genes, enhancig the probability of using Sargassum as a source
503 of carbon. We agree with Mincer et al. [18] that it is necessary to
23504 exercet a through investigation of Vibrio at stranding sites to ascertain
505 if there is an increase in Vibrio as we identified in our study, and also
506 determine their potential pathogenicity. This is very impotante giving
507 the intention of harvesting stranded Sargassum biomass in a scenario
508 of climate change, where seems to be increasing reports of Vibrio-
509 related illnesses [21, 44, 45].
510 Not only Vibrionales, but also Alteromonadales is known for its
511 pathogenic genera such as Pseudoalteromonas and Alteromonas [46,
512 47] and it also drastically increased in abundance during the stranding
513 simulation. Stranded Sargassum starts to decompose and looses its
514 defense mechanisms against bacteria, and therefore, it becomes a
515 source of carbon to certain opportunistic and fast-growing bacterial
516 strains such as the above mentioned. Once the source of carbon is
517 depleted, it is possible that the abundance of Vibrionales and
518 Alteromonadales will decrease, however until then, Sargassum is a
519 fertile ground for potentially pathogenic bacteria and this study raises
520 the need to investigate the microbiome at stranding sites to assess the
521 risk of pathogenic bacteria being introduced and/or enriched in
522 coastal areas.
523 A previous study by Hervé et al. [19] collected nine samples from
524 four inland Sargassum storage sites in Martinique to describe its
525 microbiome. They reported that samples were taken both from the top,
526 as well as the middle of Sargassum piles, therefore the material was
527 partially or completely dried making the separation of morphotypes
528 difficult, and also making aging of the Sargassum impossible. Our
24529 work controled some variables such as morphotypes, aging and
530 coastal influences (sand, freshwater discharge and human activities
531 associated microbes), therefore, our results provide a baseline of
532 Sargassum associated microbiome with minimun external
533 interference, except from open ocean airborn and sea spray
534 microbiome [48].
535 Hervé et al. [19] reported dominace of Flavobateriales in their
536 results, a group that only started to show some minor increase after
537 48 hours in our experiment. Our experiment showed dominance of
538 Vibrionales after 24 hours, and it is interesting to point out that the
539 same order dominated a mix of Sargassum samples collected in the
540 water near shore (n = 30) and samples stranded on the beach (n = 9),
541 however in lower proportion (18% in Hervé et al. [19] results and
542 higher than 60% in our results). The functional groups showed a
543 similar pattern with phototrophy and chemoheterotrophy dominating
544 in fresh Sargassum. Phototrophic individuals were less representative
545 after 24 hrs of stranding simulation, as well as in inland storage of
546 Sargassum biomass in Martinique, probably due to diminshing light
547 penetration in the interior of the pile and desiccation.
548 Among the chemoheterotrophic lineages, we identified
549 Verrucomicrobiales, known producers of enzymes degrading
550 fucoidans [49]. Fucoidans are common brown algal cell wall
551 polysaccharides with bioactive effects shown to have therapeutic, anti-
552 inflammatory, and anticoagulant properties [50]. In our study,
553 Verrucomicrobiales decreased in relative abundance when the
25554 stranding simulation began, but was still detected at the end of the
555 experiment. The Verrucomicrobiales remaining after 48 hrs of our
556 stranding simulation, tolerant to drying conditions, could be an option
557 for Sargassum fucoidan degradation.
558 Not only fucoidans but also bacterial fermenting alginates are of
559 growing interest to produce low molecular weight prebiotics [51] and
560 third generation bioethanol [52]. Some target bacteria for alginate
561 degradation are Pantaea [53], Bacteroides [54], and various marine
562 Vibrio spp. [55–57]. Even though we have not identified Pantaea and
563 Bacteroides among the sequences generated, we do have Vibrio and
564 Alteromonadales as the main fermentation representatives that
565 demonstrate a drastic increase in abundance once the Sargassum is
566 stranded. One concern related to Sargassum degradation is the
567 production of hydrogen sulfide, which is a toxic gas [58], but we have
568 not identified any functional group related strickly to the sulfur cycle,
569 indicating that the bacteria associated with such processes are likely
570 found in coastal waters, and not associated with Sargassum from the
571 open ocean. This evidence is supported by Hervé et al. [19] with the
572 identification of sulfur-respiring microorganisms in nearshore water
573 samples, as well as in stranded Sargassum.
574 Contrary to expectations, the richness of ASVs associated with
575 Sn VIII increased after 48 hrs of exposure to air, driven by 385 ASVs
576 that appeared only in the 48 hrs samples. The effects of richness
577 increase is easily visible at the PCoA plot (Fig. 3), where 48 hr samples
578 clustered between 0 and 24 hr. It is important to point out that these
26579 exclusive Sn VIII 48 hrs ASVs were at low abundance. Therefore, this
580 increase in richness could have originated from airborne microbiota
581 introduced with the rain that occurred after 24 hrs. Another possibility
582 is rare taxa, previously below detection limits, responded to new
583 environmental conditions such as higher temperatures, abundance of
584 substrate, and reduction of competition due to the dysbioses.
585 Associated epifauna could introduce another source of variability, if
586 Sn VIII and Sf III were encrusted by different species and quantities
587 of hydrozoans and bryozoans for example [15, 59] that harbour their
588 own microbiomes. Even though most of the associated fauna was
589 manually removed, any remaining faunal microbiomes would have
590 been sequenced. In summary, richness increase could have been
591 caused by variation within the Sargassum clumps, and our sampling
592 design did not allow for the identification of the variation source.
593 The microbial community before the beginnng of the simulation,
594 at 0 hr, was dominanted by Proteobacteria, Actinobacteria,
595 Bacteroidetes, Cyanobacteria, and Firmicutes in both species of
596 Sargassum. Similar phylum compositions were identified in
597 holopelagic Sargassum spp. collected in 2018 in stranding sites at the
598 Caribbean Islands [19], open ocean collected in 2017 and 2019 [16,
599 17] and in the Gulf of Mexico in 2010 [20]. This dominance also
600 happened in benthic Sargassum muticum sampled on Portugal [60]
601 and S. hystrix and S. furcatum sampled on Martinique Island. When
602 comparing at order level between Sf III and Sn VIII at time 0, there
27603 are not a lot of differences in composition. Therefore, Sargassum
604 species habour similar microbial orders.
605 Aside from the shared microbial characteristics at the order
606 level, Sf III and Sn VIII do not share about 70% of all ASVs identified
607 previous to any manipulation (0 hr). The Sargassum species were not
608 collected at the same site (a distance of 12° of longitude), so that could
609 account for some of the inter-species differences we observed.
610 Previous studies have reported species, morphology and biogeography
611 as sources of microbial variations in holopelagic Sargassum species
612 [16, 17, 61]. However it is unlikely that the environmental water
613 column microbiome itself could affect our results, since water and
614 macroalgal microbiomes are shown to differ greatly [16, 22, 62]. Other
615 less explored sources of microbial variation could be related to
616 Sargassum’s algae-bacteria symbiotic relationships. Algae and
617 bacteria are known to influence each other, where some bacteria
618 produce bioactive compounds essential for algal physiology,
619 morphogenesis and growth [63, 64]. In addition, morphologically
620 different structures from the same alga can harbor unique strains of
621 bacteria [60, 62]. Giving the particulars of algal-bacterial interactions,
622 it is not surprising to identify unique ASVs associated with different
623 species of Sargassum.
624
625 Conclusion
626 Our study presents a baseline of the microbial composition in
627 decaying Sargassum before it hits the coastal areas, with minimum
28628 external influences. The stranding simulation caused microbiome
629 dysbiosis, with reduction of richness in the first 24 hrs and drastic
630 changes in the dominant bacterial groups. We hypothesize that the
631 changes in dominance is caused by the biomass-degrading capacity
632 and resistance to the new set of environmental conditions of these
633 bacterial groups (e.g. Verrucomicrobiales, Vibrionales,
634 Altermonodales). The large accumulations of Sargassum stranding
635 around the equatorial coasts may be introducing pathogenic bacteria
636 belonging to Vibrionales, and Alteromonadales, which might
637 represent an additional risk to human and animal health. Our
638 exploratory results emphasize the urgent need of stranding events
639 monitoring in coastal regions to verify if such groups will dominate,
640 not only because Sargassum may be introducing bacterial lineages to
641 the coast, but also because it can serve as a fertile substrate for
642 existing pathogens, representing a risk to the coastal ecosystem
643 equilibrium, as well as to human health.
644
645 References
646 1. Guiry MD, Guiry G. (2021) AlgaeBase. World-wide electronic
647 publication, National University of Ireland, Galway.
648 https://www.algaebase.org. Accessed 12 Apr 2023
649 2. Coston-Clements L, Center LR, Hoss DE, Cross FA (1991)
650 Utilization of the Sargassum habitat by marine invertebrates
651 and vertebrates: a review. NOAA Technical Memorandum
652 NMFS-SEFSC-296, p 32
29653 3. Laffoley D d’A., Roe HSJ, Angel MV, et al (2011) The protection
654 and management of the Sargasso Sea: The golden floating
655 rainforest of the Atlantic Ocean. Summary Science and
656 Supporting Evidence Case. Sargasso Sea Alliance, p 44
657 4. Godínez-Ortega JL, Cuatlán-Cortés J V., López-Bautista JM, van
658 Tussenbroek BI (2021) A natural history of floating Sargassum
659 species (Sargasso) from Mexico. In: Hufnagel L (ed) Natural
660 history and ecology of Mexico and Central America.
661 IntechOpen, London, p 35
662 5. van Tussenbroek BI, Hernández Arana HA, Rodríguez-Martínez
663 RE, et al (2017) Severe impacts of brown tides caused by
664 Sargassum spp. on near-shore Caribbean seagrass
665 communities. Mar Pollut Bull 122:272–281.
666 https://doi.org/10.1016/j.marpolbul.2017.06.057
667 6. Széchy MTM, Guedes PM, Baeta-Neves MH, Oliveira EN (2012)
668 Verification of Sargassum natans (Linnaeus) Gaillon
669 (Heterokontophyta: Phaeophyceae) from the Sargasso Sea off
670 the coast of Brazil, western Atlantic Ocean. Check List 8:638–
671 641
672 7. Milledge JJ, Harvey PJ (2016) Golden Tides: Problem or golden
673 opportunity? The valorisation of Sargassum from beach
674 inundations. J Mar Sci Eng 4:1–11.
675 https://doi.org/10.3390/jmse4030060
676 8. Franks JS, Johnson DR, Ko D-S, et al (2011) Unprecedented
677 influx of pelagic Sargassum along Caribbean Island coastlines
30678 during summer 2011. In: Proceedings of the 64th Gulf and
679 Caribbean Fisheries Institute, pp 6–8
680 9. Johnson DR, Ko DS, Franks JS, et al (2012) The Sargassum
681 invasion of the Eastern Caribbean and dynamics of the
682 Equatorial North Atlantic. In: Proceedings of the 65th Gulf and
683 Caribbean Fisheries Institute, pp 101–103
684 10. Wang M, Hu C, Barnes BB, et al (2019) The great Atlantic
685 Sargassum belt. Science 365:83–87.
686 https://doi.org/10.1126/science.aaw7912
687 11. Johns EM, Lumpkin R, Putman NF, et al (2020) The
688 establishment of a pelagic Sargassum population in the tropical
689 Atlantic: Biological consequences of a basin-scale long distance
690 dispersal event. Prog Oceanogr 182:102269.
691 https://doi.org/10.1016/j.pocean.2020.102269
692 12. Oviatt CA, Huizenga K, Rogers CS, Miller WJ (2019) What
693 nutrient sources support anomalous growth and the recent
694 sargassum mass stranding on Caribbean beaches? A review.
695 Mar Pollut Bull 145:517–525.
696 https://doi.org/10.1016/j.marpolbul.2019.06.049
697 13. Rodríguez-Martínez RE, Medina-Valmaseda AE, Blanchon P, et
698 al (2019) Faunal mortality associated with massive beaching
699 and decomposition of pelagic Sargassum. Mar Pollut Bull
700 146:201–205. https://doi.org/10.1016/j.marpolbul.2019.06.015
701 14. Resiere D, Valentino R, Nevière R, et al (2018) Sargassum
702 seaweed on Caribbean islands: an international public health
31703 concern. Lancet 392:2691
704 15. Salter MA, Rodríguez-Martínez RE, Álvarez-Filip L, et al (2020)
705 Pelagic Sargassum as an emerging vector of high rate
706 carbonate sediment import to tropical Atlantic coastlines. Glob
707 Planet Change 195:1–11.
708 https://doi.org/10.1016/j.gloplacha.2020.103332
709 16. Michotey V, Blanfuné A, Chevalier C, et al (2020) In situ
710 observations and modelling revealed environmental factors
711 favouring occurrence of Vibrio in microbiome of the pelagic
712 Sargassum responsible for strandings. Sci Total Environ
713 748:141216. https://doi.org/10.1016/j.scitotenv.2020.141216
714 17. Theirlynck T, Mendonça IRW, Engelen AH, et al (2023)
715 Diversity of the holopelagic Sargassum microbiome from the
716 Great Atlantic Sargassum Belt to coastal stranding locations.
717 Harmful Algae 122:1–13.
718 https://doi.org/10.1016/j.hal.2022.102369
719 18. Mincer TJ, Bos RP, Zettler ER, et al (2023) Sargasso Sea Vibrio
720 bacteria : underexplored potential pathovars in a perturbed
721 habitat. Water Res 120033.
722 https://doi.org/10.1016/j.watres.2023.120033
723 19. Hervé V, Lambourdière J, René-Trouillefou M, et al (2021)
724 Sargassum differentially shapes the microbiota composition and
725 diversity at coastal tide sites and inland storage sites on
726 Caribbean Islands. Front Microbiol 12:1–14.
727 https://doi.org/10.3389/fmicb.2021.701155
32728 20. Torralba MG, Franks JS, Gomez A, et al (2017) Effect of
729 Macondo Prospect 252 Oil on microbiota associated with
730 pelagic Sargassum in the Northern Gulf of Mexico. Microb Ecol
731 73:91–100. https://doi.org/10.1007/s00248-016-0857-y
732 21. Vezzulli L, Colwell RR, Pruzzo C (2013) Ocean warming and
733 spread of pathogenic Vibrios in the aquatic environment.
734 Microb Ecol 65:817–825. https://doi.org/10.1007/s00248-012-
735 0163-2
736 22. Minich JJ, Morris MM, Brown M, et al (2018) Elevated
737 temperature drives kelp microbiome dysbiosis, while elevated
738 carbon dioxide induces water microbiome disruption. PLoS One
739 13:1–23. https://doi.org/10.1371/journal.pone.0192772
740 23. Sissini MN, Barreto MBB de B, Széchy MTM, et al (2017) The
741 floating Sargassum (Phaeophyceae) of the South Atlantic Ocean
742 – likely scenarios. Phycologia 56:321–328.
743 https://doi.org/10.2216/16-92.1
744 24. Wessel P, Smith WHF (1996) A global, self-consistent,
745 hierarchical, high-resolution shoreline database. J Geophys Res
746 101:B4. https://www.ngdc.noaa.gov/mgg/shorelines/. Accessed
747 10 Oct 2021
748 25. Parr AE (1939) Quantitative observations on the pelagic
749 Sargassum vegetation of the western North Atlantic. Peabody
750 Museum of Natural History, Yale University, New Haven
751 26. Winge Ø (1923) The Sargasso Sea, its boundaries and
752 vegetation. Report on the danish oceanographical expeditions
33753 1908-10 to the Mediterranean and adjacent seas. Miscellaneous
754 Papers 3:34
755 27. Amaral-Zettler LA, Dragone NB, Schell J, et al (2017)
756 Comparative mitochondrial and chloroplast genomics of a
757 genetically distinct form of Sargassum contributing to recent
758 “Golden Tides” in the Western Atlantic. Ecol Evol 7:516–525.
759 https://doi.org/10.1002/ece3.2630
760 28. Quigley CTC, Morrison HG, Mendonça IR, Brawley SH (2018) A
761 common garden experiment with Porphyra umbilicalis
762 (Rhodophyta) evaluates methods to study spatial differences in
763 the macroalgal microbiome. J Phycol 54:653–664.
764 https://doi.org/10.1111/jpy.12763
765 29. Caporaso JG, Ackermann G, Apprill A, et al (2018) EMP 16S
766 Illumina Amplicon Protocol.
767 https://dx.doi.org/10.17504/protocols.io.nuudeww
768 30. Bolyen E, Rideout JR, Dillon MR, et al (2019) Reproducible,
769 interactive, scalable and extensible microbiome data science
770 using QIIME 2. Nat Biotechnol 37:852–857.
771 https://doi.org/10.1038/s41587-019-0209-9
772 31. Callahan BJ, McMurdie PJ, Holmes SP (2017) Exact sequence
773 variants should replace operational taxonomic units in marker-
774 gene data analysis. ISME J 11:2639–2643.
775 https://doi.org/10.1038/ismej.2017.119
776 32. Callahan BJ, McMurdie PJ, Rosen MJ, et al (2016) DADA2: High
777 resolution sample inference from Illumina amplicon data. Nat
34778 Methods 13:581–583. https://doi.org/10.1038/s41395-018-0061-
779 4.
780 33. Quast C, Pruesse E, Yilmaz P, et al (2013) The SILVA ribosomal
781 RNA gene database project: Improved data processing and web-
782 based tools. Nucleic Acids Res 41:590–596.
783 https://doi.org/10.1093/nar/gks1219
784 34. Bokulich NA, Kaehler BD, Rideout JR, et al (2018) Optimizing
785 taxonomic classification of marker-gene amplicon sequences
786 with QIIME 2’s q2-feature-classifier plugin. Microbiome 6:1–17.
787 https://doi.org/10.1186/s40168-018-0470-z
788 35. Pedregosa F, Varoquaux G, Gramfort A, et al (2011) Scikit-
789 learn: Machine learning in Python. J Mach Learn Res 12:2825–
790 2830
791 36. Louca S, Parfrey LW, Doebeli M (2016) Decoupling function and
792 taxonomy in the global ocean microbiome. Science 353:1272–
793 1277
794 37. Hadley W (2016) ggplot2. https://ggplot2.tidyverse.org
795 38. R Core Team (2021) R: A language and environment for
796 statistical computing. https://www.r-project.org/
797 39. Sandrini-Neto L, Camargo MG (2020) GAD: An R package for
798 ANOVA desings from general principles. https://cran.r-
799 project.org/package=GAD
800 40. Chen H (2018) VennDiagram: Generate High-Resolution Venn
801 and Euler Plots. https://cran.r-
802 project.org/package=VennDiagram
35803 41. Oksanen AJ, Blanchet FG, Friendly M, et al (2012) vegan:
804 Community Ecology Package. https://cran.r-
805 project.org/package=vegan
806 42. Oliver JD, Pruzzo C, Vezzulli L, Kaper JB (2012) Vibrio species.
807 In: Doyle MP, Buchanan RL (eds) Food Microbiology:
808 Fundamentals and Frontiers, 4th ed. ASM Press, pp 401–439
809 43. Percival SL, Williams DW (2013) Vibrio. In: Percival SL, Yates
810 M V., Williams DW, et al (eds) Microbiology of waterborne
811 diseases: microbiological aspects and risks, 2nd. Academic
812 Press, pp 237–248
813 44. Deeb R, Tufford D, Scott GI, et al (2018) Impact of climate
814 change on Vibrio vulnificus abundance and exposure risk.
815 Estuaries and Coasts 41:2289–2303.
816 https://doi.org/10.1007/s12237-018-0424-5.Impact
817 45. Baker-Austin C, Oliver JD, Alam M, et al (2018) Vibrio spp.
818 infections. Nat Rev Dis Prim 4:1–19.
819 https://doi.org/10.1038/s41572-018-0005-8
820 46. Sawabe T, Tanaka R, Iqbal MM, et al (2000) Assignment of
821 Alteromonas elyakovii KMM 162T and five strains isolated from
822 spot-wounded fronds of Laminaria japonica to
823 Pseudoalteromonas elyakovii comb. nov. and the extended
824 description of the species. Int J Syst Evol Microbiol 50:265–271
825 47. Wang G, Shuai L, Li Y, et al (2008) Phylogenetic analysis of
826 epiphytic marine bacteria on Hole-Rotten diseased sporophytes
827 of Laminaria japonica. J Appl Phycol 20:403–409.
36828 https://doi.org/10.1007/s10811-007-9274-4
829 48. Uetake J, Hill TCJ, Moore KA, et al (2020) Airborne bacteria
830 confirm the pristine nature of the Southern Ocean boundary
831 layer. Proc Natl Acad Sci U S A 117:13275–13282.
832 https://doi.org/10.1073/pnas.2000134117
833 49. Sichert A, Corzett CH, Schechter MS, et al (2020)
834 Verrucomicrobia use hundreds of enzymes to digest the algal
835 polysaccharide fucoidan. Nat Microbiol 5:1026–1039.
836 https://doi.org/10.1038/s41564-020-0720-2
837 50. Ale MT, Meyer AS (2013) Fucoidans from brown seaweeds: An
838 update on structures, extraction techniques and use of enzymes
839 as tools for structural elucidation. RSC Adv 3:8131–8141.
840 https://doi.org/10.1039/c3ra23373a
841 51. Ramnani P, Chitarrari R, Tuohy K, et al (2012) In vitro
842 fermentation and prebiotic potential of novel low molecular
843 weight polysaccharides derived from agar and alginate
844 seaweeds. Anaerobe 18:1–6.
845 https://doi.org/10.1016/j.anaerobe.2011.08.003
846 52. Takeda H, Yoneyama F, Kawai S, et al (2011) Bioethanol
847 production from marine biomass alginate by metabolically
848 engineered bacteria. Energy Environ Sci 4:2575–2581.
849 https://doi.org/10.1039/c1ee01236c
850 53. Zhang W, Zhang J (2018) The alginate fermentation strain
851 Pantoea sp. F16-PCAi-T3P21 and ethanol production. Energy
852 Sources, Part A: Recovery, Utilization and Environmental
37853 Effects 40:394–399.
854 https://doi.org/10.1080/15567036.2013.844213
855 54. Li M, Li G, Shang Q, et al (2016) In vitro fermentation of
856 alginate and its derivatives by human gut microbiota. Anaerobe
857 39:19–25. https://doi.org/10.1016/j.anaerobe.2016.02.003
858 55. Doi H, Tokura Y, Mori Y, et al (2017) Identification of enzymes
859 responsible for extracellular alginate depolymerization and
860 alginate metabolism in Vibrio algivorus. Appl Microbiol
861 Biotechnol 101:1581–1592. https://doi.org/10.1007/s00253-016-
862 8021-7
863 56. Zhuang J, Zhang K, Liu X, et al (2018) Characterization of a
864 novel polyM-preferred alginate lyase from marine Vibrio
865 splendidus OU02. Mar Drugs 16:1–12.
866 https://doi.org/10.3390/md16090295
867 57. Wargacki AJ, Leonard E, Win MN, et al (2012) An engineered
868 microbial platform for direct biofuel production from brown
869 macroalgae. Science 335:308–313
870 58. Thompson TM, Young BR, Baroutian S (2020) Pelagic
871 Sargassum for energy and fertiliser production in the
872 Caribbean: A case study on Barbados. Renew Sustain Energy
873 Rev 118:109564. https://doi.org/10.1016/j.rser.2019.109564
874 59. Mendoza-Becerril MA, Serviere-Zaragoza E, Mazariegos-
875 Villarreal A, et al (2020) Epibiont hydroids on beachcast
876 Sargassum in the Mexican Caribbean. PeerJ 8:1–21.
877 https://doi.org/10.7717/peerj.9795
38878 60. Serebryakova A, Aires T, Viard F, et al (2018) Summer shifts of
879 bacterial communities associated with the invasive brown
880 seaweed Sargassum muticum are location and tissue
881 dependent. PLoS One 13:1–18.
882 https://doi.org/10.1371/journal.pone.0206734
883 61. Li H, Li J, Gao T, et al (2022) The influence of host specificity
884 and temperature on bacterial communities associated with
885 Sargassum (Phaeophyceae) species. J Phycol 58:815–828.
886 https://doi.org/10.1111/jpy.13293
887 62. Quigley CTC, Capistrant-Fossa KA, Morrison HG, et al (2020)
888 Bacterial communities show algal host (Fucus spp.)/Zone
889 differentiation across the stress gradient of the intertidal zone.
890 Front Microbiol 11:1–19.
891 https://doi.org/10.3389/fmicb.2020.563118
892 63. Helliwell KE, Pandhal J, Cooper MB, et al (2018) Quantitative
893 proteomics of a B12-dependent alga grown in coculture with
894 bacteria reveals metabolic tradeoffs required for mutualism.
895 New Phytol 217:599–612. https://doi.org/10.1111/nph.14832
896 64. Tapia JE, González B, Goulitquer S, et al (2016) Microbiota
897 influences morphology and reproduction of the brown alga
898 Ectocarpus sp. Front Microbiol 7:1–14.
899 https://doi.org/10.3389/fmicb.2016.00197
900
901 Statements and Declarations
902 Funding
39903 This study was funded by grants from FAPESP (I.R.W.M.
904 scholarship 2018/17843-4; M.C.O. Biota research project
905 2020/09406-3); CNPq (M.C.O. 305687/2018-2); partially by CAPES
906 (Finance Code 001).
907
908 Competing interests
909 The authors declare that they have no relevant financial or non-
910 financial competing interests to report.
911
912 Availability of data and material
913 Raw 16S rRNA sequence data will be available on the NCBI
914 Sequence Read Archive (SRA-NCBI) under bio project accession ___.
915
916 Authors' contributions
917 Based on CRediT author contribution statement
918
919 Inara R. W. Mendonça: Conceptualization, Data Curation, Formal
920 Analysis, Investigation, Methodology, Visualization, Writing – Original
921 Draft Preparation.
922
923 Tom Theirlynck: Investigation, Writing – Review & Editing.
924
925 Erik R. Zettler: Conceptualization, Investigation, Methodology,
926 Writing – Review & Editing.
927
40You can also read