Mechanical power normalized to lung thorax compliance indicates weaning readiness in prolonged ventilated patients
←
→
Page content transcription
If your browser does not render page correctly, please read the page content below
www.nature.com/scientificreports
OPEN Mechanical power normalized
to lung‑thorax compliance
indicates weaning readiness
in prolonged ventilated patients
Alessandro Ghiani 1*, Joanna Paderewska1, Swenja Walcher1, Konstantinos Tsitouras1,
Claus Neurohr1,3 & Nikolaus Kneidinger2,3
Since critical respiratory muscle workload is a significant determinant of weaning failure, applied
mechanical power (MP) during artificial ventilation may serve for readiness testing before proceeding
on a spontaneous breathing trial (SBT). Secondary analysis of a prospective, observational study
in 130 prolonged ventilated, tracheotomized patients. Calculated MP’s predictive SBT outcome
performance was determined using the area under receiver operating characteristic curve (AUROC),
measures derived from k-fold cross-validation (likelihood ratios, Matthew’s correlation coefficient
[MCC]), and a multivariable binary logistic regression model. Thirty (23.1%) patients failed the SBT,
with absolute MP presenting poor discriminatory ability (MCC 0.26; AUROC 0.68, 95%CI [0.59‒0.75],
p = 0.002), considerably improved when normalized to lung-thorax compliance (LTCdyn-MP, MCC
0.37; AUROC 0.76, 95%CI [0.68‒0.83], p < 0.001) and mechanical ventilation PaCO2 (so-called
power index of the respiratory system [PIrs]: MCC 0.42; AUROC 0.81 [0.73‒0.87], p < 0.001). In the
logistic regression analysis, PIrs (OR 1.48 per 1000 cmH2O2/min, 95%CI [1.24‒1.76], p < 0.001) and its
components LTCdyn-MP (1.25 per 1000 cmH2O2/min, [1.06‒1.46], p < 0.001) and mechanical ventilation
PaCO2 (1.17 [1.06‒1.28], p < 0.001) were independently related to SBT failure. MP normalized to
respiratory system compliance may help identify prolonged mechanically ventilated patients ready for
spontaneous breathing.
Mechanical ventilation, the core characteristic of intensive care, is a life-saving procedure for patients present-
ing severe respiratory failure. However, since prolonged ventilation is associated with increased morbidity and
mortality1,2, liberation from the ventilator should begin as early as possible. A two-step strategy towards extuba-
tion, involving readiness testing and subsequent spontaneous breathing trials (SBT), has been shown to reduce
the length of ventilation and costs of medical care in the ICU3.
So far, apart from clinical factors (e. g., evidence of clinical improvement, P/F ratio, adequate hemodynamics),
several prediction variables (e.g., maximum inspiratory pressure, tidal volume, or minute ventilation) have been
assessed in a one-time measurement for readiness testing4–6, with most of these traditional weaning predictors
used to distinguish between patients who can or cannot sustain a trial of spontaneous breathing usually deter-
mined after a short period of self-ventilation following disconnection from the ventilator4. Serial measurement
of esophageal pressure at the beginning of the SBT, reflecting patients’ respiratory effort and breathing work, has
improved further diagnostic accuracy in predicting weaning f ailure7, most probably because it reflects the under-
lying pathophysiology, namely an imbalance between respiratory impedance and neuromuscular capacity8,9.
However, esophageal pressure measurement for assessment of patients’ work of breathing, due to its complex-
ity, is rarely used in daily routine. Moreover, not total power output (pressure times volume per time unit) but
critical stress imposed on respiratory muscles (e. g. expressed as pressure–time product or tension-time index
of the diaphragm) seems to be the major determinant of weaning failure8,10.
1
Lung Center Stuttgart – Schillerhoehe Lung Clinic (Affiliated to the Robert‑Bosch‑Hospital GmbH,
Stuttgart), Department of Pulmonology and Respiratory Medicine, Solitudestrasse 18, 70839 Gerlingen,
Germany. 2Department of Internal Medicine V, Ludwig-Maximilians-University (LMU) of Munich, Munich,
Germany. 3Comprehensive Pneumology Center (CPC-M), Member of the German Center for Lung Research (DZL),
Munich, Germany. *email: alessandro.ghiani@rbk.de
Scientific Reports | (2022) 12:6 | https://doi.org/10.1038/s41598-021-03960-y 1
Vol.:(0123456789)www.nature.com/scientificreports/
Figure 1. Study flow. Abbreviations: NMD, neuromuscular disease; F iO2, fractional inspired oxygen; PEEP,
positive end-expiratory pressure; MV, mechanical ventilation; ABG, arterial blood gas analysis; MP, mechanical
power; SBT, spontaneous breathing trial; RR, respiratory rate; HR, heart rate.
Mechanical power (MP) of artificial ventilation, the energy transferred to the respiratory system per time
unit, is a chief determinant of adequate gas exchange. Basically, the MP concept was introduced to shed further
light on the underlying mechanisms behind ventilator-induced lung injury, as it unifies all ventilatory variables
deemed responsible11. However, MP may also indicate respiratory muscle workload during spontaneous breath-
ing, contributing significantly to weaning f ailure7–9. Accordingly, in a retrospective analysis, mechanical power
normalized to lung-thorax compliance, a surrogate of applied power per unit of ventilated lung volume (con-
sistent with stress intensity), was independently associated with the outcome of a spontaneous breathing t rial12.
In this analysis, we evaluated the discriminatory performance of mechanical power in predicting the outcome
of a short weaning trial and thus indicate weaning readiness.
Methods
Secondary analysis of a previously reported prospective observational cohort study conducted at a specialized
weaning center that focused on predictors of prolonged ventilation weaning failure13. The study was performed
following the Declaration of Helsinki and approved by the local institutional review board for human studies
(Ethics Committee of the State Chamber of Physicians of Baden-Wuerttemberg, Germany, file number F-2018-
116). All patients or a legal representative gave their written informed consent to participate. We now report MP
as a candidate predictor of the first spontaneous breathing trial upon patient admission to our center.
Patient selection. Only tracheotomized patients referred for prolonged weaning, classified as Category 3
defined by Boles and co-workers14, were analyzed. Patients were excluded from the study if they had a diagnosis
of neuromuscular disease, died before weaning completion, or declined consent (Fig. 1).
Spontaneous breathing trials. All patients were ventilated in the pressure-controlled, assist-control
(A/C) mode (Vivo 50 & 60, Breas Medical AB, Moelnlycke, Sweden). The main characteristic of this ventila-
tion mode is that the same (high) pressure is applied during both an assisted and controlled breath, consistent
with full ventilator support intending to defend alveolar ventilation and minimizing respiratory muscle activity,
thereby recovering from the imposed work of breathing between SBT.
The first SBT upon admission to the weaning center occurred as soon as pre-defined clinical screening crite-
ria for weaning readiness were met, which were (1) adequate oxygenation (SpO2 ≥ 92%) with fractional inspired
oxygen ≤ 0.40 and PEEP ≤ 8 cmH2O, (2) hemodynamic stability without the need for vasopressors or inotropic
agents, and (3) normocapnia (PaCO2 ≤ 45.0 mmHg) on mechanical ventilation. Patients were not sedated when
they underwent the SBT.
In general, the first SBT occurred in the early morning. Patients were placed in the semi-recumbent position
for these trials. A few minutes before SBT started, ventilatory variables were obtained from the ventilators’ display
in a one-time measurement, and an arterial blood gas analysis (ABG) was performed simultaneously. The patient
was then disconnected from the ventilator and breathed room air for 30 min through a T-piece with oxygen
admixture at the same level as during mechanical ventilation. The first SBT was always performed under the
supervision of a respiratory therapist, and vital signs were continuously monitored to detect respiratory distress
immediately. Another ABG was performed at the end of SBT.
Candidate predictors of weaning. The following parameters were calculated from ventilatory vari-
ables and the corresponding arterial blood gas values collected immediately before the first SBT (Fig. 1): ∆Paw
(dynamic driving pressure, defined as Pmax—PEEP in the pressure-controlled ventilation mode), dynamic
lung-thorax compliance (LTCdyn)15, mechanical power11 using the simplified formula proposed by Becher and
colleagues16,17, and ventilatory ratio (VR, a surrogate for dead space ventilation)18.
Total MP was further normalized to (1) the predicted body weight (a surrogate of the total lung capacity of a
healthy individual, PBW-MP)19 and (2) L TCdyn-MP)12. To allow
TCdyn (indicating actual ventilated lung volume, L
comparability between individual respiratory rate and ventilator pressure settings, LTCdyn-MP was ultimately
Scientific Reports | (2022) 12:6 | https://doi.org/10.1038/s41598-021-03960-y 2
Vol:.(1234567890)www.nature.com/scientificreports/
corrected for corresponding mechanical ventilation PaCO2 (simulating isocapnic conditions), called the Power
index of the respiratory system13. Further details can be found in the Supplementary information.
Classification of outcome. Failure of the SBT was defined as the occurrence of objective clinical signs of
respiratory failure (breathing frequency > 35/min, tachycardia > 130 bpm, systolic blood pressure > 160 mmHg,
or SpO2 < 88% despite increasing oxygen admixture) and/or changes in blood gas values consistent with ventila-
tory failure (hypercapnia [PaCO2 > 45.0 mmHg] with or without respiratory acidosis [pH < 7.35])14.
Statistical analysis. Descriptive and frequency statistics were used to summarize patients’ demograph-
ics and baseline characteristics. As appropriate, differences between groups in categorical variables were ana-
lyzed using Chi-square or Fisher’s exact tests. Continuous variables were subjected to the Kolmogorov–Smirnov
normality test for homogeneity of variance. Depending on the statistical distribution, either Student’s t-test or
Mann–Whitney U-test was used to examine differences in these parameters.
Discriminatory weaning outcome ability of the selected variables was assessed through a receiver operating
characteristic (ROC) curve analysis with diagnostic accuracy expressed as area under the ROC curve (AUROC).
Moreover, we conducted a prospective, stratified, 2-times repeated, 2-fold cross-validation20 (Supplementary
Fig. S1, Fig. S2, and Table S1), with the predictive performance of each index expressed as sensitivity, specificity,
positive/negative predictive value, accuracy, positive/negative likelihood ratio, diagnostic odds ratio (DOR), F1
score, and Matthew’s correlation coefficient (MCC).
We also performed a binary logistic regression analysis to derive variables independently associated with
SBT failure from baseline clinical characteristics, comorbidities, and the candidate predictors computed from
the ventilatory variables. Variables considered a priori clinically relevant, and variables with a p value less than
0.2 in the bivariate analysis were included in the multivariable models (using forward selection). The model’s
goodness-of-fit was evaluated with the Hosmer & Lemeshow test and Nagelkerke R2. We reported odds ratios
(OR) with 95% confidence intervals (95%CI).
Finally, Pearson’s r was used to correlate the index tests with SBT duration and PaCO2 at the end of the wean-
ing trial.
All tests were two-tailed; statistical significance was indicated by p < 0.05. All analyses were performed using
MedCalc statistical software version 19.2.5 (MedCalc Software Ltd, Ostend, Belgium). Further details on the
statistical methods can be found in the supplementary information.
Ethics approval and consent to participate. The study was approved by the local institutional review
board for human studies (Ethics Committee of the State Chamber of Physicians of Baden-Wuerttemberg, Ger-
many, file number F-2018-116) and performed following the Declaration of Helsinki. Written informed consent
was obtained from all patients or a legal representative.
Consent for publication. Not applicable.
Results
One-hundred and thirty-nine consecutive patients were screened between March 2019 and August 2020, of
whom 130 (93.5%) were included in the study. Nine patients were excluded from the analyses; three had a diag-
nosis of neuromuscular disease, four died before weaning completion, and two declined to participate.
Clinical characteristics differed between patients with successful and failed SBT regarding smoking history,
presence of chronic obstructive pulmonary disease (COPD) and malignancy, and acute exacerbation of COPD
as the primary reason for intubation with mechanical ventilation (Table 1).
Failure of the SBT occurred in 30 patients (23.1%) (Supplementary Table S2), with significant differences
observed in ventilatory variables and MP indices (Table 2).
Patients’ baseline clinical characteristics and outcomes were equally distributed after each randomization for
cross-validation (Supplementary Table S1). Supplementary Table S3 shows the mean threshold values derived
from the training sets that best predicted SBT failure.
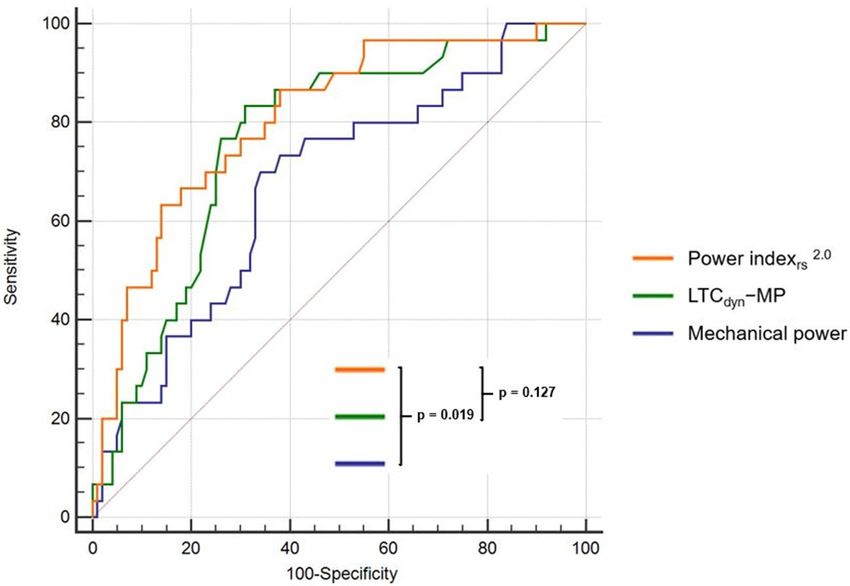
Absolute MP showed poor diagnostic accuracy (MCC 0.26; AUROC 0.68, 95%CI [0.59‒0.75], p = 0.002),
but there was a notable increase in discriminatory performance when MP was normalized to surrogates of lung
volume (LTCdyn-MP: DOR 10.0, MCC 0.37, AUROC 0.76 [95%CI 0.68‒0.83], p < 0.001; PBW-MP: DOR 5.3,
MCC 0.29, AUROC 0.71 [0.62‒0.79], p < 0.001), further improved by correction for corresponding mechanical
ventilation PaCO2 (Power i ndexrs: DOR 8.6, MCC 0.42, AUROC 0.81 [0.73‒0.87], p < 0.001) (Tables 3, 4, Fig. 2).
Most of these indices predominantly showed a higher negative predictive value regarding failure of the SBT.
In the binary logistic regression analysis, the Power index (OR 1.48 per 1000 cmH2O2/min, 95%CI
[1.24‒1.76], p < 0.001) was independently associated with failure of the SBT in univariable, and its compo-
nents LTCdyn-MP (1.25 per 1000 cmH2O2/min, [1.06‒1.46], p < 0.001) and mechanical ventilation PaCO2 (1.17
[1.06‒1.28], p < 0.001) in the multivariable model ( R2 0.293) (Table 5, Supplementary Table S4–S6).
Finally, the Power index2.0 significantly correlated with the duration of SBT (r = − 0.38 [− 0.52 to − 0.22;
p < 0.001]) (Supplementary Table S7) and with PaCO2 at end of the weaning trial (r = 0.57 [0.43‒0.67]; p < 0.001)
(Supplementary Fig. S3).
Scientific Reports | (2022) 12:6 | https://doi.org/10.1038/s41598-021-03960-y 3
Vol.:(0123456789)www.nature.com/scientificreports/
All patients SBT success SBT failure
Clinical characteristics (n = 130) (n = 100) (n = 30) p valuea
Age (years) 69 (60–76) 69 (59–76) 70 (65–72) 0.923c
Gender (male) 82 (63.1) 66 (66.0) 16 (53.3) 0.209d
2
Body mass index (kg/m ) 26.1 (23.0–31.1) 25.5 (22.9–30.9) 28.3 (24.2–33.3) 0.085c
2
Obesity (BMI ≥ 30 kg/m ) 40 (30.8) 28 (28.0) 12 (40.0) 0.213d
Smoking history 48 (36.9) 29 (29.0) 19 (63.3) < 0.001d
APACHE-II (points) 16 (12–19) 16 (12–19) 16 (12–20) 0.772b
Albumin (g/dL) 2.1 (1.8–2.5) 2.1 (1.8–2.5) 2.1 (1.9–2.6) 0.269c
Ventilator days on admission 25 (16–34) 25 (16–33) 27 (16–38) 0.333c
Intubation to tracheostomy (days) 12 (7–18) 12 (7–18) 10 (6–16) 0.445c
ECLA 14 (10.8) 13 (13.0) 1 (3.3) 0.136d
Reason for mechanical ventilation
Pneumonia 51 (39.2) 37 (37.0) 14 (46.7) 0.343d
Surgery 32 (24.6) 28 (28.0) 4 (13.3) 0.103d
Cardiopulmonary resuscitation 10 (7.7) 7 (7.0) 3 (10.0) 0.590d
Acute exacerbation of COPD 10 (7.7) 4 (4.0) 6 (20.0) 0.004d
Acute heart failure 6 (4.6) 5 (5.0) 1 (3.3) 1.000e
Sepsis (including septic shock) 7 (5.4) 6 (6.0) 1 (3.3) 1.000e
Other 17 (13.1) 13 (13.0) 4 (13.3) 0.962d
Comorbidities
Charlson comorbidity index (points) 5 (4–7) 5 (4–7) 6 (4–7) 0.507c
Renal insufficiency 46 (35.4) 36 (36.0) 10 (33.3) 0.789d
Hemodialysis 24 (18.5) 19 (19.0) 5 (16.7) 0.678d
Diabetes mellitus 35 (26.9) 25 (25.0) 10 (33.3) 0.369d
Coronary artery disease 33 (25.4) 25 (25.0) 8 (26.7) 0.854d
COPD 30 (23.1) 16 (16.0) 14 (46.7) < 0.001d
Chronic heart failure 17 (13.1) 15 (15.0) 2 (6.7) 0.234d
Malignancy 10 (7.7) 5 (5.0) 5 (16.7) 0.036d
Hepatopathy 7 (5.4) 6 (6.0) 1 (3.3) 1.000e
Interstitial lung disease 8 (6.2) 7 (7.0) 1 (3.3) 0.681e
Table 1. Clinical characteristics on admission to the weaning center—comparison of patients with successful
and unsuccessful first SBT. Continuous variables are presented as median (– interquartile range [IQR];
categorical variables are presented as number (%). BMI, body mass index; APACHE-II, Acute Physiology and
Chronic Health Evaluation II score; ECLA, extracorporeal lung assistance (during acute respiratory failure);
COPD, chronic obstructive pulmonary disease. a p value for differences between patients with successful and
unsuccessful SBT. b Student’s t-test. c Mann-Whitney U-test. d Chi-squared test. e Fisher’s exact test. Significant
values are in Bold.
Discussion
The present analysis aimed to investigate the discriminatory performance of the mechanical power in predict-
ing the outcome of a short weaning trial in prolonged ventilated patients. In summary, absolute MP performed
poorly, with improvement by correction for surrogates of lung volume (e. g. LTC dyn, so-called specific MP,
consistent with stress intensity) and mechanical ventilation PaCO2, the former allowing comparability between
differences in gender and body height, the latter simulating isocapnic conditions by accounting for individual
respiratory rate and ventilator pressure settings. Moreover, in the multivariable logistic regression analysis, these
indices were independently associated with failure of the SBT.
This approach of combining mechanical ventilation stress intensity with a marker of alveolar ventilation is a
simplified method for estimating associated mechanical power (stress intensity times LTCdyn) required to defend
alveolar ventilation and has recently been shown to correlate well with patients’ ability to wean from prolonged
ventilation successfully13. For instance, the difference between actual L
TCdyn-MP and Power index approximates
the required change in ventilator stress intensity output (determined by the inspiratory pressures, PEEP, and
respiratory rate) necessary to reach the target PaCO2, which was arbitrary set at 45 mmHg in the present study.
As a prerequisite for this, we aimed at near totally unloading the respiratory pump by applying the same (high)
inspiratory pressure during both controlled and assisted ventilation (in A/C mode), thereby minimizing patients’
respiratory muscle activity between SBT. In other words, even if patients’ respiratory muscles were relaxed, the
applied backup respiratory rate and inspiratory pressure (both of which determine minute ventilation) were
sufficient to defend alveolar ventilation. Nevertheless, our technique is a trade-off between the accuracy of MP
measurement and its clinical applicability. This approach to weaning is contrary to the current practice of lib-
eration attempts from short-term mechanical ventilation, which is a gradual reduction in ventilator support as
Scientific Reports | (2022) 12:6 | https://doi.org/10.1038/s41598-021-03960-y 4
Vol:.(1234567890)www.nature.com/scientificreports/
All patients SBT success SBT failure
First SBT (n = 130) (n = 100) (n = 30) p valuea
Time from admission to first SBT (days) 1 (0–3) 1 (0–3) 1 (1–3) 0.638b
Hemoglobin on first SBT (g/dL) 8.3 (± 1.2) 8.3 (± 1.2) 8.1 (± 1.3) 0.266c
Ventilatory variables & MP indices
FiO2 0.27 (± 0.05) 0.27 (± 0.05) 0.28 (± 0.04) 0.156c
Tidal volume (mL) 547 (± 86) 547 (± 83) 547 (± 97) 0.459c
Minute ventilation (L/min) 9.0 (± 1.9) 9.0 (± 2.0) 9.0 (± 1.7) 0.676c
PaCO2 on MV (mmHg) 35.0 (± 5.4) 33.9 (± 4.8) 38.8 (± 4.5) < 0.001b
Ventilatory ratio 1.19 (± 0.34) 1.14 (± 0.34) 1.38 (± 0.32) < 0.001c
PEEP (cmH2O) 6.0 (± 0.9) 6.0 (± 0.9) 6.0 (± 0.8) 0.717c
Pmax (cmH2O) 23.6 (± 4.2) 22.8 (± 4.1) 26.3 (± 3.5) < 0.001b
∆Paw (cmH2O) 17.6 (± 4.0) 16.8 (± 3.9) 20.3 (± 3.4) < 0.001c
LTCdyn (mL/cmH2O) 32.8 (± 9.6) 34.3 (± 9.6) 27.9 (± 7.9) < 0.001c
Mechanical power (J/min) 21.0 (± 5.9) 20.2 (± 5.7) 23.6 (± 5.8) 0.004c
PBW-MP (J/min/kg) 0.3295 (± 0.1106) 0.3111 (± 0.1033) 0.3907 (± 0.1137) < 0.001c
2
LTCdyn-MP (cmH2O /min) 7167 (± 3063) 6569 (± 2885) 9159 (± 2824) < 0.001c
1.0 2
Power indexrs (cmH2O /min) 5696 (± 2884) 5012 (± 2490) 7978 (± 2971) < 0.001c
2.0 2
Power indexrs (cmH2O /min) 4636 (± 2896) 3902 (± 2323) 7082 (± 3292) < 0.001c
PaCO2 on ABG
PaCO2 on MV pre-SBT (mmHg) 35.0 (± 5.4) 33.9 (± 4.8) 38.8 (± 5.5) 0.001b
PaCO2 on SB post-SBT (mmHg)* 38.7 (± 7.0) 36.3 (± 4.6) 48.9 (± 6.5) < 0.001b
∆PaCO2 (post-/pre-SBT) 3.9 (± 5.8) 2.4 (± 4.4) 10.2 (± 7.2) < 0.001c
pH on ABG
pH on MV pre-SBT 7.50 (± 0.05) 7.50 (± 0.05) 7.48 (± 0.05) 0.192c
pH on SB post-SBT* 7.46 (± 0.06) 7.48 (± 0.04) 7.40 (± 0.07) < 0.001c
∆pH (post-/pre-SBT) − 0.03 (± 0.06) − 0.02 (± 0.05) − 0.09 (± 0.07) < 0.001c
PaO2 on ABG
PaO2 on MV pre-SBT (mmHg) 83.7 (± 15.9) 85.0 (± 15.9) 79.4 (± 15.5) 0.069c
PaO2 on SB post-SBT (mmHg)* 76.9 (± 18.1) 77.4 (± 19.0) 74.7 (± 13.8) 0.790c
∆PaO2 (post-/pre-SBT) − 7.4 (± 21.0) − 7.6 (± 22.2) − 6.4 (± 15.0) 0.506c
Duration of first SBT (min) 30 (30–30) 30 (30–30) 30 (11–30) < 0.001c
Table 2. Results of first SBT—comparison of patients with successful and unsuccessful SBT. Continuous
variables are presented as arithmetic means values (± standard deviation) or median (– interquartile range
[IQR]); categorical variables are presented as numbers (%). SBT, spontaneous breathing trial; MP, mechanical
power; FiO2, the fraction of inspired oxygen; MV, mechanical ventilation; PEEP, positive end-expiratory
pressure; Pmax, the pre-set inspiratory positive airway pressure; ∆Paw, dynamic driving pressure (defined as
Pmax—PEEP in the pressure-controlled ventilation mode); LTCdyn, dynamic lung-thorax compliance; PBW-MP,
mechanical power normalized to predicted body weight; LTCdyn-MP, mechanical power normalized to
dynamic lung-thorax compliance, ABG, arterial blood gas analysis. *ABG at the end of the SBT was missing in
seven patients due to severe respiratory distress, requiring immediate resumption of mechanical ventilation. a p
value for differences between patients with successful and unsuccessful SBT. b Student’s t-test. c Mann-Whitney
U-test. d Chi-squared test. Significant values are in Bold.
soon as weaning readiness is suspected from clinical screening criteria (markers of respiratory system recovery),
with an optional assessment of weaning predictors during a short period of spontaneous breathing, followed by
a weaning t rial14. Even so, our approach has been shown to speed up weaning in prolonged ventilated, trache-
otomized patients compared to a gradual reduction of pressure support21.
Because no single parameter provides a perfect prediction for readiness testing, the combination of variables
that indicate when to undertake or refrain from making the first weaning attempt is appealing4,7,22,23. Yet, most
of the described integrative weaning indices (e.g., CROP, Integrative Weaning Index, or CORE) showed only
moderate accuracy in predicting the outcome of a short weaning trial, and none of them were validated in pro-
longed ventilated patients. Moreover, since most of the included variables were measured during spontaneous
breathing, assessment of these indices is more complex, reducing their applicability in daily routine. In contrast,
PIrs can be assessed at the bedside without disconnecting the patient from the ventilator.
Weaning predictors are used as a decision point to determine whether a patient may advance to a spontaneous
breathing trial. This approach has two main goals. First, it may help identify patients who are not yet ready for a
weaning trial, assuming a failed SBT results in worse outcomes. However, in contrast to extubation failure, which
is associated with increased mortality24, there is so far no evidence that a failed weaning trial could be harmful,
provided ventilation is resumed immediately in the event of respiratory distress. In a physiologic study, Laghi
Scientific Reports | (2022) 12:6 | https://doi.org/10.1038/s41598-021-03960-y 5
Vol.:(0123456789)www.nature.com/scientificreports/
Failure of spontaneous breathing trial
Variables Sens Spec PPV NPV Accuracy PLR NLR DOR F1 MCC
PaCO2 on MV 68 (40–89) 69 (54–81) 41 (28–54) 88 (77–94) 68 (56–79) 2.4 (1.3–4.2) 0.5 (1.0–0.2) 5.6 0.51 0.32
Ventilatory ratio 68 (41–88) 70 (55–83) 40 (28–54) 88 (78–94) 69 (62–80) 2.3 (1.3–4.0) 0.4 (1.0–0.2) 6.9 0.50 0.33
LTCdyn 63 (37–84) 69 (55–81) 37 (25–52) 87 (77–93) 68 (55–79) 2.0 (1.2–3.6) 0.5 (1.0–0.3) 5.1 0.46 0.28
Mechanical power 70 (44–88) 61 (46–74) 34 (24–46) 88 (76–94) 63 (50–74) 1.7 (1.1–2.8) 0.5 (1.1–0.2) 6.7 0.45 0.26
PBW-MP 65 (39–85) 67 (53–79) 39 (26–53) 87 (76–93) 67 (54–78) 2.3 (1.2–4.6) 0.5 (1.0–0.3) 5.3 0.47 0.29
LTCdyn-MP 72 (45–89) 71 (57–83) 43 (30–56) 90 (79–95) 71 (59–82) 2.5 (1.2–4.4) 0.4 (0.9–0.2) 10.0 0.53 0.37
Power indexrs1.0 78 (47–93) 72 (58–84) 45 (32–58) 91 (80–96) 72 (60–83) 2.7 (1.6–4.8) 0.3 (0.8–0.1) 8.6 0.57 0.42
Power indexrs2.0 70 (42–90) 75 (60–86) 46 (32–60) 89 (79–95) 73 (61–84) 2.9 (1.6–5.3) 0.4 (0.9–0.2) 7.1 0.55 0.39
Table 3. Cross-validated performance of variables analyzed to predict the outcome of SBT—mean values
derived from the test sets. Assessment of mean sensitivity and specificity, positive and negative predictive
value, positive and negative likelihood ratio, diagnostic odds ratio, F
1 score, and Matthews correlation
coefficient (with 95% confidenceintervals). SBT, spontaneous breathing trial; Sens, sensitivity; Spec, specificity;
PPV, positive predictive value; NPV, negative predictive value; PLR, positive likelihood ratio; NLR, negative
likelihood ratio; DOR, diagnostic odds ratio; F1, F1 score; MCC, Matthews correlation coefficient; MV,
mechanical ventilation; LTCdyn, dynamic lung-thorax compliance; PBW-MP, mechanical power normalized to
predicted body weight; LTCdyn-MP, mechanical power normalized to dynamic lung-thorax compliance.
Variables AUROC
PaCO2 on MV 0.74 (0.66–0.81)
Ventilatory ratio 0.74 (0.65–0.81)
LTCdyn 0.71 (0.62–0.78)
Mechanical power 0.68 (0.59–0.75)
PBW-MP 0.71 (0.62–0.79)
LTCdyn-MP 0.76 (0.68–0.83)
Power indexrs1.0 0.81 (0.73–0.87)
Power indexrs2.0 0.81 (0.73–0.87)
Table 4. The area under the ROC curve for each variable analyzed to predict the outcome of first SBT—all
patients. The accuracy of each variable in the whole study population presented as the area under the ROC
curve with 95% confidence intervals. SBT, spontaneous breathing trial; MV, mechanical ventilation; L TCdyn,
dynamic lung-thorax compliance; PBW-MP, mechanical power normalized to predicted body weight;
LTCdyn-MP, mechanical power normalized to dynamic lung-thorax compliance.
and co-workers demonstrated that patients who failed a weaning trial did not develop contractile fatigue of the
diaphragm (consistent with muscle injury), potentially leading to subsequent unsuccessful weaning attempts or
unsuccessful liberation from the v entilator25. Moreover, these investigators were able to show that diaphragmatic
recruitment at the end of a failed weaning trial, estimated by the electrical activity of the diaphragm, was half
of the maximum, corresponding to reflex inhibition of the diaphragm with at the same time redistribution of
motoneuron output to rib cage and accessory muscles, a potential mechanism for the prevention of diaphragmatic
contractile fatigue26. Accordingly, patients categorized as difficult to wean, failing up to three SBT before success-
ful discontinuation of mechanical ventilation, showed no increase in ICU‒ or hospital mortality compared to
patients successfully extubated on the first a ttempt27,28. The second and presumably more important goal of using
weaning predictors is to avoid unnecessarily prolonged ventilation, which associates with significant morbidity
and mortality1,2. In this context, given its higher negative predictive value, the Power index may be particularly
useful in identifying patients who are likely to succeed in a trial of spontaneous breathing rather than indicating
weaning failure. This finding is in line with most classic prediction variables, which display high sensitivity for
weaning success (e. g., the rapid shallow breathing index or maximum inspiratory pressure), but usually lack
sufficient specificity4. This phenomenon may, in part, be explained by the duration of weaning trials in different
studies. Since the relationship between critical stress imposed on respiratory muscles and time to task failure in
healthy subjects follows an inverse power function29, 30 min of spontaneous breathing may be too short for some
patients for the development of apparent respiratory distress or alveolar hypoventilation, heightened muscle effort
is not sustained for a sufficient t ime25. Yet, these patients may experience weaning failure in a more extended
trial25. Accordingly, in the present study, the Power index was significantly correlated with the duration of SBT.
Nevertheless, the selected threshold value finally determines L TCdyn-MP’s predictive weaning outcome ability,
allowing further adjustments depending on the primary goal of using it as a weaning predictor (e.g., preferring
a higher sensitivity or specificity for SBT failure).
In a recent observational study, patients determined to have premature or delayed weaning trials, compared
to patients with an opportune SBT, showed worse clinical outcomes30. However, so far, controlled studies have
Scientific Reports | (2022) 12:6 | https://doi.org/10.1038/s41598-021-03960-y 6
Vol:.(1234567890)www.nature.com/scientificreports/
Figure 2. Comparison of ROC curves for mechanical power, LTCdyn-MP, and the power indexrs2.0 predicting
the outcome of SBT – all patients. Abbreviations: ROC, receiver operating characteristic curve; L
TCdyn-MP,
mechanical power normalized to dynamic lung-thorax compliance.
Univariable analysis Multivariable model 1 Multivariable model 2 Multivariable model 3
Variables OR (95%CI) P OR (95%CI) P OR (95%CI) P OR (95%CI) P
Age 1.00 (0.97‒1.03) 0.978
Gender (male) 0.59 (0.26‒1.35) 0.210
BMI 1.04 (0.98‒1.10) 0.166
APACHE-II 1.01 (0.94‒1.09) 0.770
CCI 1.07 (0.89‒1.28) 0.472
COPD 4.5 (1.88‒11.24) < 0.01
Obesity 1.71 (0.73‒4.01) 0.214
Immunosuppression 0.51 (0.14‒1.85) 0.304
Malignancy 3.80 (1.02‒14.2) 0.047
VD on admission 1.01 (0.99‒1.03) 0.174
ECLA 0.23 (0.03‒1.84) 0.166
Hb on SBT 0.99 (0.95‒1.02) 0.460
PaCO2 on MV 1.21 (1.10‒1.33) < 0.01 1.19 (1.09‒1.31) < 0.01 1.30 (1.14‒1.47) < 0.01 1.17 (1.06‒1.28) < 0.01
Ventilatory ratio 7.47 (1.88‒29.6) < 0.01 0.08 (0.01‒0.92) 0.043
LTCdyn 0.91 (0.86‒0.97) < 0.01
Mechanical power 1.10 (1.03‒1.19) < 0.01 1.09 (1.00‒1.18) 0.043
PBW-MP, per 10–2 J/
1.06 (1.03‒1.11) < 0.01 1.13 (1.05‒1.21) < 0.01
min/kg
LTCdyn-MP, per 1000
1.32 (1.14‒1.53) < 0.01 1.25 (1.06‒1.46) < 0.01
cmH2O2/min
Power indexrs1.0, per
1.45 (1.22‒1.72) < 0.01
1000 cmH2O2/min
2.0
Power indexrs , per
1.48 (1.24‒1.76) < 0.01
1000 cmH2O2/min
Table 5. Variables associated with failure of SBT—Results of binary logistic regression analysis. Multivariable
regression models included age, gender, BMI, COPD, malignancy, ventilator days on admission, ECLA,
ventilatory ratio, and indices derived from calculated mechanical power. BMI, body mass index; APACHE-II,
Acute Physiology and Chronic Health Evaluation II score; CCI, Charlson comorbidity index; COPD, chronic
obstructive pulmonary disease; VD, ventilator days; ECLA, extracorporeal lung assistance; Hb, hemoglobin;
SBT, spontaneous breathing trial; MV, mechanical ventilation; LTCdyn, dynamic lung-thorax compliance;
PBW-MP, mechanical power normalized to predicted body weight; LTCdyn-MP, mechanical power normalized
to dynamic lung-thorax compliance. Significant values are in Bold.
Scientific Reports | (2022) 12:6 | https://doi.org/10.1038/s41598-021-03960-y 7
Vol.:(0123456789)www.nature.com/scientificreports/
failed to prove advantages of using weaning predictors (e. g., shortening the duration of mechanical ventilation)
compared to decision making based on clinical screening criteria alone31. In two randomized trials, incorporat-
ing the rapid shallow breathing index (frequency-tidal volume ratio) in a weaning protocol, which was then
used (intervention) or not used (control) for the decision to proceed on spontaneous breathing, this approach
significantly prolonged weaning time, had no perceptible effect on mortality or extubation failure rates32, and
thus may not be helpful in a weaning p rotocol33. Consequently, incorporating weaning predictors in the decision
to proceed on a weaning trial generally has been questioned34, and routine use of such prediction variables is
currently not recommended14,35.
Weaning and extubation outcomes in intubated patients are two independent processes, the inability to
breathe without ventilator assistance due to an imbalance between load and capacity of respiratory muscles
(referred to as non-airway failure or weaning failure) and the inability to maintain a patent airway (so-called
airway failure)36, both of which are associated with different risk f actors37. This is a significant problem when
assessing prediction variables in such patients, limiting the development of a single prediction model with high
diagnostic accuracy. Tracheostomy protects the airway during both mechanical and self-ventilation, allowing the
evaluation of spontaneous breathing in isolation. Hence, investigating such patients and comparing those who
can or cannot defend alveolar ventilation may provide a deeper understanding of why weaning failure occurs.
Our study has several limitations. First, since it was a monocentric analysis, generalizability to other centers
(external validity) is uncertain. Second, the first weaning attempt was made over 30 min, which may have been
too short, and a more extended trial may have disclosed more patients with weaning failure, affecting diagnostic
accuracy of the prediction variables. Finally, since we evaluated only patients with tracheotomies, we cannot
extrapolate our results to intubated patients.
Conclusions
Mechanical power normalized to lung-thorax compliance independently predicted the outcome of a short wean-
ing trial and thus may serve for readiness testing before proceeding on spontaneous breathing in prolonged
ventilated patients. Given its higher negative predictive value, this index may be particularly useful in identifying
patients ready to attempt spontaneous breathing, thereby probably decreasing ventilation time.
Data availability
The datasets used and analyzed during the current study are available from the corresponding author on reason-
able request.
Received: 13 August 2021; Accepted: 13 December 2021
References
1. Torres, A. et al. Re-intubation increases the risk of nosocomial pneumonia in patients needing mechanical ventilation. Am. J.
Respir. Crit. Care Med. 152(1), 137–141 (1995).
2. Girou, E. et al. Association of non-invasive ventilation with nosocomial infections and survival in critically ill patients. JAMA
284(18), 2361–2367 (2000).
3. Ely, E. W. et al. Effect on the duration of mechanical ventilation of identifying patients capable of breathing spontaneously. N. Engl.
J. Med. 335(25), 1864–1869 (1996).
4. Yang, K. L. & Tobin, M. J. A prospective study of indexes predicting the outcome of trials of weaning from mechanical ventilation.
N. Engl. J. Med. 324(21), 1445–1450 (1991).
5. Vallverdu, I. et al. Clinical characteristics, respiratory functional parameters, and outcome of a two-hour T-piece trial in patients
weaning from mechanical ventilation. Am. J. Respir. Crit. Care Med. 158(6), 1855–1862 (1998).
6. Baptistella, A. F. et al. Predictive factors of weaning from mechanical ventilation and extubation outcome: A systematic review. J.
Crit. Care. 48, 56–62 (2018).
7. Jubran, A., Grant, B. J. B., Laghi, F., Parthasarathy, S. & Tobin, M. J. Weaning prediction: Esophageal pressure monitoring comple-
ments readiness testing. Am. J. Respir. Crit. Care. Med. 171(11), 1252–1259 (2005).
8. Vassilakopoulos, T., Zakynthinos, S. & Roussos, C. The tension-time index and the frequency/tidal volume ratio are the major
pathophysiologic determinants of weaning failure and success. Am. J. Respir. Crit. Care Med. 158(2), 378–385 (1998).
9. Purro, A. et al. Physiologic determinants of ventilator dependence in long-term mechanically ventilated patients. Am. J. Respir.
Crit. Care Med. 161(4), 1115–1123 (2000).
10. Jubran, A. & Tobin, M. J. Pathophysiologic basis of acute respiratory distress in patients who fail a trial of weaning from mechanical
ventilation. Am. J. Respir. Crit. Care Med. 155(3), 906–915 (1997).
11. Gattinoni, L. et al. Ventilator-related causes of lung injury: the mechanical power. Intensive Care Med. 42(10), 1567–1575 (2016).
12. Ghiani, A. et al. Variables predicting weaning outcome in prolonged mechanically ventilated tracheotomized patients: A retrospec-
tive study. J. Intensive Care 8, 19 (2020).
13. Ghiani, A., Paderewska, J., Walcher, S. & Neurohr, C. Mechanical power normalized to lung-thorax compliance predicts prolonged
ventilation weaning failure: a prospective study. BMC Pulm. Med. 21, 202 (2021).
14. Boles, J. M. et al. Weaning from mechanical ventilation. Eur. Respir. J. 29(5), 1033–1056 (2007).
15. Okabe, Y. et al. Lung-thorax compliance measured during a spontaneous breathing trial is a good index of extubation failure in
the surgical intensive care unit: a retrospective cohort study. J. Intensive Care 6, 44 (2018).
16. Becher, T., van der Staay, M., Schädler, D., Frerichs, I. & Weiler, N. Calculation of mechanical power for pressure-controlled
ventilation. Intensive Care Med. 45(9), 1321–1323 (2019).
17. Chiumello, D. et al. Bedside calculation of mechanical power during volume- and pressure-controlled mechanical ventilation.
Crit. Care 24, 417 (2020).
18. Sinha, P., Fauvel, N. J., Singh, P. & Soni, N. Analysis of ventilatory ratio as a novel method to monitor ventilatory adequacy at the
bedside. Crit. Care 17, R34 (2013).
19. Brower, R. G. et al. Ventilation with lower tidal volumes as compared with traditional tidal volumes for acute lung injury and the
acute respiratory distress syndrome. N. Engl. J. Med. 342(18), 1301–1308 (2000).
20. Arlot, S. & Celisse, A. A survey of cross-validation procedures for model selection. Stat. Surv. 4, 40–79 (2010).
Scientific Reports | (2022) 12:6 | https://doi.org/10.1038/s41598-021-03960-y 8
Vol:.(1234567890)www.nature.com/scientificreports/
21. Jubran, A. et al. Effect of pressure support vs unassisted breathing through a tracheostomy collar on weaning duration in patients
requiring prolonged mechanical ventilation: A randomized trial. JAMA 309(7), 671–677 (2013).
22. Nemer, S. N. et al. A new integrative weaning index of discontinuation from mechanical ventilation. Crit. Care 13, R152 (2009).
23. Delisle, S. et al. Preliminary evaluation of a new index to predict the outcome of a spontaneous breathing trial. Respir. Care 56(10),
1500–1505 (2011).
24. Epstein, S. K., Ciubotaru, R. L. & Wong, J. B. Effect of failed extubation on the outcome of mechanical ventilation. Chest 112(1),
186–192 (1997).
25. Laghi, F. et al. Is weaning failure caused by low-frequency fatigue of diaphragm?. Am. J. Respir. Crit. Care Med. 167(2), 120–127
(2003).
26. Laghi, F. et al. Inhibition of central activation of the diaphragm: A mechanism of weaning failure. J. Appl. Physiol. 129(2), 366–376
(2020).
27. Funk, G. C. et al. Incidence and outcome of weaning from mechanical ventilation according to new categories. Eur. Respir. J. 35(1),
88–94 (2010).
28. Penuelas, O. et al. Characteristics and outcomes of ventilated patients according to time to liberation from mechanical ventilation.
Am. J. Respir. Crit. Care Med. 184(4), 430–437 (2011).
29. Bellemare, F. & Grassino, A. Effect of pressure and timing of contraction on human diaphragm fatigue. J. Appl. Physiol. 53(5),
1190–1195 (1982).
30. Diaz-Soto, M. et al. Premature, opportune, and delayed weaning in mechanically ventilated patients: A call for implementation of
weaning protocols in low- and middle income coutries. Crit. Care Med. 48(5), 673–679 (2020).
31. Girard, T. D. et al. Efficacy and safety of paired sedation and ventilator weaning protocol for mechanically ventilated patients in
intensive care (Awakening and Breathing Controlled trial): A randomized controlled trial. Lancet 371(9607), 126–134 (2008).
32. Tanios, M. A. et al. A randomized, controlled trial of the role of weaning predictors in clinical decision making. Crit. Care Med.
34(10), 2530–2535 (2006).
33. Figuerora-Casas, J. B. et al. Effect of using the rapid shallow breathing index as readiness criterion for spontaneous breathing trials
in a weaning protocol. Am. J. Med. Sci. 359(2), 117–122 (2020).
34. Epstein, S. K. Routine use of weaning predictors: Not so fast. Crit. Care 13(5), 197 (2009).
35. Schmidt, G. A. et al. Official executive summary of an American Thoracic Society/American College of Chest Physicians clinical
practice guideline: Liberation from mechanical ventilation in critically ill adults. Am. J. Respir. Crit. Care Med. 195(1), 115–119
(2017).
36. Epstein, S. K. & Ciubotaru, R. L. Independent effects of etiology of failure and time to reintubation on outcome for patients failing
extubation. Am. J. Respir. Crit. Care Med. 158(2), 489–493 (1998).
37. Jaber, S. et al. Risk factors and outcomes for airway failure versus non-airway failure int the intensive care unit: a multicenter
observational study of 1514 extubation procedures. Crit. Care 22(1), 236 (2018).
Author contributions
Study concept and design: A.G. Acquisition of data: A.G., J.P., S.W. Analysis, and interpretation of data: A.G.,
J.P., S.W., K.T., C.N., N.K. First draft of the manuscript: A.G. Critical revision of the manuscript for important
intellectual content: A.G., J.P., S.W., K.T., C.N., N.K. Statistical analysis: A.G. All authors have read and approved
the final version of the manuscript.
Competing interests
The authors declare no competing interests.
Additional information
Supplementary Information The online version contains supplementary material available at https://doi.org/
10.1038/s41598-021-03960-y.
Correspondence and requests for materials should be addressed to A.G.
Reprints and permissions information is available at www.nature.com/reprints.
Publisher’s note Springer Nature remains neutral with regard to jurisdictional claims in published maps and
institutional affiliations.
Open Access This article is licensed under a Creative Commons Attribution 4.0 International
License, which permits use, sharing, adaptation, distribution and reproduction in any medium or
format, as long as you give appropriate credit to the original author(s) and the source, provide a link to the
Creative Commons licence, and indicate if changes were made. The images or other third party material in this
article are included in the article’s Creative Commons licence, unless indicated otherwise in a credit line to the
material. If material is not included in the article’s Creative Commons licence and your intended use is not
permitted by statutory regulation or exceeds the permitted use, you will need to obtain permission directly from
the copyright holder. To view a copy of this licence, visit http://creativecommons.org/licenses/by/4.0/.
© The Author(s) 2022
Scientific Reports | (2022) 12:6 | https://doi.org/10.1038/s41598-021-03960-y 9
Vol.:(0123456789)You can also read