Mapping the "catscape" formed by a population of pet cats with outdoor access
←
→
Page content transcription
If your browser does not render page correctly, please read the page content below
www.nature.com/scientificreports
OPEN Mapping the “catscape” formed
by a population of pet cats
with outdoor access
Richard Bischof*, Nina Rosita Hansen, Øyvind Skarsgard Nyheim, Astrid Kisen,
Lillian Prestmoen & Torbjørn Haugaasen
The domestic cat (Felis catus) is among the most popular companion animals and most abundant
carnivores globally. It is also a pet with an immense ecological footprint because even non-feral and
food-subsidized cats can be prolific predators. Whereas knowledge about the spatial behavior of
individual domestic cats is growing, we still know little about how a local population of free-ranging
pet cats occupies the landscape. Using a citizen science approach, we GPS-tagged 92 pet cats with
outdoor access living in a residential area in southern Norway. The resulting position data allowed
us to construct both individual home range kernels and a population-level utilization distribution.
Our results reveal a dense predatory blanket that outdoor cats drape over and beyond the urban
landscape. It is this population-level intensity surface—the “catscape”—that potential prey have to
navigate. There were few gaps in the catscape within our residential study area and therefore few
terrestrial refuges from potential cat predation. However, cats spent on average 79% of their outdoor
time within 50 m to their owner’s home, which suggests that the primary impact is local and most
acute for wildlife in the vicinity to homes with cats. We discuss the catscape as a conceptual and
quantitative tool for better understanding and mitigating the environmental impact of domestic cats.
Pet cats with outdoor access are as much part of ecological communities as wildlife species that tolerate or
benefit from proximity to humans. Despite receiving food subsidies from their human owners, many domestic
cats are prolific predators and prey on a wide range of wildlife species1,2. With an estimated 600 million pet cats
worldwide3, this is one of the most abundant carnivore species, wild or domestic. Consequently, the inferred
quantity and the diversity of wild prey killed by domestic cats is staggering1,2,4. With the caveat that the reliabil-
ity of extrapolated national or landscape-level numbers of cat-killed vertebrates can be drawn into question5,
estimates range into the m illions6 and even b
illions4,7 of birds and mammals annually.
The direct ecological impact of pet cats is linked with their outdoor activity, and a substantial proportion of
pet cats with outdoor access hunt (e.g., between 50 and 80% in a study by Loss et al. in the USA4). A growing
number of studies— often using GPS tracking—seeks to elucidate cat space-use behavior. Studies range from
local8 to r egional9, including an extensive investigation involving over 900 individual cats from 6 countries3.
Thanks to such studies, knowledge about the space-use patterns of outdoor cats is growing. One consistent
pattern revealed by telemetry studies of domestic cats is that of substantial regional and individual variation in
spatial behavior, such as home range size, the propensity to roam, and habitat selection. This variation can, at least
in part, be attributed to differences in intrinsic characteristics of the cat-and-owner entity (e.g., cat demography
and maintenance) and the outdoor environment (e.g., habitat). For example, age, sex, and sterilization status
influence home range size, as does the position of the cat’s home along the urban-nature gradient: younger, male,
intact cats, and cats in rural areas tend to have the largest home r anges3,10,11.
Individual organisms and their impacts scale up to populations. The same is not always true for ecological
studies; information based on a small subset of individuals (or individuals originating from a patchwork of sites)
are notoriously unreliable for scaling up to population-level inferences12,13. Regardless of the reasons behind
individual and spatial heterogeneity, sparse or non-representative sampling prevents trustworthy inferences
about population and landscape-level cat space-use and predation on wildlife. We are not aware of any study
that has attempted to track all or the majority of cats within a neighborhood with a typical cat density. This is a
surprising gap in information, as the local ecological impact of pet cats is attributable to their sheer n umbers14.
Wildlife preyed upon by cats face the combined local cat population, which in urban areas readily reaches den-
sities of several hundred individuals per km25,15,16. Mapping the “catscape”—the combined intensity of space-use
Faculty of Environmental Sciences and Natural Resource Management, Norwegian University of Life Sciences,
Høgskoleveien 12, 1432 Ås, Norway. *email: richard.bischof@nmbu.no
Scientific Reports | (2022) 12:5964 | https://doi.org/10.1038/s41598-022-09694-9 1
Vol.:(0123456789)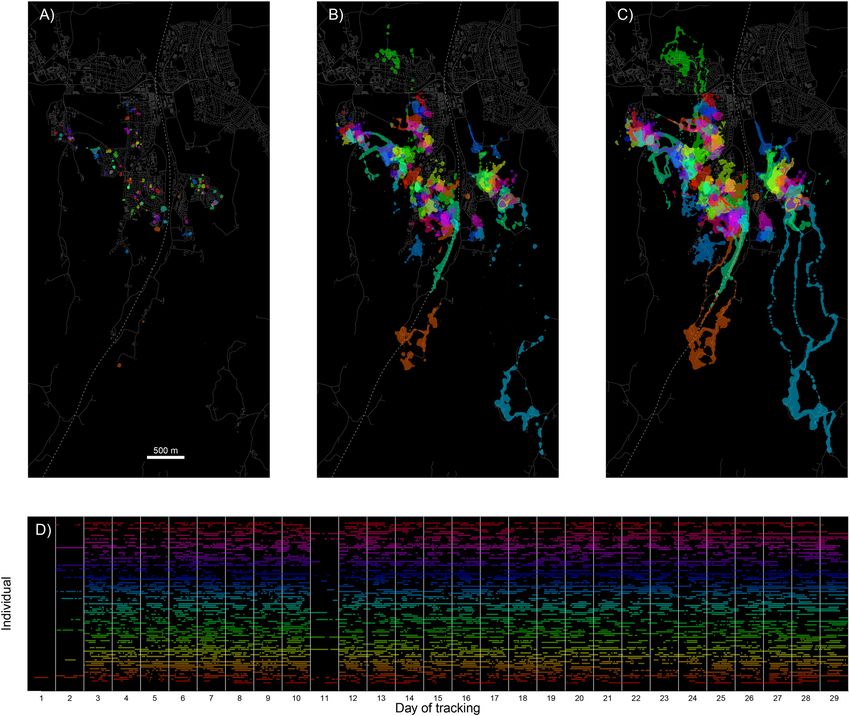
www.nature.com/scientificreports/
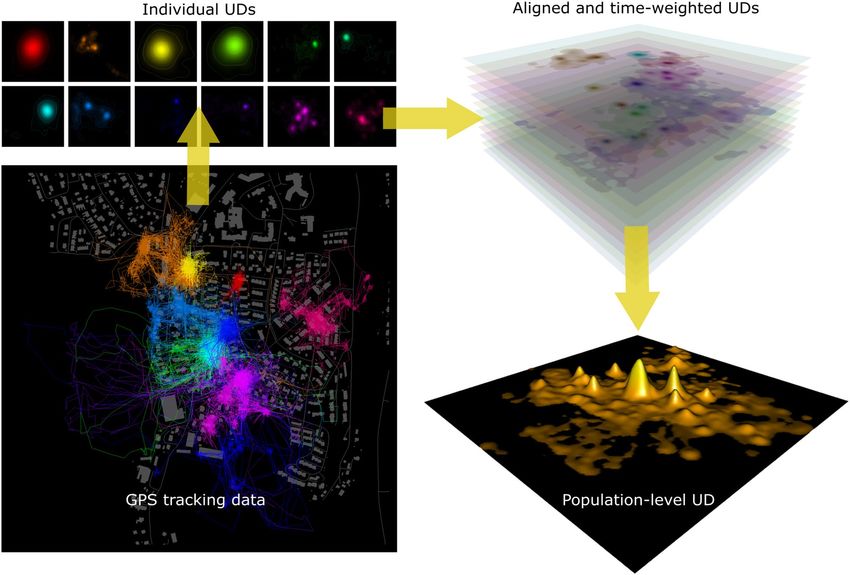
Figure 1. Illustration of the construction of the catscape by aggregating the utilization distributions (UDs) of
12 example pet cats in a suburban neighborhood (buildings shown in grey). High-throughput GPS data (A)
are used to estimate individual UDs with Brownian bridge motion models (B). Individual UDs are weighted
according to the average proportion of time spent outdoors on days with data (C) and are then summed across
individuals to yield the combined intensity of use (D). All maps (2D and 3D) were created using R17.
by a cat population—could help us better understand and potentially mitigate the ecological impacts of domestic
cats. During a month-long study, and with the help of citizen scientists, we GPS-tagged and tracked 92 domes-
tic cats living with their owners in a small (1.1 km2 ) residential area in southern Norway. This unprecedented
population coverage allowed us to construct a population-level utilization distributions (Fig. 1), an ecologically
meaningful representation of outdoor cat populations: the spatially-explicit risk of encountering cats across the
landscape. The catscape, if not equivalent to the risk of predation, is likely linked to it.
Results
Study cats. The 92 cats included in this analysis were associated with 76 households; 14 households had 2
participant cats and one household had 3 participant cats. The sex ratio of GPS-tagged cats was close to even
(49% female), with similar median ages for the sexes (females: 5.5y, males: 5y). All except 2 juvenile cats (1
female, 1 male) were reportedly sterilized. Thirty-two percent of cats had free or partially free outdoor access via
a pet door/flap; the remaining individuals were released manually by their owners. The majority of cats (78%)
were given unlimited access to food. Owners did not provide demographic and maintenance details for 6 cats;
percentages provided above refer to cats for which information was provided.
We estimate that we tracked ≥ 73% of the cats (126) inferred to be living inside the study area and approxi-
mately 44% of the outdoor activity by all cats. These estimates are based on initial registrations by cat owners
to the project (some of which chose not to participate), information from participating cat owners about other
cats they knew in their neighborhood, and ancillary information from 47 camera traps distributed throughout
residential backyards in the study area (Extended Data Fig. S1). Three cats that were recruited within the study
area but did not provide 5 days of GPS tracking data were excluded from the analysis. Activity missed is likely a
combination of activity by participant cats during times when they were not wearing a functioning collar, activity
by non-participant cats that live inside the study area, and activity by cats entering the study area from outside.
To our knowledge, all cats using our study area are owned cats.
Movements and home ranges. We included on average 21.4 days (range: 6–28; interquartile range [IQR]:
19–26) with GPS position data from cats in the study. The average daily outdoor tracking duration was 8.4 h
Scientific Reports | (2022) 12:5964 | https://doi.org/10.1038/s41598-022-09694-9 2
Vol:.(1234567890)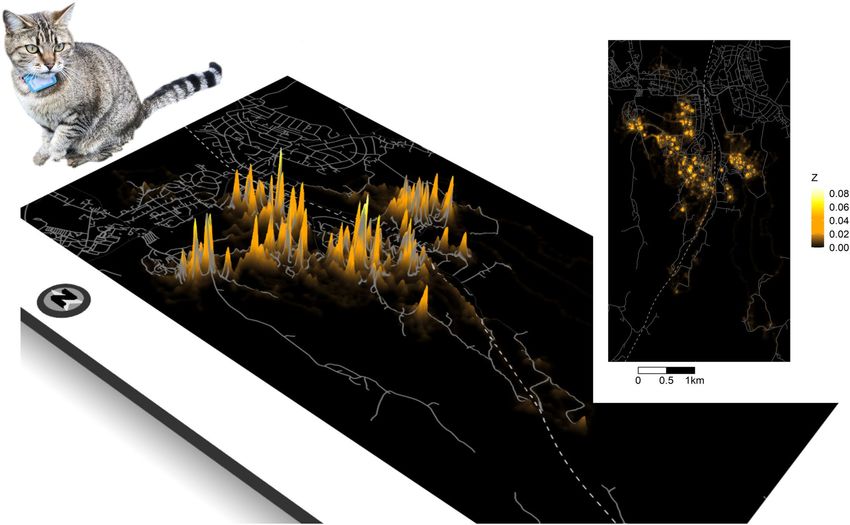
www.nature.com/scientificreports/
Figure 2. Individual home ranges and temporal tracking coverage for 92 pet cats (color-coded) that were GPS-
tracked during May 2021 in a residential area in southern Norway. Shown are 50% (A), 95% (B), and 99% (C)
home ranges, based on corresponding vertices of Brownian bridge movement models. Cats spent the majority of
their outdoor time in close proximity to their owner’s home, evident in the small core areas (50% home range)
compared with the 95% and 99% home range polygons. Grey lines and polygons in the background indicate
roads and buildings, respectively. A fenced railroad (dashed line) transects the study area. Panel (D) shows the
temporal coverage of outdoor GPS tracking data of each cat (rows). A pronounced gap in GPS tracking on day
11 coincides with temporary retrieval of GPS units to download initial data and check for technical problems
before continuing tracking. The figure was created using R 17.
(range: 1–18.2; IQR: 5.6–11.2; Fig. 2D). Home range size estimates (95% BBMM) during the study period ranged
from 0.3 to 22.1 ha (mean: 2.6; IQR: 0.7–3.2; Fig. 2B). Female home ranges averaged 1.5 ha (range: 0.3–5.4; IQR:
0.5–2), compared with 3.7 ha (range: 0.6–22.1; IQR: 1.2–3.8) for males. At 0.2 ha (range: 0.1–0.8; IQR: 0.1–0.2;
Fig. 2A), the core area (50% UD; Fig. 2A) of the average cat was 1/14 the size of its 95% home range, Fig. 2B).
Individual cats spent on average 79% (32–100 %) of their time outdoors within 50 m of their owner’s home. The
overall average distance of outdoor positions from the home was 58 m (range: 6–914; IQR: 13–48), the average
maximum distance was 352 m (range: 48–3384; IQR: 134–401). The homes of cats in this study were on average
76 m (range: 1–245; IQR: 19–115; SI Fig. S1) from the urban edge, and home ranges (95% BBMM) included on
average 19% non-urban areas (range: 0–77; IQR: 0–73).
Population‑level UD. The surface representing the population-level UD was highly variable; within the
region delineated by the 99% vertex of the catscape, we measured a more than 1800-fold difference between
the highest and lowest utilization intensity values (Fig. 3). At the population-level, cat utilization intensity was
11-fold higher within 50 m of a cat owner’s home than at a distance of 50 m to 100 m. Thirty-seven percent (0.59
km 2 ) of the area covered by the catscape (1.59 km2 based on the area delineated by the 99% volume contour)
Scientific Reports | (2022) 12:5964 | https://doi.org/10.1038/s41598-022-09694-9 3
Vol.:(0123456789)www.nature.com/scientificreports/
Figure 3. Three-dimensional representation of the catscape (with 2D inset), constructed using individual
utilization distributions of 92 domestic cats. The height of the surface (Z, square root transformed for
visualization) denotes the intensity of use by cats. Grey lines indicate roads; a fenced railroad (dashed line)
transects the study area. Both maps were created using R 17; cat photo by R. Bischof.
extended beyond urban and other developed areas (e.g, farm yards, etc.). However, only 9% of the utilization
intensity associated with the catscape fell outside urban and developed areas.
Discussion
Our analysis revealed that individual utilization distributions (UDs, Fig. 2) of pet cats with outdoor access
coalesce into a joint surface that drapes over the suburban landscape and the surrounding areas (Fig. 3). The
height of the surface is a function of both the number of cats that use a particular location and the amount of
time they spend there. It is this surface that potential prey species have to navigate, and it not only conveys the
spatial configuration of the risk of encountering a pet cat, but its characteristics can also guide the selection and
targeted application of mitigation measures.
The population-level UD reflects spatial variation in relative utilization and potential impacts of domestic cats
within a study area. It can also be used to compare different areas and populations, assuming similar coverage
(proportion of the population and activity tracked). Although we tracked the majority of cats living within the
study area, the catscape shown here represents a minimum use-scenario, as not all outdoor activity by cats was
tracked. Nonetheless, spatio-temporal coverage for a cat population of such density was unprecedented (Fig. 2D).
Although seemingly high, the inferred number of cats (126) with homes in our study area (1.1 km2 ) is com-
parable or lower than values reported elsewhere. For example, domestic cat densities in urban areas in the UK
have been estimated to range between 131.8 and 1579.2 cats/km 2 (median 417.3 cats/km 2 )15 and average cat
densities of above 200 per km 2 have been reported by studies in New Zealand5 and the US16. In Norway, with a
human population size of 5.4 million, there are an estimated 770,000 pet c ats18.
One approach to mitigate environmental impacts of cats is to decrease the spatial coverage and overall height
of the catscape. This could be accomplished by reducing the number of cats with outdoor access, including
prohibiting cat ownership in sensitive a reas19, or limiting the amount of time cats spend o utdoors20. Reduc-
tion in pet cat numbers, while theoretically feasible, presumably involves the kind of political and regulatory
maneuvering most jurisdictions shy away from21. Moreover, without a better understanding of the role of intra-
species interactions in the spatio-temporal dynamics of cat populations, it is unclear whether the reduction of
cat numbers or the duration and frequency of outdoor access would lead to a corresponding reduction in overall
space utilization19. It has been suggested that removing cats in a dense population may lead to a reduction in
predation pressure without a reduction of spatial coverage or creation of cat-free areas, as remaining cats expand
their home ranges due to density-dependent effects on m ovements5. Counter-intuitive effects of predator control
on predation have been demonstrated or suggested in other species. For example, predator control can increase
predation through the disruption of social structure when dominant individuals are removed, due to changes in
Scientific Reports | (2022) 12:5964 | https://doi.org/10.1038/s41598-022-09694-9 4
Vol:.(1234567890)www.nature.com/scientificreports/
the behavior of remaining individuals, or through knock-on effects on other predator species that are released
from competition22.
The spatial coverage of the catscape could also be reduced by shrinking the average home range size of
constituent cats. C onfinement20, including curfews to keep cats indoors during times with more pronounced
roaming behavior8, and s terilization11,23 have been suggested to reduce roaming behavior and home range size
in domestic cats. This, like a reduction in the number of cats, could decrease the total size of the area impacted
and create gaps in the catscape to serve as refuges for potential prey. Note that all but two cats in our study were
sterilized, so the catscape shown here already exemplifies a best-case scenario in terms of reproductive control
effects on range of movement.
The catscape is characterized by pronounced peaks (Fig. 3), reflecting high site fidelity of cats to their owners’
homes, with further clustering evident in both individual and population-level UDs (Fig. 3). Cats in our study
spent 79% of their time outdoors within 50 m of their owner’s home, and concentrated activity and small home
ranges evidently characterize the spatial behavior of most pet cats3. This suggests that the highest predation
risk—or at least the highest risk of encountering a cat—is local and most acute for wildlife utilizing space in the
vicinity of residences with cats. The configuration of the catscape into pronounced hot-spots offers opportunities
for more targeted mitigation measures. This could involve the removal or enhanced protection of bird feeders,
nest boxes, and bird baths near the homes and in the yards of cat owners. Here too, unintended consequences
are possible if, for example, the reduction in predation opportunities leads to an expansion of the cat’s activity
area, with risk simply shifting farther away from the cat’s home. To our knowledge, all cats using our study area
are owned cats. Feral cats tend to have larger home ranges and predation impact than owned c ats4,24, and the
presence of feral cats in other locations likely changes the spatial configuration of the population-level UD, as
well as the associated environmental impacts.
Beyond urban. Thirty-seven percent of the catscape extended beyond urban areas and areas with infra-
structure (roads, farm yards, etc.). That domestic cats living in urban areas range into natural areas has already
been demonstrated3,25. Our study revealed the magnitude of this halo at the population-level and the highly vari-
able contribution that individuals make to it, with 10% of participant cats accounting for 62% of the non-urban
habitat use. However, because cats in this study lived primarily in an urban setting and individual space utiliza-
tion declines rapidly from each cat’s core use area (Fig. 2), the majority (91%) of the risk of encountering a cat
fell into urban habitat. The relationship between the population-level UD and predation risk to wildlife is likely
modulated by habitat and its configuration within the home range of individual cats. For example, individual
cats living near and using non-urban areas have been reported to have different movement behavior and be more
prone to prey on certain wildlife26,27. It is thus possible that predation risk for some wildlife species is greater in
the peripheral, lower-amplitude regions of the population-level UD, if these represent roaming areas that extend
into non-urban habitat. However, like wildlife studies on p redation28, studies on predation by cats tend to focus
on kill rates—or apparent kill rates—rather than predation rates and thus quantify predation from the perspec-
tive of the predator (number of prey killed or returned by a cat per unit time) instead of that of the prey (risk of
being killed or proportion of the prey population taken). It is unclear to what extent apparent habitat-kill/return
rate relationships translate into spatially-explicit risk for prey (predation rate).
Methods that decrease cat density and home range size/ranging behavior would potentially also reduce the
extent to which the catscape and associated impacts bleed into non-urban areas. Another, likely unpopular,
strategy could be to tolerate medium and large carnivores around urban areas, as these may provide an added
ecological service through culling of roaming and stray cats or impacting cat space-use behavior29–32 by creating
a landscape of f ear33,34. Regarding the latter, it is worth noting that Kays et al.3 found no evidence of movement
restriction of owned cats in response to the presence of a larger predator (coyotes, Canis latrans).
Individual variation. Individual variation in space-use was high among cats in this localized population.
This included variation in home range sizes, the extent to which home ranges included non-urban areas, and the
degree of spatial association with the owner’s home. High intraspecific variation in cat space-use behavior has
been reported by others3,10 and likely propagates to variation in environmental impacts. Substantial individual
variation in space-use and other behaviors poses a critical obstacle for the common approach in wildlife ecol-
ogy of scaling inferences to the population-level from a limited sample of individuals. To be representative, the
sample would have to capture the population-level breadth and distribution of the parameter of interest, which
is difficult to achieve and verify35. Furthermore, investigations targeting individual interactions or the manifesta-
tions thereof (e.g., territory configuration and turn-over) are impeded when the majority of individuals remains
hidden from the observer; the behavior of tagged individuals is interpreted with the sample in mind, whereas in
reality it is influenced by additional, unobserved animals.
Due to individual variation in space-use, mitigation efforts may be more effective if they are customized
based on individual characteristics. Inexpensive and accessible pet tracking devices now make it possible for
most owners to remotely monitor the outdoor movements of their pets. This offers opportunities for cat-specific
mitigation measures that owners can implement based on information about their cat’s movements and in rela-
tion to specific husbandry practices. At a minimum, owners could employ selective containment of cats that
exhibit roaming behavior. Owners could also experiment with and adopt maintenance regimes (diet, behavioral
enrichment36) that reduce roaming behavior of individual cats, even if the impact of these as general interven-
tions may be questionable10.
Scaling‑up monitoring through citizen science. In our study, the synchronous collection of spatial
data on a large proportion of cats in one area was achieved through the participation of the owners of these cats,
Scientific Reports | (2022) 12:5964 | https://doi.org/10.1038/s41598-022-09694-9 5
Vol.:(0123456789)www.nature.com/scientificreports/
that is, citizen scientists. Data collected at or near the population scale can help answer important questions
that remain elusive to studies with small samples or samples scattered over vast areas. Relevant topics concern-
ing domestic cats include the identification of determinants of space-use and movement that take into account
intraspecific interactions and, eventually, measuring the link between space-use and predation pressure exerted.
A particularly important line of inquiry concerns the systematic assessment of the impact of mitigation meas-
ures at the population scale.
Citizen science can be an efficient and cost effective approach for collecting data at scales that are otherwise
difficult to attain. The associated limitations in control and inherent biases may to some extent be estimated and
accounted for by accompanying independent survey methods, such as camera trapping in our study. Citizen
science can also serve as a vehicle for deciding, motivating, informing, and evaluating measures for mitigating
the ecological impacts of cats, as most interventions will need to be implemented by the cat owners themselves.
We agree with Crowley et al.21 that, given the multitude of circumstances faced and attitudes exhibited by cat
owners, multidimensional and customizable mitigation strategies are a more likely path to conservation success
than general policies. We mentioned that the concept of the population-level UD and its characteristics can help
identify measures for mitigating cat impacts through altered overall space-use patterns. However, a conserva-
tion measure’s success hinges not only on its effectiveness in achieving the desired results (e.g., supressed spatial
coverage or reduced predation on wildlife) if implemented, but depends on the willingness of people—in this
case cat owners—to adopt the measure in the first place37. Involving cat owners in research on cat ecology and
behavior provides an opportunity for behavioral prioritization38. This is the process whereby most impactful
behaviors are identified, something that should occur before mitigation strategies are decided upon37. Here, the
catscape can serve another role, namely to relate to cat owners the combined spatial representation of all free
ranging pet cats in and around their neighborhood. We suspect that most owners have not thought about and
are not aware of the significant population their pet is a part of in a spatial sense. Whether this new perspective
and information will prompt owners to recognize the potential ecological implications of their pet as problematic
remains uncertain. There are discouraging reports about the ability of factual information on prey return rates
to sway attitudes regarding negative environmental impacts of cats among cat owners in the UK39.
Conclusions
We can view animal populations as undulating surfaces draped over the landscape and changing with time40.
These surfaces represent the combined intensity of use by all individuals in the population, as well as their
potential impact on and interactions with the environment. As our study demonstrates, this understanding of
populations is useful both from a theoretical and applied perspective. While intensity of use does not necessar-
ily equate risk of predation, use of an area by cats is prerequisite for predation by cats. Studies are needed that
can quantify the link between spatially explicit predation risk and the population-level utilization distribution
of outdoor pet cats. Our investigation ultimately represents a case study on a single local population of cats. We
urge implementation of comparative studies that estimate the population-level utilization distribution for cat
populations with different intrinsic characteristics (e.g., demography, maintenance regimes, proportion sterilized)
and extrinsic configurations (e.g., position along the urban-nature gradient).
Methods
Study area. The study took place in and around Ås, a small (10,725 inhabitants; 4.73 km2 ) university town
in southern Norway made up of campus and a commercial center surrounded by residential areas. The area
from which cats were recruited encompassed 1.1 km2 (Fig. 2, Fig. S1) of residential area (primarily single and
multi-family homes and yards). A fenced railroad dissects the study area (Fig. 2), with the two sides connected
by pedestrian underpasses. The study area is surrounded by a mixture of forest, and agricultural fields, with a
moderately undulating topography.
Cat recruitment. We used several methods to recruit as many cat owners in our study area as possible: flyers
distributed in every residential mailbox in the study area, an advertisement on a local social-media group, and
word-of-mouth. This redundancy in outreach was motivated by the goal to recruit as many of the resident cats
as possible. We also identified potential cat owners that had not registered during the initial recruitment cam-
paign by inquiring about other households with cats in registered participants’ neighborhoods. These additional
households with cats were approached directly with an invitation to participate.
Participants registered for the study through an online registration form, which in addition served as a
questionnaire for collecting basic information about the cat(s) (e.g., number of cats with outdoor access) and
relevant features of the household (e.g., the owner’s contact information). Once registered, participants completed
a follow-up online questionnaire collecting detailed information about each cat and its maintenance.
GPS tracking. GPS tracking took place between May 1 and May 29, 2021. Owners were instructed to affix
the collar with the GPS unit to their cat each time the cat exited the home. We used i-gotU GT-120 GPS units
(Mobile Action Technology, Inc., Taiwan) weighing 26 g and requiring manual download. GPS units were set to
attempt one position fix every 30 seconds while on. Such high-throughput telemetry data are becoming increas-
ingly common and are particularly useful for revealing detailed movement p atterns41. Data were stored on-
board and downloaded by the authors at least once during the tracking period (to ensure proper functioning,
rectify errors in tagging/data collection, backup GPS data) and at the end of it. Participating cat owners were also
provided with a hotline for addressing technical problems and to replace lost GPS units.
Owners were instructed to affix the collar with the GPS unit to their cat each time the cat exited the home
and to keep the units off and charging while the cat was indoors. This was done to a) ensure batteries were kept
Scientific Reports | (2022) 12:5964 | https://doi.org/10.1038/s41598-022-09694-9 6
Vol:.(1234567890)www.nature.com/scientificreports/
charged and b) avoid collecting positions while indoors. However, consistent collaring and collar removal were
not always feasible (especially for cats with free access to the outdoors through a pet door). Inspection of the
resulting data and conversations with owners indicated that some units were kept powered on while cats were
indoors (we attempted to remove these positions, see “Delineation of outdoor activity” below) and that cats
occasionally exited without an active collar.
Camera trapping. We placed one wildlife camera trap with infrared flash in the yards of 47 participating cat
owners. The camera models we used were Browning Dark Ops HD Pro Trail Camera BTC-6HDP (37), Brown-
ing BTC-6HDPX Dark Ops HD Pro (8) and Browning Spec Ops Full HD (2). Cameras were set 0.5–1 m above
the ground and in places that would maximize the probability of recording wildlife and domestic cats entering
or moving across the yard, while also protecting the privacy of neighbours. Cameras were programmed to record
10 s videos each time they were triggered. Cameras were placed roughly one week after the GPS tracking started,
and remained in the gardens for five weeks. Due to memory limitations, cameras were operational for an aver-
age of 22.6 days (sd 12.4). For each cat video, we recorded if the cat wore a GPS collar or not, in order to gauge
GPS-coverage of cat activity in the study area during GPS tracking.
Data analysis. We used R v 4.1.117 for the data processing and the analysis outlined below.
GPS data pre‑processing. GPS data from each cat were subjected to the following sequence of pre-processing
steps, based partially on recommendations by Gupte et al.42 and Morris and Conner43 :
1. Removed positions with an elevation outside the range 0–300 m.
2. Removed positions obtained during the first 2 days of tracking.
3. Removed positions obtained on days where the GPS was picked up for data download.
4. Removed positions with an estimated horizontal position error (EHPE) >= 5000.
Delineation of outdoor activity. Although owners were instructed to remove and switch off the GPS collar
when the cat was indoors, we know from previous surveys (unpublished data) that this was not done reliably
in every household, especially for cats that exited and entered the house freely through a cat flap or similar.
GPS data revealed a high degree of clustering, particularly in the vicinity of the cat’s home. We used R package
GPSeqClus44 to identify sequential position clusters based on a reported gps error = 2 min.
Population‑level utilization distribution. With some modification, we used the approach outlined b y47, and
subsequently followed by49 and50, to construct the population-level utilization distribution (UD) from individual
UDs (BBMM). This involved the following steps (see also Fig. 1):
1. Resample individual UD rasters to align (same spatial extent and resolution).
2. Re-scale cell values in individual UD rasters to sum to the average proportion of a day the cat was tracked
outdoors on days with outdoor position data. This assumes that (a) cats were tracked for the entire time they
spent outdoors and (b) on days without any GPS tracking data, cats spent an average amount of time out-
doors, but were not tracked. We know from simultaneous camera trapping data that the former assumption
was violated, whereas the latter assumption likely held, based on communications with owners. In general,
this means that outdoor utilization was underestimated and that the final population-level catscape represents
a minimum use scenario.
3. Aggregate individual UD rasters into a population-level catscape by summing cell values across the stack of
92 weighted individual UD r asters47. Unlike47, we did not perform further scaling of the resulting raster to
sum to 1. This allows comparison of population-level UDs within (e.g., day vs. night) and between popula-
tions in terms of both their magnitude and shape.
Ethics declarations. We used data generated by commercially available GPS-trackers intended for cats and
similar-sized pets that were voluntarily deployed by individual cat owners as parts of their private cat mainte-
nance regimes. No cats were handled by the research team and pet-tracking was outside the purview of the Nor-
wegian University of Life Sciences animal use committee and the Norwegian government agency (Norwegian
Food Safety Authority; Mattilsynet) responsible for approval of protocols involving experiments with animals.
All methods were carried out in accordance with relevant guidelines and regulations at the Norwegian Univer-
sity of Life Sciences and according to Norwegian law.
Scientific Reports | (2022) 12:5964 | https://doi.org/10.1038/s41598-022-09694-9 7
Vol.:(0123456789)www.nature.com/scientificreports/
Data availability
The cat GPS data used in this manuscript are available on GitHub (https://github.com/richbi/CatTrack_public).
Note that a random offset has been added to positions in order to protect the privacy of the owners of the cats.
Received: 7 December 2021; Accepted: 25 March 2022
References
1. Seymour, C. L. et al. Caught on camera: The impacts of urban domestic cats on wild prey in an African city and neighbouring
protected areas. Glob. Ecol. Conserv. 23, e01198 (2020).
2. Mori, E. et al. License to Kill? Domestic Cats Affect a Wide Range of Native Fauna in a Highly Biodiverse Mediterranean Country.
Front. Ecol. Evol. 7, 477 (2019).
3. Kays, R. et al. The small home ranges and large local ecological impacts of pet cats. Anim. Conserv. 23, 516–523 (2020).
4. Loss, S. R., Will, T. & Marra, P. P. The impact of free-ranging domestic cats on wildlife of the United States. Nat. Commun. 4, 1396
(2013).
5. Van Heezik, Y., Smyth, A., Adams, A. & Gordon, J. Do domestic cats impose an unsustain386 able harvest on urban bird popula-
tions?. Biol. Conserv. 143, 121–130 (2010).
6. Woods, M., McDonald, R. A. & Harris, S. Predation of wildlife by domestic cats Felis catus in Great Britain. Mammal Rev. 33,
174–188 (2003).
7. Li, Y. et al. Estimates of wildlife killed by free-ranging cats in China. Biol. Conserv. 253, 108929 (2021).
8. Barratt, D. G. Home range size, habitat utilisation and movement patterns of suburban and farm cats Felis catus. Ecography 20,
271–280 (1997).
9. Moseby, K. E., Stott, J. & Crisp, H. Movement patterns of feral predators in an arid environment–implications for control through
poison baiting. English. Wildl. Res. 36, 422–435 (2009).
10. Hall, C. M. et al. Factors determining the home ranges of pet cats: A meta-analysis. Biol. Conserv. 203, 313–320 (2016).
11. Castañeda, I. et al. Trophic patterns and home-range size of two generalist urban carnivores: A review. J. Zool. 307, 79–92 (2019).
12. Hebblewhite, M. & Haydon, D. T. Distinguishing technology from biology: A critical review of the use of GPS telemetry data in
ecology. Philos. Trans. R. Soc. B Biol. Sci. 365, 2303–2312 (2010).
13. Allen, A. M. et al. Scaling up movements: From individual space use to population patterns. Ecosphere 7, e01524 (2016).
14. Trouwborst, A., McCormack, P. C. & Martínez Camacho, E. Domestic cats and their impacts on biodiversity: A blind spot in the
application of nature conservation law. People Nat. 2, 235–250 (2020).
15. Sims, V., Evans, K. L., Newson, S. E., Tratalos, J. A. & Gaston, K. J. Avian assemblage structure and domestic cat densities in urban
environments. Divers. Distrib. 14, 387–399 (2008).
16. Lepczyk, C. A., Mertig, A. G. & Liu, J. Landowners and cat predation across rural-to-urban landscapes. Biol. Conserv. 115, 191–201
(2004).
17. R Core Team. R: A Language and Environment for Statistical Computing R Foundation for Statistical Computing (Vienna, Austria,
2021).
18. Heggøy, O. & Shimmings, P. Huskattens predasjon på fugler i Norge. En vurdering basert på en litteraturgjennomgang tech. rep.
36 (2018).
19. Morgan, S. et al. Urban cat (Felis catus) movement and predation activity associated with a wetland reserve in New Zealand. Wildl.
Res. 36, 574–580 (2009).
20. Calver, M., Grayson, J., Lilith, M. & Dickman, C. Applying the precautionary principle to the issue of impacts by pet cats on urban
wildlife. Biol. Conserv. 144, 1895–1901 (2011).
21. Crowley, S., Cecchetti, M. & Mcdonald, R. Diverse perspectives of cat owners indicate bar riers to and opportunities for managing
cat predation of wildlife. Front. Ecol. Environ. 18, 544–549 (2020).
22. Treves, A., Krofel, M., Ohrens, O. & van Eeden, L. M. Predator control needs a standard of unbiased randomized experiments with
cross-over design. Front. Ecol. Evol. 7, 462 (2019).
23. Ferreira, G. A., Machado, J. C., Nakano-Oliveira, E., Andriolo, A. & Genaro, G. The effect of castration on home range size and
activity patterns of domestic cats living in a natural area in a protected area on a Brazilian island. Appl. Anim. Behav. Sci. 230,
105049 (2020).
24. Bengsen, A. J. et al. Feral cat home-range size varies predictably with landscape productivity and population density. J. Zool. 298,
112–120 (2016).
25. López-Jara, M. J. et al. Free-roaming domestic cats near conservation areas in Chile: Spatial movements, human care and risks for
wildlife. Perspect. Ecol. Conserv. 19, 387–398 (2021).
26. Gillies, C. & Clout, M. The prey of domestic cats (Felis catus) in two suburbs of Auckland City, New Zealand. J. Zool. 259, 309–315
(2003).
27. Pirie, T. J., Thomas, R. L. & Fellowes, M. D. E. Pet cats (Felis catus) from urban boundaries use different habitats, have larger home
ranges and kill more prey than cats from the suburbs. Landsc. Urban Plan. 220, 104338 (2022).
28. Vucetich, J. A., Hebblewhite, M., Smith, D. W. & Peterson, R. O. Predicting prey population dynamics from kill rate, predation
rate and predator-prey ratios in three wolf-ungulate systems. J. Anim. Ecol. 80, 1236–1245 (2011).
29. Kennedy, M., Phillips, B. E. N. L., Legge, S., Murphy, S. A. & Faulkner, R. A. Do dingoes suppress the activity of feral cats in northern
Australia?. Austral Ecol. 37, 134–139 (2012).
30. Crooks, K. R. & Soule, M. E. Mesopredator release and avifaunal extinctions in a fragmented system. English. Nature 400, 563–566
(1999).
31. Ferreira, J. P., Leita, O. I., Santos-Reis, M. & Revilla, E. Human-related factors regulate the spatial ecology of domestic cats in
sensitive areas for conservation. PLOS ONE 6, e25970 (2011).
32. Brook, L. A., Johnson, C. N. & Ritchie, E. G. Effects of predator control on behaviour of an apex predator and indirect consequences
for mesopredator suppression. J. Appl. Ecol. 49, 1278–1286 (2012).
33. Laundre, J. W., Hernandez, L. & Altendorf, K. B. Wolves, elk, and bison: Reestablishing the “landscape of fear’’ in Yellowstone
National Park, USA. English. Can. J. Zool. 79, 1401–1409 (2001).
34. Ritchie, E. G. & Johnson, C. N. Predator interactions, mesopredator release and biodiversity conservation. English. Ecol. Lett. 12,
9820–998 (2009).
35. Milleret, C. et al. GPS collars have an apparent positive effect on the survival of a large carnivore. Biol. Lett. 17, 20210128 (2021).
36. Cecchetti, M., Crowley, S. L., Goodwin, C. E. D. & McDonald, R. A. Provision of high meat content food and object play reduce
predation of wild animals by domestic cats Felis catus. Curr. Biol. 31, 1107-1111.e5 (2021).
37. Linklater, W., Farnworth, M., van Heezik, Y., Stafford, K. & Macdonald, E. Prioritizing cat owner behaviors for a campaign to
reduce wildlife depredation. Conserv. Sci. Pract. 1, 1:e29 (2019).
38. Selinske, M. J. et al. Identifying and prioritizing human behaviors that benefit biodiversity. Conserv. Sci. Pract. 2, e249 (2020).
Scientific Reports | (2022) 12:5964 | https://doi.org/10.1038/s41598-022-09694-9 8
Vol:.(1234567890)www.nature.com/scientificreports/
39. McDonald, J. L., Maclean, M., Evans, M. R. & Hodgson, D. J. Reconciling actual and perceived rates of predation by domestic cats.
Ecol. Evol. 5, 2745–2753 (2015).
40. Bischof, R. et al. Estimating and forecasting spatial population dynamics of apex predators using transnational genetic monitoring.
Proc. Natl. Acad. Sci. 117, 30531–30538 (2020).
41. Bischof, R., Gjevestad, J. G. O., Ordiz, A., Eldegard, K. & Milleret, C. High frequency GPS bursts and path-level analysis reveal
linear feature tracking by red foxes. Sci. Rep. 9, 8849 (2019).
42. Gupte, P. R. et al. A guide to pre-processing high-throughput animal tracking data. J. Anim. Ecol. 91, 287–307 (2022).
43. Morris, G. & Conner, L. Assessment of accuracy, fix success rate, and use of estimated horizontal position error (EHPE) to filter
inaccurate data collected by a common commercially available GPS logger. PLoS ONE 12, e0189020 (2017).
44. Clapp, J. G., Holbrook, J. D. & Thompson, D. J. GPSeqClus: An R package for sequential clustering of animal location data for
model building, model application and field site investigations. Methods Ecol. Evol. 12, 787–793 (2021).
45. Nielson, M., R., Sawyer, H. & McDonald, T. L. BBMM: Brownian Bridge Movement Model R Package Version 3.0 (2013).
46. Horne, J. S., Garton, E. O., Krone, S. M. & Lewis, J. S. Analyzing animal movements using Brownian bridges. Ecology 88, 2354–2363
(2007).
47. Sawyer, H., Kauffman, M. J., Nielson, R. M. & Horne, J. S. Identifying and prioritizing ungulate migration routes for landscape-level
conservation. Ecol. Appl. 19, 2016–2025 (2009).
48. Fischer, J. W., Walter, W. D. & Avery, M. L. Brownian bridge movement models to characterize birds’ home ranges. Condor 115,
298–305 (2013).
49. Seidler, R., Long, R., Berger, J., Bergen, S. & Beckmann, J. Identifying impediments to long-distance mammal migrations. Conserv.
Biol. 29 (2014).
50. Collins, G. Seasonal distribution and routes of pronghorn in the Northern Great Basin. West. N. Am. Nat. 76, 101–112 (2016).
Acknowledgements
We thank participating owners for making their pets available for this study and performing the tasks necessary
for data collection. We also thank F. Sarfi, W. Fan, B. Bachman, G.S. Leikanger, C. Glosli, and R. Steen for help
with earlier bouts of cat monitoring and assistance with developing the protocols and methods that we built upon
in this study. We thank M. Wonderland for assistance with field work and processing of camera trap data and P.
Dupont for cat image editing. The study was funded by the Research Council of Norway (projects 283741 and
286886). We thank A. Semper-Pascual, J. Swenson, and A. Vallejo for comments on the manuscript.
Author contributions
R.B. and T.H. conceived the idea and designed the study, with input from A.K. and N.R.H. R.B., T.H., and N.R.H.
coordinated the data collection. N.R.H., Ø.S.N., and L.P. conducted the field work and collected the data. Ø.S.N.
and L.P. processed the camera trap data. R.B. conducted the analysis and wrote the first draft of the manuscript.
All authors contributed to subsequent drafts and gave final approval for publication.
Competing interests
The authors declare no competing interests.
Additional information
Supplementary Information The online version contains supplementary material available at https://doi.org/
10.1038/s41598-022-09694-9.
Correspondence and requests for materials should be addressed to R.B.
Reprints and permissions information is available at www.nature.com/reprints.
Publisher’s note Springer Nature remains neutral with regard to jurisdictional claims in published maps and
institutional affiliations.
Open Access This article is licensed under a Creative Commons Attribution 4.0 International
License, which permits use, sharing, adaptation, distribution and reproduction in any medium or
format, as long as you give appropriate credit to the original author(s) and the source, provide a link to the
Creative Commons licence, and indicate if changes were made. The images or other third party material in this
article are included in the article’s Creative Commons licence, unless indicated otherwise in a credit line to the
material. If material is not included in the article’s Creative Commons licence and your intended use is not
permitted by statutory regulation or exceeds the permitted use, you will need to obtain permission directly from
the copyright holder. To view a copy of this licence, visit http://creativecommons.org/licenses/by/4.0/.
© The Author(s) 2022
Scientific Reports | (2022) 12:5964 | https://doi.org/10.1038/s41598-022-09694-9 9
Vol.:(0123456789)You can also read