Macquarie Group Limited - Presentation to Debt Investors May 2020
←
→
Page content transcription
If your browser does not render page correctly, please read the page content below

Macquarie Group Limited
Presentation to Debt Investors
May 2020
MACQUARIE 2020
Macquarie I Presentation to Debt Investors I macquarie.com                                                                   Overview        MGL results for the full year ended 31 March 2020           Outlook        Capital and funding         Appendices

Disclaimer
This information has been prepared on a strictly confidential basis by Macquarie Group Limited ABN 94 122 169 279 (“Macquarie”) and may neither be reproduced in whole nor in part, nor may any of its contents be divulged, to any third party without the prior
written consent of Macquarie. Information in this presentation, including forecast financial information, should not be considered as legal, financial, accounting, tax or other advice, or a recommendation to investors or potential investors in relation to holding,
purchasing or selling securities or other financial products or instruments and does not take into account your particular investment objectives, financial situation or needs. Before acting on any information you should consider the appropriateness of the information
having regard to these matters, any relevant offer document and in particular, you should seek independent financial advice. All securities and financial product or instrument transactions involve risks, which include (among others) the risk of adverse or
unanticipated market, financial or political developments and, in international transactions, currency risk.

The information in this presentation does not constitute an offer to sell, or a solicitation of an offer to buy, any securities in the United States. Any securities of MGL or its subsidiaries to be offered and sold have not been, and will not be, registered under the
Securities Act of 1933 (the “Securities Act”), or the securities laws of any state or other jurisdiction of the United States. Accordingly, any such securities may not be offered or sold, directly or indirectly, unless they have been registered under the Securities Act or
are offered and sold pursuant to an exemption from, or in a transaction not subject to, such registration requirements. This document is not investment advice and does not constitute ‘investment research’ as defined in article 36(1) of Commission Delegated
Regulation 2017/565 supplementing Directive 2014/65/EU, as amended. It has not been prepared in accordance with the legal requirements designed to promote the independence of investment research and it is not subject to any prohibition on dealing ahead of
the dissemination of investment research.

This information has been prepared in good faith and is not intended to create legal relations and is not binding on Macquarie under any circumstances whatsoever. To the extent permitted by law, neither Macquarie nor its related bodies corporate (the “Macquarie
Group”, ”Group”) nor any of its associates, directors, officers or employees, or any other person (together, “Persons”), makes any promise, guarantee, representation or warranty (express or implied) to any person as to the accuracy or completeness of this
information, or of any other information, materials or opinions, whether written or oral, that have been, or may be, prepared or furnished by Macquarie Group, including, without limitation, economic and financial projections and risk evaluation. No responsibility or
liability whatsoever (in negligence or otherwise) is accepted by any person for any errors, mis-statements or omissions in this information or any other information or materials. Without prejudice to the foregoing, neither the Macquarie Group, nor any Person shall
be liable for any loss or damage (whether direct, indirect or consequential) suffered by any person as a result of relying on any statement in or omission from this information. The information may be based on certain assumptions or market conditions, and if those
assumptions or market conditions change, the information may change. No independent verification of the information has been made. Any quotes given are indicative only.

Other than Macquarie Bank Limited ABN 46 008 583 542 (“MBL”), any Macquarie group entity noted in this document is not an authorised deposit-taking institution for the purposes of the Banking Act 1959 (Commonwealth of Australia). That entity’s obligations do
not represent deposits or other liabilities of MBL and MBL does not guarantee or otherwise provide assurance in respect of the obligations of that entity, unless noted otherwise. Each of MBL, acting through its London branch, and Macquarie Bank International
Limited, is authorised and regulated by the Financial Conduct Authority and the Prudential Regulation Authority to carry on banking business in the United Kingdom. MBL, acting through its Singapore Branch, is authorised and regulated by the Monetary Authority
of Singapore to carry out banking business in Singapore. MBL, acting through its Hong Kong branch, is authorised and regulated by the Hong Kong Monetary Authority to carry on banking business in Hong Kong. MBL, acting through its Dubai International
Financial Centre Branch, is authorised and regulated by the Dubai Financial Services Authority to carry out banking business in Dubai International Financial Centre. MBL maintains Representative Offices in Illinois, New York and Texas, but is not authorized to
conduct business in the US.

The Macquarie Group or its associates, directors, officers or employees may have interests in the financial products referred to in this information by acting in various roles including as provider of corporate finance, underwriter or dealer, holder of principal positions,
broker, lender or adviser and may receive fees, brokerage or commissions for acting in those capacities. In addition, the Macquarie Group and its associates, directors, officers or employees may buy or sell the financial products as principal or agent and as such
may effect transactions which are not consistent with any recommendations in this information.

Unless otherwise specified all information is at 31 March 2020.

Certain financial information in this presentation is prepared on a different basis to the Macquarie Group Limited Financial Report, which is prepared in accordance with Australian Accounting Standards. Where financial information presented within this presentation
does not comply with Australian Accounting Standards, a reconciliation to the statutory information is provided.

This presentation provides further detail in relation to key elements of Macquarie Group Limited’s financial performance and financial position. It also provides an analysis of the funding profile of the Group because maintaining the structural integrity of the Group's
balance sheet requires active management of both asset and liability portfolios. Active management of the funded balance sheet enables the Group to strengthen its liquidity and funding position.

This presentation may contain forward looking statements including statements regarding our intent, belief or current expectations with respect to Macquarie’s businesses and operations, market conditions, results of operation and financial condition, capital
adequacy, specific provisions and risk management practices. Readers are cautioned not to place undue reliance on these forward looking statements. Macquarie does not undertake any obligation to publicly release the result of any revisions to these forward
looking statements to reflect events or circumstances after the date hereof to reflect the occurrence of unanticipated events. While due care has been used in the preparation of forecast information, actual results may vary in a materially positive or negative
manner. Forecasts and hypothetical examples are subject to uncertainty and contingencies outside Macquarie’s control. Past performance is not a reliable indication of future performance.

Any additional financial information in this presentation which is not included in the Macquarie Group Limited Financial Report was not subject to independent audit or review by PricewaterhouseCoopers. Numbers are subject to rounding and may not fully
reconcile.
                                                                                                                                                                                                                                                                               2
Agenda
Overview 01
MGL results for the full year ended 31 Mar 2020 02
Outlook 03
Capital and Funding 04
Appendices 05
MACQUARIE 2020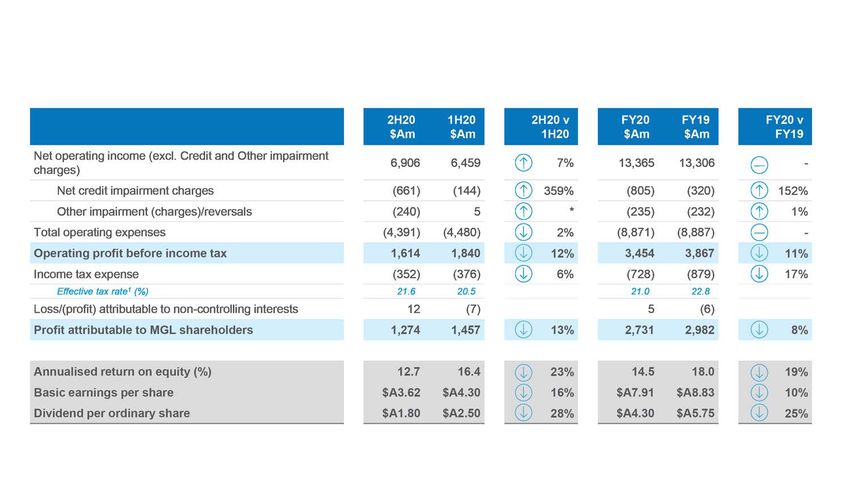
01
Overview
Presentation to Debt Investors
May 2020
MACQUARIE 2020
Macquarie I Presentation to Debt Investors I macquarie.com                                                                                 Overview          MGL results for the full year ended 31 March 2020                   Outlook          Capital and funding            Appendices

Macquarie overview
Global diversified financial group providing clients with asset management and finance, banking, advisory and
risk and capital solutions across debt, equity and commodities
Macquarie Group overview1                                                                                                                                                 Global presence2

ANNUITY-STYLE                                                         ~63%                 MARKETS-FACING                           ~37%
                                                                                                                                                                                                                               EMEA
                                                                                                                                                                                                                             13 markets
                                                                                                                                                                                             Americas                                                        Asia
                                                                                                                                                                                             5 markets                                                    11 markets

Macquarie Asset                                                                   Commodities and
                                                                                   Global Markets                                                                                                                                                                      ANZ
   Management
                                       Banking and                      ~9%                           ~23%                                                                                                                                                          2 markets

            ~40%                  Financial Services
                                                                                                               Macquarie Capital
                                                 ~14%
                                                                                                                              ~14%

                                                                                            $A606.9b                                                MBL                                                                                                15,849 employees2,
        FY20 net profit $A2,731m                                                                                                                                                         APRA primary regulator
                                                                            assets under management                                                A/A2/A+                                                                                                      operating in
        FY19 net profit $A2,982m                                                                                                                                                                  for MBL & MGL
                                                                                 as at 31 Mar 20                                                 credit rating                                                                                                  31 markets

 1. Net profit contribution is management accounting profit before unallocated corporate costs, profit share and income tax. Bar chart is based on FY20 net profit contribution from operating groups as reported at the results announcement on 8 May 2020. 2. Employees and global locations as at 31
 Mar 20. Includes staff employed in certain operationally segregated subsidiaries throughout the presentation                                                                                                                                                                                             5
Macquarie I Presentation to Debt Investors I macquarie.com                                                                               Overview         MGL results for the full year ended 31 March 2020                  Outlook         Capital and funding           Appendices

   Diversification by region
International income 67% of total income1
Total staff2 15,849, International staff 58% of total

1. Net operating income excluding earnings on capital and other corporate items. 2. Includes staff employed in certain operationally segregated subsidiaries throughout the presentation. 3. Includes New Zealand. 4. Includes people employed through MIRA-managed fund assets and investments
where Macquarie Capital holds a significant influence.                                                                                                                                                                                                                                            6

Macquarie I Presentation to Debt Investors I macquarie.com Overview MGL results for the full year ended 31 March 2020 Outlook Capital and funding Appendices
50 years of profitability
2.0
$Am
Hill Samuel UK opens
1.6 branch office in Sydney
1.2 Currency
Recession Crisis
0.8
0.4
-
1969 1970 1971 1972 1973 1974 1975 1976 1977 1978 1979 Hills Motorway
Global real Mortgage securitisation
$Am
100 estate crash
US banks
capital London Recession
80 First listed Stock
losses office
property trust market opens
60 Global debt Savings and
Enter crash
crisis loan crisis
$A floated MBL stockbroking
40 US recession established
20
-
1980 1981 1982 1983 1984 1985 1986 1987 1988 1989 1990 1991 1992 1993 1994 1995
AWAS aircraft GLL
Orion Securities ILFC
operating lease ValueInvest
CIT Systems Leasing GMAC
portfolio Conergy
3,500 Group Restructure Presidio
$Am
COVID-19
Significant Market Disruption Innovest Cargill UK GIB
GE Capital’s Esanda
3,000 REGAL
Delaware Premium portfolio
Thames Water FPK Funding business
2,500 Giuliani Capital Blackmont European
GFC Sal Opp. rail leasing
2,000 ING Constellation
Asian Russian BT Dot 9/11 Acquired Tristone Onstream
1,500 Financial Debt Australia Com US Sydney
MBL Crisis acquired Recession Airport SARS
Crisis crash
1,000 listed
500
-
1996 1997 1998 1999 2000 2001 2002 2003 2004 2005 2006 2007 2008 2009 2010 2011 2012 2013 2014 2015 2016 2017 2018 2019 2020
Above dates refer to Macquarie financial years. 7
Macquarie I Presentation to Debt Investors I macquarie.com                                                   Overview    MGL results for the full year ended 31 March 2020      Outlook       Capital and funding   Appendices

  Macquarie’s response to COVID-19
  Employees                                                  Clients                                                    Portfolio Companies                                           Community

 • Globally consistent and coordinated move to               • Personal Banking clients able to defer                   • Working with MIRA and Macquarie Capital                    • $A20m allocation to Macquarie Group
    working remotely, supported by ongoing                     mortgage, overdraft, credit card or vehicle loan           portfolio companies to ensure robustness of                     Foundation to help combat COVID-19 and
    commitment to flexible working                             repayments for up to six months without                    business continuity planning, financial                         provide relief for its impacts
                                                               penalty or negative impact to their credit score           resilience & employee wellbeing, including
 • Over 98% of staff working remotely with no                                                                             projects under construction
                                                                                                                                                                                     • $A2m donation to The Global FoodBanking
    notable interruption to client service                   • Business Banking clients able to defer loan                                                                                Network to address food security needs; $A1m
 • Existing systems have been resilient to large-              repayments for up to six months for all loans            • Maximising remote working while maintaining                     to the Burnett Institute for its study into the
                                                               up to $A10m                                                essential community services and connecting                     preventative benefits of isolation and physical
    scale remote working, reflecting long-term
                                                                                                                          best practice across assets, industries                         distancing; $A3.75m to nine non-profits
    investment in technology                                 • 3-6-month payment deferrals available to                   and regions                                                     focused on direct relief efforts globally
                                                               vehicle lease customers
 • Candidate engagement, selection, onboarding                                                                          • Capacity upgrades to MIRA-managed digital                  • Foundation continues to match staff giving
    and training of new hires (including graduates           • Enhanced approaches to support                             infrastructure assets have left them able to                    and fundraising to maintain support to
    and interns) has continued without interruption            vulnerable customers                                       handle significant activity increases resulting                 existing non-profit partners
    through virtual communications
                                                             • Specialised and Asset Finance (SAF)                        from widespread remote working
                                                                                                                                                                                     • BFS engaging and hiring workers furloughed
 • Flexible leave options available to staff to                extended lending relief to SME clients to help
                                                                                                                        • Examples of portfolio company initiatives: AGS                  by other employers to meet increased short-
    ensure remote working can be balanced with                 support business cash flows
                                                                                                                          Airport’s carparks repurposed as COVID-19                       term customer service demand
    family and carer responsibilities
                                                             • Providing expertise, advice and capital                    testing centres in the UK; Spain’s healthcare
                                                                                                                                                                                     • CGM sourcing computer equipment for North
 • Enhanced wellbeing, communications and                      solutions to assist clients and partners in                workers receiving Personal Protective
                                                                                                                                                                                          American educators
    training programs to support staff                         navigating COVID-19 and related market                     Equipment from CLH and free parking from
                                                               disruption                                                 Empark; Penn Foster training nurses in                     • Macquarie portfolio companies: Achieve3000
                                                                                                                          COVID-19 testing, and Dovel Technologies                        offering 2m low income students in the US with
                                                                                                                          using analytics to review antiviral clinical trials             free access to its education platform; INEA
                                                                                                                                                                                          providing free internet to teachers in Poland

                       Staff working remotely                    Clients accessing assistance1                          Daily users of essential services                                                    COVID-19 donation

                                             >98%                                            ~12%                                                     ~100m                                                         $A20m
  1. BFS, by loan balance as at 30 Apr 20.                                                                                                                                                                                                  8
Macquarie I Presentation to Debt Investors I macquarie.com Overview MGL results for the full year ended 31 March 2020 Outlook Capital and funding Appendices
Macquarie funding structure
MGL and MBL are Macquarie’s two
primary external funding vehicles which
have separate and distinct funding,
capital and liquidity management
arrangements
MBL provides funding to the Banking
Group
MGL provides funding predominantly to
the Non-Bank Group
The Bank Group comprises BFS and CGM (excluding certain assets of the Credit Markets business, certain activities of the Cash Equities business and the Commodity Markets and Finance business and some other less financially significant activities which are undertaken from within the Non-Bank
Group). The Non-Bank Group comprises MacCap, MAM and certain assets of the Credit Markets business, certain activities of the Cash Equities business and the Commodity Markets and Finance business and some other less financially significant activities of CGM. 9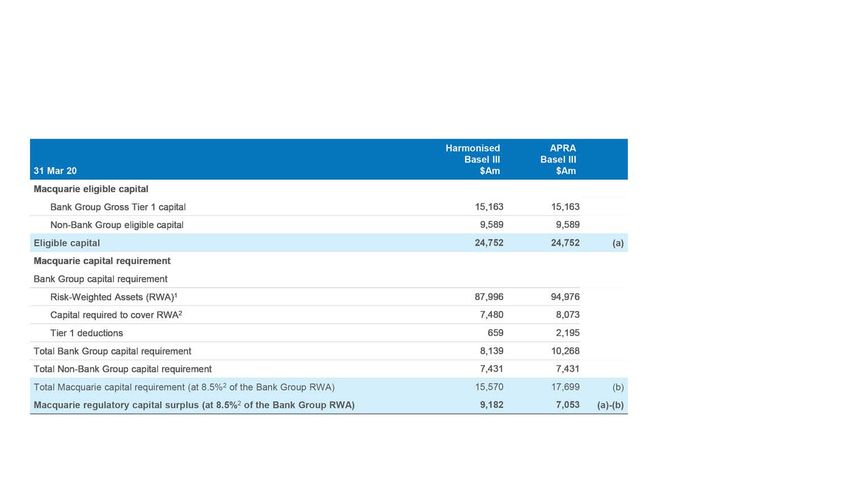
Macquarie I Presentation to Debt Investors I macquarie.com                             Overview            MGL results for the full year ended 31 March 2020                           Outlook           Capital and funding                Appendices

Macquarie Asset
Management                                                                      MIM AUM $A382.6b3
Actively manages money for investors across
multiple asset classes                                                          MIRA AUM $A223.1b3

                     Net profit contribution
                                                                                     No.1 infrastructure                                           150+ infrastructure and real assets used by
     40%       2
                     FY191 $A1,872 million
                                                                      16%                                                                          ~100 million people every day
                     FY20 $A2,177 million
                         2                                            on FY19        manager globally4

                                                                                                                                                   MIRA grew equity under
                                                                                                                                                   management7 to
                                                                                                                                                                                                                   $A20.1b          of new
                                                                                                                                                                                               17%                 equity raised (including
                                                                                     Top 50 global                                                 $A149.3b                                    on Mar 19
                                                                                                                                                                                                                   $A8.9b in 4Q20) for a
Equities Fixed income Multi-asset Infrastructure Renewables                          asset manager5                                                                                                                diverse range of funds,
                                                                                                                                                                                                                   products and solutions
                                                                                                                                                   MIRA invested over                                              across the platform
                                                                                                                                                   $A21.3b                          of equity
  Agriculture       Real Estate       Transportation
                                         Finance
                                                             Private Credit          Top 50 US                                                                                                                     69% of AUM
                                                                                     active mutual fund                                                                                                            outperforming their relative
                                                                                                                                                   $A25.1b                          of equity to                   benchmarks on a three-
                                                                                     manager6                                                      deploy in MIRA7                                                 year basis7
                                                                                1. Based on reclassified FY19 net profit contribution from operating groups.

                        $A605.7 billion                                         2. Based on FY20 net profit contribution from operating groups. Net profit contribution is management accounting profit before unallocated corporate costs, profit share and income tax.
                                                                                3. Macquarie Asset Management AUM at 31 March 2020.
                                                                                4. Based on AUM. IPE Real Assets Top 75 Infrastructure Investment Managers 2019, published in July/August 2019.
                                                                                5. P&I Largest Money Managers 2019.
                        assets under management3                                6. At 31 March 2020. Simfund Fund Family AUM (excludes passive/index funds)..
                                                                                7. As at 31 March 2020.

                                                                                                                                                                                                                                                                           10
Macquarie I Presentation to Debt Investors I macquarie.com Overview MGL results for the full year ended 31 March 2020 Outlook Capital and funding Appendices
Banking and
Financial Services
A technology-driven Australian
retail bank and wealth manager
A leading Australian
Net profit contribution 10%
vehicle financier3 $A13.7 billion on Mar 19
14% 2
FY191 $A756 million
2% 475,000+ Australian vehicle finance
FY20 $A770 million
2 on FY19
portfolio6
$A79.1 billion 8%
on Mar 19 $A9.0 billion 8%
on Mar 19
Funds on platform4 Business banking loan portfolio3
Personal Wealth Business 20%
banking management banking $A63.9 billion on Mar 19
Australia’s 1st
open banking platform gives
Credit cards Investments Property services total BFS deposits5
Home loans Financial advice Professional services customers control over their
Bank accounts Wrap
data
$A52.1 billion 35%
on Mar 19
Award winning
home loans3 digital banking offering7
More than
1. Based on reclassified FY19 net profit contribution from operating groups.
1.6 million
Australian clients3
2. Based on FY20 net profit contribution from operating groups. Net profit contribution is management accounting profit before unallocated corporate costs, profit share and income tax.
3. As at 31 March 2020
4. As at 31 March 2020. Funds on platform includes Macquarie Wrap and Vision.
5. As at 31 March 2020. BFS deposits exclude corporate/wholesale deposits.
6. As at 31 March 2020. Includes general plant and equipment.
7. Winner in 2020 Mozo Experts Choice Awards for Exceptional Everyday Account, Excellent Banking App and Internet Banking / Macquarie Transaction account awarded a Canstar 5 star
rating for outstanding value travel debit card / Winner in the 2019 Mozo Experts Choice Awards for Internet Banking and Exceptional Everyday Account / Winner in the 2018 Mozo Experts 11
Choice Awards in the Travel Money/International Money Transfer categoryMacquarie I Presentation to Debt Investors I macquarie.com Overview MGL results for the full year ended 31 March 2020 Outlook Capital and funding Appendices
Commodities and
Global Markets
Provides clients with access to markets,
financing, financial hedging, research and market
analysis and physical execution
No.2 physical gas $A8.5 billion
Net profit contribution marketer in North America3 asset finance portfolio6
32% 2
FY19 $A1,743 million
1
FY202 $A1,746 million
0%
on FY19 ~5,000 Unique client 10 million+
relationships
meters provided to
2 million+ homes and businesses7
smartphones leased
worldwide to telcos4 65% Of the
30 + 20 + 15 portfolio represents recurring income
years
in metals,
years
in technology,
years
in energy,
Natural Gas/LNG
House of the Year5
agriculture, equities,
futures and FX
media and
telecoms (TMT)
renewables and
sustainability 60-70%
Research House Of businesses have low correlation
of the Year5 with each other
Market trading across
200+
1. Based on reclassified FY19 net profit contribution from operating groups.
2. Based on FY20 net profit contribution from operating groups. Net profit contribution is management accounting profit before unallocated corporate costs, profit share and income tax.
3. Platts Q4 – March 2020.
4. At 31 March 2020. SAF TMT origination data
5. 2019 Energy Risk Awards.
products in 25+ market segments 6. At 31 March 2020 in the Specialised and Asset Finance division.
7. At 31 March 2020, largest independent meter funder in UK, not part of a distribution network or vertically integrated utility.
12Macquarie I Presentation to Debt Investors I macquarie.com Overview MGL results for the full year ended 31 March 2020 Outlook Capital and funding Appendices
Macquarie
Capital
Advises and invests alongside clients
and partners to realise opportunity
Net profit contribution No.1 M&A for completed Global leader
deals in ANZ4
14% 2
FY19 $A1,774 million
1
57%
in green energy
FY20 $A755 million
2 on FY19 No.1 Global Infrastructure and
250+ green energy projects
Renewables Financial adviser5
under development or construction
Infrastructure Green Energy Technology Telecoms & Media No.1 Global Power European Renewables Deal of
Financial adviser6
the Year East Anglia ONE8
Resources Real estate Industrials Healthcare
$A0.7b Project of the Year and Financial
Green investments realised in FY207 Excellence Award WestConnex9
Consumer, Aerospace, Defence
Financial
institutions Gaming & Leisure
Services
& Gov. Services $A1.5b Asia Pacific Transport Deal
New Green investments in FY207 of the Year Cross River Rail10
1. Based on reclassified FY19 net profit contribution from operating groups.
$A319 billion 2. Based on FY20 net profit contribution from operating groups. Net profit contribution is management accounting profit before unallocated corporate costs, profit share and income tax.
3. Source: Dealogic and IJGlobal for Macquarie Group completed M&A, balance sheet investments, ECM and DCM transactions converted at the relevant report date. Deal values
reflect the full transaction value and not an attributed value. 4. Refinitiv (FY20, No.1 for completed deals in ANZ by deal count)
5. Inspiratia (CY19, by deal count and transaction volume). 6. Inframation (CY19 by deal value).
completed deals in FY203 7. Carrying value of balance sheet investments as at 31 Mar 20.
8. Infrastructure Investor Awards 2019
9. Infrastructure Partnerships Australia (IPA) 2019 National Infrastructure Awards. 13
10. PFI Awards 2019.Macquarie I Presentation to Debt Investors I macquarie.com Overview MGL results for the full year ended 31 March 2020 Outlook Capital and funding Appendices
Environmental, Social and Governance (ESG)
Macquarie’s ESG commitment reflects our responsibility to clients, shareholders, communities, our
people and the environment in which we operate
ESG Scope
Building on our principles of opportunity, accountability and integrity, Macquarie’s ESG approach is structured around focus areas which reflect the
risks and opportunities identified by the business and the issues of interest to our stakeholders
Environment Social Governance
• Investing in sustainability solutions and • Investing in social infrastructure • Strong corporate governance
supporting the global energy transition
• Actively managing social risks including • Ethical conduct by staff
• Actively managing environmental risks human rights and modern slavery risk
• Customer advocacy
including climate change risks
• Providing a diverse, inclusive workplace
• Whistleblowing
• Engaging in climate leadership initiatives
• Improving work health and safety
such as GCA, CFLI1 and RE100 • Anti bribery and anti corruption
performance across Macquarie and
• Supporting TCFD, UN PRI and other Macquarie-managed assets • Anti money laundering
external ESG standards2
• Engaging Macquarie and its staff in the • Managing conflicts of interest
• Promoting sustainable workplaces wider community
• Cyber security and data privacy
• Dealing with 3rd parties and suppliers
Environmental and Social Risk policy
• Reporting transparently
14
1. GCA: Global Commission on Adaptation; CFLI: Climate Finance Leadership Initiative. 2. TCFD: Taskforce on Climate-related Financial Disclosures; UN PRI: United Nations Principles for Responsible Investment.Macquarie I Presentation to Debt Investors I macquarie.com Overview MGL results for the full year ended 31 March 2020 Outlook Capital and funding Appendices
Environmental, Social and Governance (ESG)
FY20 Key Highlights
Environmental Environmental and Climate change Sustainability Customer and People Business conduct Macquarie
and social risk social financing in direct operations client experience and workplace and ethics Group Foundation
management
Partnerships Gold Tailored training,
391 $A9.0b 13.6% 100% Award 2019 for 3,000 workshops and $A50m+
transactions invested or arranged in of total funded renewable electricity Financial Advisor classroom events and leadership-led sessions donated by Macquarie
assessed under our renewable energy and loan equity investments by 2025 of the Year provided to over
Environmental and energy efficiency exposed to renewable 350,000 staff and the Foundation
Social Risk (ESR) projects in FY2020 energy at 31 March FY2020 emissions Mozo Experts online courses and 8,700 in FY2020 ($A410m
since inception in 1985)4
Policy in FY2020 20202 per capita reduced by Choice Awards 2020 knowledge tests staff3
for Excellent banking
12,800 MW 45% app, Internet banking
delivered to our staff
1,600
of renewable energy 2.2% from FY2010 baseline and Exceptional
in FY2020
assets in operation or of total funded equity (18% reduction everyday account Women represent non-profit organisations
under management as investments exposed from FY2019) supported in FY2020
at 31 March 20201 to conventional energy Canstar Outstanding 41%
at 31 March 20202 Value Transaction of Macquarie’s
$A20.4b
Account workforce and 46,000
(2018 and 2019) Hours volunteered
renewable energy 36% in FY2020
assets under of Board Directors
management at at 31 March 2020
31 March 2020
More information is also available at macquarie.com/ESG 1. MW of renewable energy assets in operation or under management reflect 100% generating capacity of each asset, not the proportion owned/managed by Macquarie. 2. Equity investments are reported on a funded balance sheet basis and
therefore exclude equity hedge positions and non controlling interests. Macquarie’s carrying value of its interest in East Anglia ONE Limited is $A2.8 billion, which has been partially funded with asset-specific borrowings of $A2.3 billion at 31 March 2020. Total funded equity investments amount to $A7.4 billion
as at 31 March 2020 ($A5.9 billion at 31 March 2019). 3. Content includes conduct and conduct risk, psychological safety (aimed at staff and supervisors) and ethical decision-making. Macquarie also requires staff to undertake mandatory online Code of Conduct training. 4. Contribution comprises Macquarie
Group Foundation matching support for staff donations and fundraising; Foundation donations to commemorate staff attaining 10-year and 25-year anniversaries at Macquarie; Foundation grants to non-profit organisations to recognise 12 months of board service by a Macquarie employee; and Macquarie and
Foundation grants to community organisations (including Year 1 donations for the 50th Anniversary Award). 15Macquarie I Presentation to Debt Investors I macquarie.com Overview MGL results for the full year ended 31 March 2020 Outlook Capital and funding Appendices
Macquarie’s approach to risk management
Strong focus on business accountability and risk ownership
Stable and robust core risk management principles Our approach is consistent with the ‘three lines of defence’
model with clear accountability for risk management
Supported by our longstanding approach to establishing and
maintaining an appropriate risk culture The three lines of defence model, which is a widely adopted standard
across the industry, sets risk ownership responsibilities functionally
independent from oversight and assurance.
Primary responsibility for risk management lies
Line 1
with the business.
The Risk Management Group (RMG) forms the second line of
Line 2
Ownership of risk Understanding Independent defence and independently assesses material risks.
at the business level worst case outcomes sign-off by Risk
Internal Audit provides independent and objective risk-based
Management Group
Line 3 assurance on the compliance with, and effectiveness of,
Macquarie’s financial and risk management framework.
Principles stable for 30+ years
16Macquarie I Presentation to Debt Investors I macquarie.com Overview MGL results for the full year ended 31 March 2020 Outlook Capital and funding Appendices
Trading businesses are client driven
Consistent profits and low volatility of returns
Days Daily Trading Profit and Loss FY16 - FY20
100
90
80
70
60
50
40
30
20
10
0
35
A$m
FY 2016 FY 2017 FY 2018 FY 2019 FY 2020
.
17Macquarie I Presentation to Debt Investors I macquarie.com Overview MGL results for the full year ended 31 March 2020 Outlook Capital and funding Appendices
Stable earnings
5 year earnings volatility relative to Macquarie 13 year earnings volatility relative to Macquarie
(includes GFC)
Multiple to Macquarie
Multiple to Macquarie
12.0 12.0
11.0x
10.0 10.0
9.1x
8.6x
8.0 8.0
6.0 6.0
4.4x
4.0 4.0
3.0x
2.2x 2.0x
2.0 2.0 1.7x
1.3x
1.0x 1.0x
0.6x
- -
Global Domestic Global Banks Global Domestic Macquarie Global Global Domestic Asset Global Banks Macquarie Domestic
Investment Asset Fund/Asset Majors Investment Fund/Asset Managers Majors
Banks Managers Managers Banks Managers
This page compares the historical earnings volatility among certain firms, and is not intended to represent that Macquarie has a comparable business model, risks or prospects to any other firm mentioned. 18
Volatility of P&L is defined as standard deviation of P&L divided by average P&L (coefficient of variation), based on most recent annual disclosures as at 18 May 2020 (Bloomberg).02
MGL results for the full year
ended 31 March 2020
Presentation to Debt Investors
May 2020
MACQUARIE 2020Macquarie I Presentation to Debt Investors I macquarie.com Overview MGL results for the full year ended 31 March 2020 Outlook Capital and funding Appendices FY20 result: $A2,731m down 8% on FY19 1. Calculation of the effective tax rate is after adjusting for the impact of non-controlling interests. 20
Macquarie I Presentation to Debt Investors I macquarie.com                                                                                  Overview          MGL results for the full year ended 31 March 2020                   Outlook          Capital and funding    Appendices

FY20 net profit contribution from Operating Groups
$A5,448m down 11% on FY19
                    ANNUITY-STYLE                                                                                                                                                    MARKETS-FACING
                    ACTIVITIES                                                                                                                                                       ACTIVITIES

                    $A3,439m                                                                                ▲13%                                                                     $A2,009m                                                                            ▼35%
                                                                                                                     ON FY19                                                                                                                                                ON FY19

                                                                                ▲on FY19                                                                                                                                        ▼on FY19
 Non-Banking
      Group

                                                                                                                                                                  Non-Banking
                                                                                                                                                                       Group
                    Macquarie Asset Management (MAM)                                                                                                                                 Macquarie Capital (MacCap)
                    Increased base fees, performance fees, investment-related & other income,                                                                                        DCM fee revenue down, partially offset by higher M&A fee revenue. Investment-
                    partially offset by lower net operating lease income, higher operating expenses                                                                                  related income down given strong asset realisations in FY19. Higher operating
                    and higher credit and other impairment charges                                                                                                                   expenses, funding costs and increased credit and other impairment charges

                                                                                  ▲on FY19                                                                                           Commodities and Global Markets1 (CGM)                              ▼ on FY19
    Banking Group

                                                                                                                                                                     Banking Group
                    Banking and Financial Services (BFS)
                    Growth in average volumes for BFS deposits, loan portfolio, funds on platform                                                                                    Reduction in inventory management and trading revenues and an increase in
                    and the impact of realigning the wealth advice business to focus on the high                                                                                     credit provisions mostly offset by strong global client contributions across all
                    net worth segment, offset by margin compression on deposits and higher                                                                                           products and sectors demonstrating benefits of portfolio diversity
                    credit provisions
                    Commodities and Global Markets1 (CGM)                              ▲ on FY19
                    Higher revenue from Specialised and Asset Finance and Commodities’
                    lending and financing activities

                                                                                                            MAM                                      BFS                               CGM                                                                  CGM                   MacCap

                                                                                            ~40% ~14% ~9%                                                                                                                                   ~23%                            ~14%
1. Note certain assets of the Credit Markets business, certain activities of the Cash Equities business and the Commodity Markets and Finance business, and some other less financially significant activities are undertaken from within the Non-Banking Group.                       21
Macquarie I Presentation to Debt Investors I macquarie.com Overview MGL results for the full year ended 31 March 2020 Outlook Capital and funding Appendices
Credit and Other impairment charges
KEY DRIVERS
• MAM: Higher credit and other impairment charges
mainly due to a deterioration in current and expected
macroeconomic conditions as a result of COVID-19,
including an impairment charge on the investment in
Macquarie Infrastructure Corporation (MIC) and a small
number of other investments
• BFS: Increased specific provisions in Business banking
and Vehicle finance together with increased credit
impairment charges on the performing portfolios related to
a deterioration in current and expected macroeconomic
conditions as a result of COVID-19
• CGM: Driven by increased impairment charges on a small
number of counterparties in Futures and FI&C, together
with increased credit impairment charges on the performing
loan and lease portfolio related to a deterioration in current
and expected macroeconomic conditions as a result of
COVID-19
• Macquarie Capital: Increased credit impairment charges
primarily related to a small number of loan facilities in the
debt portfolio and a deterioration in current and expected
macroeconomic conditions as a result of COVID-19
impacting the performing loan portfolio
• Corporate: Higher central overlay provisions for expected
credit losses on the performing portfolio due to a higher
weighting to the ECL downside scenario
22Macquarie I Presentation to Debt Investors I macquarie.com Overview MGL results for the full year ended 31 March 2020 Outlook Capital and funding Appendices
Financial performance
Operating income Profit
EPS DPS
23Macquarie I Presentation to Debt Investors I macquarie.com Overview MGL results for the full year ended 31 March 2020 Outlook Capital and funding Appendices
Regulatory Australia
• In light of the COVID-19 pandemic, APRA announced (on 19 Mar 20) temporary changes to its expectations regarding bank capital ratios, to ensure banks
update •
are well positioned to continue to provide credit to the economy in the current challenging environment1
On 30 Mar 20, APRA announced the deferral of its scheduled implementation of the Basel III reforms in Australia by one year to allow ADIs to focus on
maintaining operations and providing credit to the Australian economy2
• The status of the relevant regulatory changes is shown in the table below:
Regulatory Change Status Original compliance date Revised compliance date
APS 110 (Leverage ratio) Draft standard released 21 Nov 19 2022 2023
APS 111 (Capital treatment of subsidiaries) Draft standard released 15 Oct 19 2021 No change
APS 112 (Standardised credit risk) Draft standard released 12 Jun 19 2022 2023
APS 113 (IRB credit risk) Draft mortgages standard 12 Jun 19 2022 2023
APS 115 (Operational Risk) Standard finalised 11 Dec 19 2021 2023
APS 116 (FRTB) Waiting for draft standard to be released 2023 2024
APS 117 (IRRBB) Draft standard released 4 Sep 19 2022 2023
APS 222 (Associations with related Entities)3 Standard finalised 20 Aug 19 2021 2022
Transparency, comparability and flexibility Waiting for draft standard to be released 2022 2023
• As previously noted, APRA is in discussions with Macquarie on resolution planning and intragroup funding. These discussions are progressing and Macquarie
will continue working on these initiatives in consultation with APRA
• Based on the current information available, it is Macquarie’s expectation that it will have sufficient capital to accommodate likely additional regulatory Tier 1
capital requirements as a result of the above changes, noting that some of them are at an early stage of review and hence the final impact is uncertain
Germany
• Macquarie continues to respond to requests for information about its historical activities as part of the ongoing, industry-wide investigation in Germany
relating to dividend trading
• In total, the German authorities have designated as suspects approximately 100 current and former Macquarie staff, most of whom are no longer at
Macquarie
• The total amount at issue is not material and MGL has provided for the matter
1. ‘APRA adjusts bank capital expectations’; 19 Mar 20. 2. ‘APRA announces deferral of capital reform implementation’; 30 Mar 20. 3. ‘APRA announces new commencement dates for prudential and reporting standards’;
16 Apr 20.
24Macquarie I Presentation to Debt Investors I macquarie.com Overview MGL results for the full year ended 31 March 2020 Outlook Capital and funding Appendices
Approximate
business As at 31 Mar 2020
Basel III APRA Basel III
Capital1
Approx. FY20 Return
on Ordinary Equity2
Approx. 13-year
Average Return on
Capital Operating Group
Annuity-style businesses
@ 8.5% ($Ab)
7.1
Ordinary Equity3
and ROE Macquarie Asset Management 2.8
24% 22%
Banking and Financial Services 4.3
Markets-facing businesses 10.0
Commodities and Global Markets 5.9
14% 16%
Macquarie Capital 4.2
Corporate 0.6
Total regulatory capital requirement @ 8.5% 17.7
Group surplus 7.1
Total APRA Basel III capital supply 24.84 14.5% 14%
Note: Differences in totals due to rounding. 1. Operating Group capital allocations are based on 31 Dec 20 allocations adjusted for material movements over the Mar 20 quarter. 2. NPAT used in the calculation of approx.
FY20 ROE is based on Operating Groups’ annualised net profit contribution adjusted for indicative allocations of profit share, tax and other corporate expenses. Accounting equity is attributed to businesses based on
regulatory capital requirements which are based on the quarterly average capital usage from FY07 to FY20, inclusive. 3. 14-year average covers FY07 to FY20, inclusive, and has not been adjusted for the impact of business
restructures or changes in internal P&L and capital attribution. 4. Comprising of $A21.0b of ordinary equity and $A3.7b of hybrids. 25Macquarie I Presentation to Debt Investors I macquarie.com Overview MGL results for the full year ended 31 March 2020 Outlook Capital and funding Appendices
Business activity since 31 March 2020
Annuity-style businesses Markets-facing businesses
Non-Banking Group
Macquarie Asset Management (MAM) Macquarie Capital (MacCap)
Non-Banking Group
• Continued MIRA investment and divestment activity (AirTrunk, Cincinnati Bell, • Significant client engagement and evaluation of opportunities in the
Viesgo and LG CNS acquisitions in MIRA funds and Macquarie European Rail current environment
sale from balance sheet) • Supported clients in raising more than $A6.8b of equity2. Since 1 Mar 20, the
• Well-positioned in the current environment to capitalise on investment ASX has been the most active exchange in the world3, with more than $A18.8b
opportunities, with continued fundraising activity across the MIRA platform and equity raised4
significant equity to deploy • Continued to support clients with bespoke financing solutions and focused on
• Macquarie AirFinance investment (50% owned by MQG) actively working with investing in credit markets
airlines to provide temporary relief to reflect their near-term revenue challenges • Development & construction activity in some jurisdictions has slowed with some
• MIM’s solid investment performance from Mar 20 continued into Apr 20 across projects proceeding under significantly tightened health and safety measures.
key strategies in both the Fixed Income and Equity Fund As the pandemic passes, we expect a swift recovery in activity levels given the
essential nature of many of our infrastructure and energy projects
Banking Group
Banking and Financial Services (BFS) Commodities and Global Markets1 (CGM)
Banking Group
• Continued strong growth in deposits driven by existing and new-to-bank • Product and client sector diversity continues to be an area of strength
deposit clients • Increased activity as clients seek to rebalance their portfolios to manage risk
• Continued extension of credit in line within prudent lending standards • Renewed Commodity Markets and Financing borrowing facility
• Digitised payment pause applications to enable the timely processing of • Funding education technology infrastructure in Australia and healthcare assets,
requests for clients in need of support: Approximately 75% of payment pause including robotics, in UK
requests were processed for BFS clients within the first week of Macquarie’s
COVID-19 support package being launched
Support Groups
• With most staff working remotely globally, provided a stable technology experience for staff; completed year-end reporting; continued to raise funding; maintained effective risk
management and supervision.
1. Note certain assets of the Credit Markets business, certain activities of the Cash Equities business and the Commodity Markets and Finance business, and some other less financially significant activities are undertaken from within the Non-Banking Group. 2. Dealogic Macquarie Group completed
ASX raisings, 1 Mar 20 to 1 May 20. Deal values reflect the full transaction value and not an attributed value. 3. Dealogic all exchange raisings completed, 1 Mar 20 to 1 May 20. 4. Dealogic completed ASX raisings, 1 Mar 20 to 1 May 20. 2603
Outlook
Presentation to Debt Investors
May 2020
MACQUARIE 2020Macquarie I Presentation to Debt Investors I macquarie.com Overview MGL results for the full year ended 31 March 2020 Outlook Capital and funding Appendices
Short-term
Short-term • Market conditions are likely to remain challenging, especially given the significant uncertainty
caused by the worldwide impact of COVID-19 and the uncertain speed of the global
outlook
outlook economic recovery
• The extent to which these conditions will impact our overall FY21 profitability is uncertain,
making short-term forecasting extremely difficult. Accordingly we are currently unable to
provide meaningful guidance for the year ahead
• In addition to the impact of COVID-19 mentioned above, the range of other factors that will
influence our short-term
outlook are:
– The completion rate of transactions and period-end reviews
– Market conditions and the impact of geopolitical events
– The impact of foreign exchange
– Potential regulatory changes and tax uncertainties
• Geographic composition of income
• We continue to maintain a cautious stance, with a conservative approach to capital, funding
and liquidity that positions us well to respond to the current environment
28Macquarie I Presentation to Debt Investors I macquarie.com Overview MGL results for the full year ended 31 March 2020 Outlook Capital and funding Appendices
Factors impacting short-term outlook
Annuity-style businesses Markets-facing businesses
Non-Banking Group
Macquarie Asset Management (MAM) Macquarie Capital (MacCap)
Non-Banking Group
• Base fees expected to be broadly in line • Transaction activity continues, with challenging markets expected to reduce the
• Net Other Operating Income1 expected to be significantly down, due to expected number of successful transactions and increase the time to completion
delays in timing of asset sales • Investment-related income expected to be down on FY20 driven by lower asset
realisations considering market conditions, but positioned to benefit from market
recovery
Banking Group
Banking and Financial Services (BFS) Commodities and Global Markets2 (CGM)
Banking Group
• Higher deposit and loan portfolio volumes • Subdued customer activity anticipated, particularly in the commodities sector in
• Platform volumes subject to market movements 1H21, albeit volatility may create opportunities
• Competitive dynamics to drive margin pressure • Consistent contribution from Specialised and Asset Finance linked to stable
balance sheet and annuity flows
• Product and client sector diversity expected to provide some support through
uncertain economic conditions in 1H21
Corporate
• Compensation ratio expected to be within the range of historical levels • Based on FY20 mix of income, the FY21 effective tax rate is expected to be within the
range of recent outcomes
1. Net Other Operating Income includes all operating income excluding base fees 2. Note certain assets of the Credit Markets business, certain activities of the Cash Equities business and the Commodity Markets and Finance business, and some other less financially significant activities are
undertaken from within the Non-Banking Group. 29Macquarie I Presentation to Debt Investors I macquarie.com Overview MGL results for the full year ended 31 March 2020 Outlook Capital and funding Appendices
Medium-term
Medium-term • Macquarie remains well-positioned to deliver superior performance in the medium term
• Deep expertise in major markets
• Build on our strength in business and geographic diversity and continue to adapt our
portfolio mix to changing market conditions
– Annuity-style income is primarily provided by two Operating Groups’ businesses which
are delivering superior returns following years of investment and acquisitions
– Macquarie Asset Management and Banking and Financial Services
– Two markets-facing businesses well positioned to benefit from improvements in market
conditions with strong platforms and franchise positions
– Commodities and Global Markets and Macquarie Capital
• Ongoing program to identify cost saving initiatives and efficiency
• Strong and conservative balance sheet
– Well-matched funding profile with minimal reliance on short-term wholesale funding
– Surplus funding and capital available to support growth
• Proven risk management framework and culture
30Macquarie I Presentation to Debt Investors I macquarie.com Overview MGL results for the full year ended 31 March 2020 Outlook Capital and funding Appendices
Medium term
Annuity-style businesses Markets-facing businesses
Non-Banking Group
Macquarie Asset Management (MAM) Macquarie Capital (MacCap)
Non-Banking Group
• Leading specialist global asset manager, well-positioned to respond to current • Positioned to benefit from recovery in M&A and capital markets activity
market conditions. Strongly placed to grow assets under management through its • Continues to tailor the business offering to current opportunities and market
diversified product offering, track record and experienced local investment teams conditions including providing flexible capital solutions across sectors and
regions
• Opportunities for project development and balance sheet investment by the
group and in support of partners and clients subject to market conditions
Banking Group
Banking and Financial Services (BFS) Commodities and Global Markets1 (CGM)
Banking Group
• Growth opportunities through intermediary and direct retail client distribution, • Opportunities to grow commodities business, both organically and through
platforms and client service acquisition
• Opportunities to increase financial services engagement with existing business • Development of institutional and corporate coverage for specialised credit, rates
banking clients and extend into adjacent segments and foreign exchange products
• Modernising technology to improve client experience and support growth • Tailored finance solutions globally across a variety of industries and asset
classes
• Continued investment in asset finance portfolio
• Growing client base across all regions
1. Note certain assets of the Credit Markets business, certain activities of the Cash Equities business and the Commodity Markets and Finance business and some other less financially significant activities are undertaken from within the Non-Banking Group. 3104
Capital and Funding
Presentation to Debt Investors
May 2020
MACQUARIE 2020Macquarie I Presentation to Debt Investors I macquarie.com Overview MGL results for the full year ended 31 March 2020 Outlook Capital and funding Appendices Strong regulatory ratios Bank Group (Mar 20) 1. ‘Harmonised’ Basel III estimates are calculated in accordance with the BCBS Basel III. 2. Average LCR for Mar 20 quarter is based on an average of daily observations. 3. Includes the capital conservation buffer in the minimum CET1 ratio requirement. APRA has released a draft update to 'Prudential Standard APS 110 Capital Adequacy' proposing a minimum requirement for the leverage ratio of 3.5% effective Jan 23. 33
Macquarie I Presentation to Debt Investors I macquarie.com                                                                                Overview         MGL results for the full year ended 31 March 2020                  Outlook          Capital and funding           Appendices

Basel III capital position
   • APRA Basel III Group capital at Mar 20 of $A24.8b; Group capital surplus of $A7.1b1,2
   • APRA Basel III CET1 ratio: 12.2%; Harmonised Basel III CET1 ratio: 14.9%
Group regulatory surplus: Basel III (Mar 20)

1. Calculated at 8.5% RWA including the capital conservation buffer (CCB), per APRA ADI Prudential Standard 110. 2. Based on materiality, the 8.5% used to calculate the Group capital surplus does not include the countercyclical capital buffer (CCyB) of ~3bps. The individual CCyB varies by
jurisdiction and the Bank Group’s CCyB is calculated as a weighted average based on exposures in different jurisdictions. 3. Basel III applies only to the Bank Group and not the Non-Bank Group. ‘Harmonised’ Basel III estimates are calculated in accordance with the BCBS Basel III framework.
4. Includes Sep-19 $A1.7b capital raising, partially offset by Bank Capital Notes redemption. 5. Includes movement in foreign currency translation reserve, share based payment reserve, MEREP and other movements. 6. APRA Basel III ‘super-equivalence’ includes the impact of changes in capital
requirements in areas where APRA differs from the BCBS Basel III framework. Differences include the treatment of mortgages $A0.9b; capitalised expenses $A0.5b; equity investments $A0.3b; investment into deconsolidated subsidiaries $A0.1b; DTAs and other impacts $A0.3b.                         34
Macquarie I Presentation to Debt Investors I macquarie.com                                                                                Overview          MGL results for the full year ended 31 March 2020   Outlook      Capital and funding   Appendices

Business capital requirements1
                                                                                                                                                                                                                          FY20 KEY DRIVERS
                                                                                                                                                                                                                          MAM
                                                                                                                                                                                                                          • Primarily driven by asset realisations
                                                                                                                                                                                                                            including the sale of Macquarie
                                                                                                                                                                                                                            AirFinance to a joint venture2 and
                                                                                                                                                                                                                            MIRA performance fees receipt
                                                                                                                                                                                                                            partially offset by FX movements
                                                                                                                                                                                                                          BFS
                                                                                                                                                                                                                          • Sustained growth in the home loans
                                                                                                                                                                                                                            book, partially offset by decrease in
                                                                                                                                                                                                                            the vehicle finance portfolio
                                                                                                                                                                                                                          CGM
                                                                                                                                                                                                                          • Increase primarily due to additional
                                                                                                                                                                                                                            requirements for the introduction of
                                                                                                                                                                                                                            SA-CCR3 (1 Jul 19), derivatives book
                                                                                                                                                                                                                            and FX movements
                                                                                                                                                                                                                          Macquarie Capital
                                                                                                                                                                                                                          • Investments net of asset realisations
                                                                                                                                                                                                                            including FX movements

1. Regulatory capital requirements are calculated at 8.5% RWA. 2. Macquarie held a 50% interest at 31 Mar 20. 3. Standardised approach to counterparty credit risk.                                                                                                  35
Macquarie I Presentation to Debt Investors I macquarie.com Overview MGL results for the full year ended 31 March 2020 Outlook Capital and funding Appendices
Balance sheet highlights and initiatives
• Balance sheet remains solid and conservative
– Term assets covered by term funding, stable deposits and equity
– Minimal reliance on short-term wholesale funding markets
• Total customer deposits1 continuing to grow, up 20% to $A67.1b as at Mar 20 from $A56.0b as at Mar 19
• $A1.7b of equity capital raised in 1H20 through $A1.0b institutional placement and $A0.7b share purchase plan
• $A26.0b2 of term funding raised during FY20 with $A7.7b in Q4 FY20 with weighted average life 4.9 years3 including:
– $A13.4b of term wholesale paper issued
– $A9.5b of PUMA RMBS and SMART ABS public and warehouse securitisation issuance
– $A2.3b of secured trade finance facilities
– $A0.8b of MGL USD syndicated loan facilities4
JANUARY FEBRUARY MARCH
$A2.6b $A4.4b $A0.7b
• $US1.25b 5yr MBL USD Public • €0.5b 7yr MGL EUR Public • $A1.8b 5yr MBL AUD Public • $A0.9b PUMA RMBS • $US0.3b 5yr MGL Samurai • $Ae0.2b Islamic Finance /
Loan Facility Structured Note
• $A1.0b SMART ABS • €0.4b 2yr MBL EUR Public
1. Total customer deposits as per the funded balance sheet ($A67.1b) differs from total deposits as per the statutory balance sheet ($A67.3b). The funded balance sheet reclassifies certain balances to other funded balance sheet categories. 2. Issuances cover a range of tenors, currencies, product
types and are AUD equivalent based on FX rates at the time of issuance and include undrawn facilities. 3. Excludes securitisations 4. Includes $A0.2b green financing. 36Macquarie I Presentation to Debt Investors I macquarie.com Overview MGL results for the full year ended 31 March 2020 Outlook Capital and funding Appendices
Conservative long standing liquidity
risk management framework
Liquidity Policy
• The key requirement of the MGL and MBL liquidity policies is that the entities are able to meet all liquidity obligations during
a period of liquidity stress:
– A twelve month period with constrained access to funding markets for MBL, no access to funding markets for MGL and
with only a limited reduction in franchise businesses
• Term assets are funded by term funding, stable deposits, hybrids and equity
Liquidity Framework
• A robust liquidity risk management framework is designed to ensure that both MGL and MBL are able to meet their funding
requirements as they fall due under a range of market conditions. Key tools include:
– Liability driven approach to balance sheet management
– Scenario analysis
– Maintenance of unencumbered liquid asset holdings
• Liquidity management is performed centrally by Group Treasury, with oversight from the Asset and Liability Committee and
the Risk Management Group
• The MGL and MBL Boards approve the liquidity policies and are provided with liquidity reporting on a regular basis
37Macquarie I Presentation to Debt Investors I macquarie.com Overview MGL results for the full year ended 31 March 2020 Outlook Capital and funding Appendices
Funded balance sheet remains strong
Term liabilities exceed term assets
31 Mar 19 31 Mar 20
TOTAL CUSTOMER
DEPOSITS8
$A67.1b ▲20%
FROM MAR 19
NEW TERM
FUNDING9
RAISED
$A26.0b SINCE
MAR 19
NEW CAPITAL
ISSUANCES THROUGH
INSTITUTIONAL
$A1.7b PLACEMENT & SPP10
These charts represent Macquarie’s funded balance sheets at the respective dates noted above. For details regarding reconciliation of the funded balance sheet to Macquarie’s statutory balance sheet refer to slide 49. 1. ‘Other debt maturing in the next 12 months’ includes Structured notes, Secured
funding, Bonds, Other loans, Subordinated debt and Net trade creditors. 2. ‘Debt maturing beyond 12 months’ includes Subordinated debt. 3. Non-controlling interests are netted down in ‘Equity and hybrids’ and ‘Equity investments and PPE’ and ‘Loan assets (incl. op lease) > 1 year’. 4. Hybrid
instruments include Macquarie Additional Capital Securities, Macquarie Capital Notes 2, 3 & 4, Macquarie Bank Capital Notes (BCN) (BCN were redeemed in Mar 20) and Macquarie Income Securities (MIS) (MIS were redeemed in Apr 20). 5. ‘Cash, liquids and self-securitised assets’ includes self-
securitisation of repo eligible Australian assets originated by Macquarie, a portion of which Macquarie can utilise as collateral in the Reserve Bank of Australia’s Committed Liquidity Facility. 6. ‘Loan Assets (incl. op lease) > 1 year’ includes Debt investment securities. 7. ‘Equity investments and PPE’
includes Macquarie’s co-investments in Macquarie-managed funds and equity investments. 8. Total customer deposits as per the funded balance sheet ($A67.1b) differs from total deposits as per the statutory balance sheet ($A67.3b). The funded balance sheet reclassifies certain balances to other
funded balance sheet categories. 9. Issuances cover a range of tenors, currencies and product types and are AUD equivalent based on FX rates at the time of issuance and include undrawn facilities. 10. Share Purchase Plan (SPP) was offered to existing shareholders post completion of the
Institutional Placement. 38You can also read