M anuka Clones Differ in Their Volatile Profiles: Potential Implications for Plant Defence, Pollinator Attraction and Bee Products - MDPI
←
→
Page content transcription
If your browser does not render page correctly, please read the page content below
agronomy
Article
Mānuka Clones Differ in Their Volatile Profiles: Potential
Implications for Plant Defence, Pollinator Attraction and
Bee Products
Evans Effah            , Kyaw Min Tun          , Natalia Rangiwananga and Andrea Clavijo McCormick *

                                          School of Agriculture and Environment, Massey University, Tennent Drive, Palmerston North 4474, New Zealand;
                                          E.Effah@massey.ac.nz (E.E.); k.mintun08@gmail.com (K.M.T.); nrangiwananga@gmail.com (N.R.)
                                          * Correspondence: a.c.mccormick@massey.ac.nz

                                          Abstract: The New Zealand native plant mānuka (Leptospermum scoparium) is representative of
                                          the country’s North and South Islands flora. This species is essential to the growing community
                                          of honey producers due to its honey’s antimicrobial and antioxidant properties, attributed to the
                                          presence of methylglyoxal (MGO), derived from dihydroxyacetone (DHA) in the nectar. Several
                                          clones and cultivars have been selected to optimize DHA production. Still, nothing is known about
                                          the volatile emissions of these artificially selected plants. Volatile organic compounds (VOCs) can
                                          influence their interactions with the environment, such as pollinator foraging decisions, which may
                                          subsequently affect the plants’ products. This study explored the aboveground volatile organic
                                          compounds (VOCs) emitted by eight different mānuka genotypes (six clones and two wild cultivars)
                                          under field conditions during the spring season. Volatiles were collected using the “push–pull”

                                   headspace sampling technique and analyzed using gas chromatography-mass spectrometry (GC-MS).
Citation: Effah, E.; Min Tun, K.;
                                          Our results show that mānuka plants emit large amounts of terpenoids, with sesquiterpenes and
Rangiwananga, N.; Clavijo                 monoterpenoids being the most abundant groups of compounds. The results also show variation
McCormick, A. Mānuka Clones              in the total green leaf volatiles, total sesquiterpenes, and specific compounds between genotypes
Differ in Their Volatile Profiles:        and suggest that artificially selected plants have a significant variation in their chemical profiles.
Potential Implications for Plant          The potential impacts of these results on the plant’s defence, pollinator attraction and bee products
Defence, Pollinator Attraction and        are discussed.
Bee Products. Agronomy 2022, 12, 169.
https://doi.org/10.3390/                  Keywords: plant genotype; plant secondary metabolites; artificial selection; plant volatiles; green
agronomy12010169                          leaf volatiles; terpenoids; honey; propolis
Academic Editor: Gerardo Fernández
Barbero

Received: 2 December 2021
                                          1. Introduction
Accepted: 23 December 2021
Published: 11 January 2022
                                                Plants emit volatile organic compounds (VOCs) that mediate communication with
                                          other organisms (such as pollinators or nearby plants) and responses to biotic and abi-
Publisher’s Note: MDPI stays neutral
                                          otic stress (such as herbivory or UV radiation), making them essential elements in plant
with regard to jurisdictional claims in
                                          ecology [1–4]. VOC emission is species-specific but can vary between plant populations,
published maps and institutional affil-
                                          cultivars, and genotypes [5–8]. These specificities in plant volatile emissions could be
iations.
                                          relevant to plants’ ecological relationships and their responses to the environment [7,9].
                                                Mānuka (Leptospermum scoparium) is a New Zealand native woody perennial species.
                                          This shrub commonly occurs on the North and South Islands, where it persists in harsh
Copyright: © 2022 by the authors.
                                          environments, such as areas with low soil fertility, drought, waterlogged and frost [10–12].
Licensee MDPI, Basel, Switzerland.        Mānuka is highly polymorphic, linked to environmental and genetic determinants, which
This article is an open access article    is maintained in cultivation [13]. This species varies in size and form, ranging from
distributed under the terms and           medium-sized, prostrate and dwarf-form shrub to trees [13] and has been described as an
conditions of the Creative Commons        andromonoecious species [14]. Mānuka is of economic importance to honey producers due
Attribution (CC BY) license (https://     to the antimicrobial and antioxidant properties of its honey, attributed to the compound
creativecommons.org/licenses/by/          methylglyoxal (MGO) [15], which is derived from dihydroxyacetone (DHA) in the nec-
4.0/).                                    tar [16,17]. However, the levels of DHA differ between mānuka plants [18], leading to the

Agronomy 2022, 12, 169. https://doi.org/10.3390/agronomy12010169                                          https://www.mdpi.com/journal/agronomy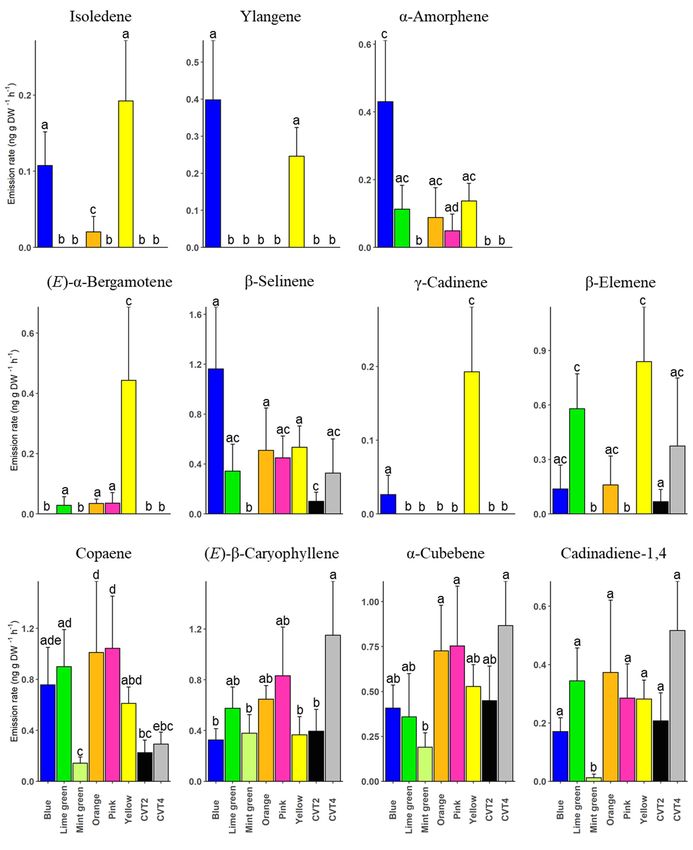
Agronomy 2022, 12, 169                                                                                           2 of 13

                         investigation of the genetic and environmental factors influencing nectar composition and
                         yield. Previous studies have confirmed a genetic component associated with DHA produc-
                         tion, prompting the selection of DHA-rich clones for commercial use [19–22]. However,
                         whether pollinators are attracted to high DHA-producing clones is a different matter.
                              The attraction of beneficial organisms such as pollinators to plants is a combination
                         of multiple factors, including floral visual displays, flower density, nectar traits, and
                         plant scents [1,23,24]. While most of these factors have been extensively characterized
                         for different clones of mānuka [19–22], their volatile emission has not been explored.
                         Knowledge of mānuka volatile emissions, in general, is limited, and only recently was the
                         scent of wild mānuka plants under field conditions reported [25].
                              This study aims to characterize the volatile organic compounds (VOCs) emitted by
                         different mānuka genotypes and discuss the potential roles of the results in relation to
                         defence, pollinator attraction and bee products. This information could be important for
                         plant breeders in selecting quality traits (VOCs) vital for the plant’s ecology and maximizing
                         the richness of its products, including the mānuka honey. To achieve this, we measured the
                         aboveground volatile emissions of eight New Zealand originated mānuka genotypes in a
                         common garden setting in spring 2017. VOCs were measured under natural conditions
                         without manipulating any variable. Based on previous studies on the tested mānuka
                         genotypes, reporting significant variation in floral display and nectar chemistry [21,26], we
                         expect to encounter significant diferences in their volatile profiles.

                         2. Materials and Methods
                         2.1. Study Site and Biological Material
                               The study was conducted in spring 2017 at the Pasture and Crop Research Unit
                         (Moginie block, Long. 175.61155—Lat. -40.387483), Massey University, Palmerston North,
                         New Zealand (Figure 1). Eight mānuka genotypes that were pot-grown clones and propa-
                         gated from cuttings of elite mānuka cultivars provided by Comvita New Zealand Limited
                         as part of the breeding programme for their DHA content were transplanted on this farm
                         in 2011, with 1.5 m spacing between plants. For easy identification, Comvita assigned
                         colour codes: blue, lime green, mint green, orange, pink, and yellow to the six clones and
                         CVT2 and CVT4 to the cultivars. Table 1 shows the parentage, growth form and flower
                         appearance of the clones used in this study. Previous studies by Bohórquez Rodríguez
                         de Medina [21] and Sheridan [26] provide detailed information on the different clones
                         including environmental and genetic influences on flowering and nectar production, nectar
                         DHA and sugar content, and pollinator visitation.
                               We measured the aboveground volatile emissions of the eight mānuka genotypes
                         using the “push–pull” headspace sampling technique. The volatile collection was done
                         following the same protocol described by [9]. In summary, a portion of foliage with flowers
                         was enclosed in a new multi-purpose oven bag. Using a portable volatile collection system
                         (PVAS22; Volatile Assay Systems, Rensselaer, NY, USA) connected with PTFE tubes, air
                         was simultaneously pushed into and pulled out of the bag through a volatile collection trap
                         containing 30 mg HayeSep Q adsorbent (Volatile Assay Systems, Rensselaer, NY, USA).
                         Volatiles were collected for 2 h per plant, after which the enclosed foliage was excised and
                         oven-dried at 60 ◦ C until constant weight to estimate emission per dry weight. All volatile
                         collections were done in three days (21–23 November 2017) under similar environmental
                         conditions (sunny and dry days), with 26 ◦ C and 0.0 mm average maximum air temperature
                         and rainfall, respectively. Volatiles were collected from five plants of each genotype. All
                         plants were flowering and looked healthy and lush at the time of sampling.
                               The volatile collection traps were eluted using 200 µL of 95% hexane (Sigma Aldrich)
                         containing 10 ng/mL nonyl acetate (C11H22O2) (Sigma Aldrich) as an internal standard in
                         the laboratory. The samples were then analyzed using gas chromatography coupled to mass
                         spectrometry (Shimadzu technologies), which had a 30 m × 250 µm × 0.25 µm TG-5MS
                         column and helium as a carrier gas. The operation conditions of the gas chromatography-
                         mass spectrometry and identification of compounds followed the same protocol as in [9].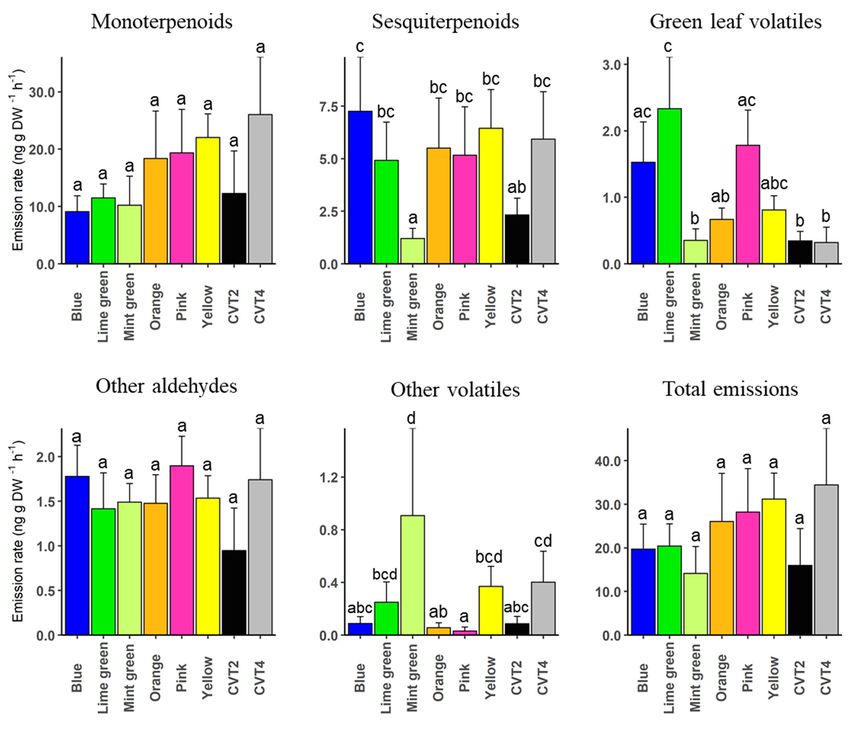
Agronomy 2022, 12, 169                                                                                                         3 of 13

                                  The oven temperature was 50 ◦ C, held for 3 min, increased to 95 ◦ C at 5 ◦ C/min, then
                                  ramped up to 230 ◦ C. Compounds were identified by comparing target spectra to the
                                  National Institute of Standards library and confirmed by commercial standards when
                                  available. Blank samples were collected and analyzed as described, and compounds
                                  identified were excluded from the analysis.

                                  2.2. Data Analysis
Agronomy 2022, 12, x FOR PEER REVIEW                                                                                                         4 of 14
                                       Statistical analyses were performed using R v.4.1.0 [27]. All volatile compounds
                                  identified from mānuka plants were grouped into their respective chemical classes, and
                                  their proportions were compared between the eight plant genotypes using generalized
                                  linear models with Gamma distribution (link = log). The “relevel” function was used to
                                  construct a set of level contrast for the plant genotypes [9,28].

                                  Figure 1. (a) Google earth image indicating study area inside the red square. (b) Layout of mānuka
                                  plants
                                 Figure 1.in (a)
                                             the Google
                                                 area, with colours
                                                         earth      indicating
                                                                image           different
                                                                        indicating   studygenotypes.
                                                                                            area insideCVT2
                                                                                                          theand
                                                                                                               red CVT4  were
                                                                                                                   square.  (b)inLayout
                                                                                                                                  a separate
                                                                                                                                         of mānuka
                                  plot within
                                 plants  in thethearea,
                                                   study area.colours
                                                        with   Plants were  spaced 1.5
                                                                      indicating       m within
                                                                                   different     plots, and five
                                                                                              genotypes.    CVT2 samples per genotype
                                                                                                                    and CVT4           were
                                                                                                                                 were in a separate
                                  collected  using  non-adjacent plants at the edge of each plot for convenience   when  placing
                                 plot within the study area. Plants were spaced 1.5 m within plots, and five samples per genotype equipment
                                  and to
                                 were     avoid damaging
                                        collected           nearby plants.plants at the edge of each plot for convenience when placing
                                                    using non-adjacent
                                 equipment and to avoid damaging nearby plants.

                                      The volatile collection traps were eluted using 200 µL of 95% hexane (Sigma Aldrich)
                                 containing 10 ng/mL nonyl acetate (C11H22O2) (Sigma Aldrich) as an internal standard
                                 in the laboratory. The samples were then analyzed using gas chromatography coupled to
                                 mass spectrometry (Shimadzu technologies), which had a 30 m × 250 µm × 0.25 µm TG-
                                 5MS column and helium as a carrier gas. The operation conditions of the gas chromatog-
                                 raphy-mass spectrometry and identification of compounds followed the same protocol as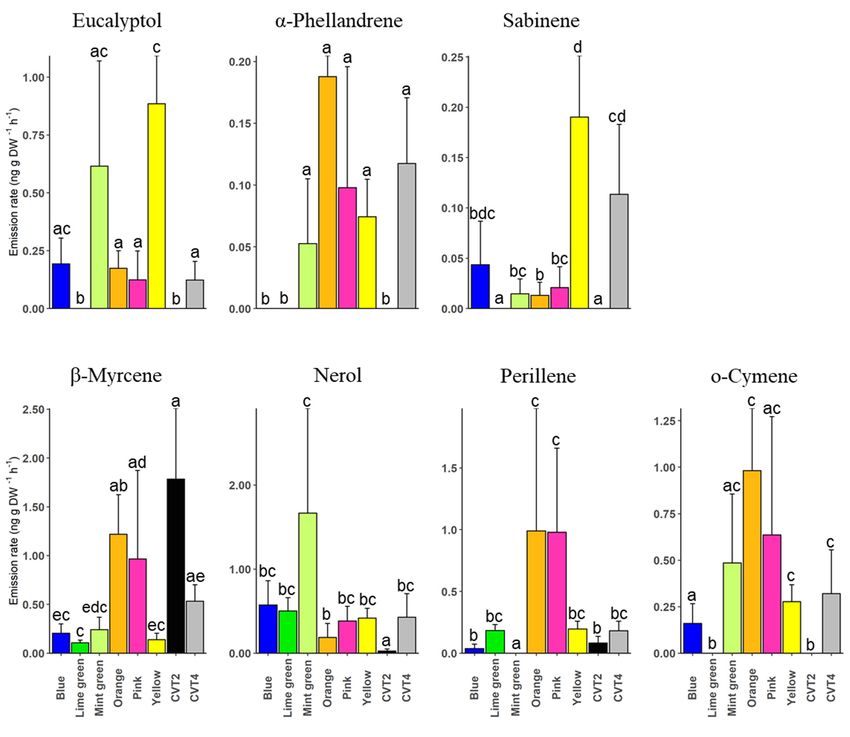
Agronomy 2022, 12, x FOR PEER REVIEW 3 of 14
Agronomy 2022, 12, x FOR PEER REVIEW 3 of 14
Agronomy 2022, 12, x FOR PEER REVIEW 3 of 14
Table 1. Characteristics of the mānuka clonal genotypes used in this study. Photo credit: Julia Bohór-
quez Rodríguez
Agronomy 2022, 12, x FOR PEER REVIEW
Table de Medina.
1. Characteristics 3 of 14
of the mānuka clonal genotypes used in this study. Photo credit: Julia Bohór-
quez Rodríguez
Agronomy 2022, 12, x FOR PEER REVIEW
Table de Medina.
1. Characteristics of the mānuka clonal genotypes used in this study. Photo credit:4Julia 3 of 14
Bohór-
Agronomy 2022,Genotype
12, 169 Parentage Growth Form Image of Flower of 13
quez
TableRodríguez de Medina.
1. Characteristics of the mānuka clonal genotypes used in this study. Photo credit: Julia Bohór-
Genotype Parentage Growth Form Image of Flower
quez Rodríguez de Medina.
Table 1. Characteristics of the mānuka clonal genotypes used in this study. Photo credit: Julia Bohór-
Genotype Parentage Growth Form Image of Flower
quez
TableRodríguez de Medina.
1. Characteristics of the mānuka clonal genotypes used in this study. Photo credit: Julia Bohór-
Genotype Parentage
Table 1. Characteristics Growth
of the mānuka clonal Form used in this study.
genotypes Image of Flower
Photo credit: Julia
quez
L.Bohórquez Rodríguez
scopariumRodríguez de
var. scoparium Medina.
selec-
Genotype Parentage de Medina. Growth Form Image of Flower
Blue L. scoparium xvar. scoparium selec-
tionParentage
L. scoparium Shrub
Genotype Growth Form Image of Flower
Blue L. scoparium
tion
var xvar.
Genotype scoparium
selectionselec-
L. scoparium
incanum Parentage ShrubGrowth Form Image of Flower
Blue L. scoparium
tion
var xvar.
L. scoparium
incanum scoparium
selectionselec- Shrub
Blue tion
var
L. scoparium xvar.
L. scoparium
incanum selection selec-
scoparium Shrub
Blue L. scoparium
var xvar.
incanum
tion scoparium
selectionL.selec-
L. scoparium scoparium var. Shrub
Blue tion
var x L. scoparium
incanum scoparium selection ×Shrub
selection
Blue Shrub
var incanum selectionL. scoparium var
incanum selection
L. scoparium var. scoparium selec-
Lime green L. scoparium tion
var. xscoparium
L. selec- Tree
Lime green L. scoparium var.
tion scoparium
x L.
rotundifolium cultivar selec- Tree
Lime green L. scoparium tion
var. xscoparium
rotundifolium L.
cultivarselec- Tree
Lime green L. scoparium tion
var. xscoparium
rotundifolium L. scoparium var. Tree
cultivarL.selec-
Lime green rotundifolium
L. scoparium var. scoparium
cultivar
scoparium
tion x L. selec- selection × Tree
Lime green Tree
Lime green tion x L. L. rotundifolium Tree
rotundifolium cultivar
cultivar
rotundifolium cultivar
L. scoparium var. incanum selec-
Mint green L. scoparium
tion x var. incanum selec-
L. scoparium Shrub
Mint green L. scoparium x var.
tionincanum
var incanum
cultivarselec-
L. scoparium Shrub
Mint green L. scoparium
var x var.
tionincanum incanum
cultivarselec-
L. scoparium L. scoparium var. Shrub
Mint green tion
var
L. scoparium x var. incanum selec-selection × L.Shrub
L.
incanum
Mint green scopariumincanum
cultivar Shrub
L. scoparium scoparium
selec- var incanumShrub
Mint green var
tion x var.
incanum incanum
cultivar
L. scoparium
cultivar
Mint green tionincanum
var x L. scoparium
cultivar Shrub
var incanum cultivar
L. scoparium ‘Nnicolsonii’ cultivar
Orange L.
x scoparium
L. scoparium ‘Nnicolsonii’ cultivar
var. scoparium se- Shrub
Orange L. scoparium
x L. scoparium ‘Nnicolsonii’ cultivar
var. scoparium
lection L.se-
scoparium Shrub
Orange L. scoparium
x L. scoparium ‘Nnicolsonii’ ‘Nnicolsonii’
var. scoparium
lection cultivar
se- cultivar Shrub
Orange Shrub
× L. scoparium var.
Orange x L.
L. scoparium
scoparium lection
var. scoparium
‘Nnicolsonii’ se-
cultivar Shrub
scoparium selection
Orange L. scoparium
x L. scoparium lection
‘Nnicolsonii’ cultivar
var. scoparium se- Shrub
Orange x L. scoparium var. scoparium se-
lection Shrub
lection
L. scoparium var. scoparium selec-
Pink L. scoparium tion
var. xscoparium
L. selec-
L. scoparium var. Tree
Pink L. scoparium var.
tion
rotundifolium x L. scoparium
scoparium
cultivar selec- selection × Tree
Pink Tree
Pink L. scoparium var.
tion scoparium
x L. L. rotundifolium
selec- Tree
rotundifolium cultivar
cultivar
Pink L. scoparium tion
var. xscoparium
rotundifolium L.
cultivar selec- Tree
Pink L. scoparium var. xscoparium
rotundifolium
tion cultivar selec-
L. Tree
Pink tion x L.
rotundifolium cultivar Tree
rotundifolium cultivar
L. scoparium var. scopariumL.field
scoparium var.
Yellow Yellow scoparium field Tree Tree
L. scoparium var. scoparium
selection field
Yellow selection Tree
L. scopariumselection
var. scoparium field
Yellow Tree
L. scopariumselection
var. scoparium field
Yellow Tree
selection
L. scoparium var. scoparium field
Yellow Tree
L. scopariumselection
var. scoparium field
Yellow Tree
selection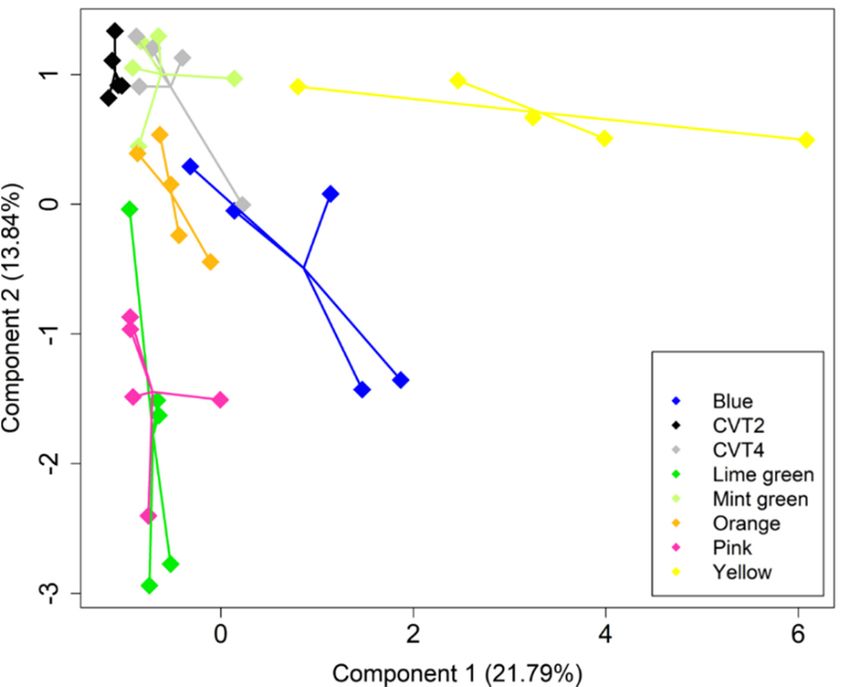
Agronomy 2022, 12, 169                                                                                                           5 of 13

                                       The composition of volatile blends produced by plants was investigated using sparse
                                 partial least square discriminant analysis (sPLS-DA) [29]. Before performing sPLS-DA,
                                 the data was normalized by log transformation (log10x + 1) and autoscaled. sPLS-DA
                                 was performed using the package “mixOmics” [30]. The “tune.splsda” with 5-fold cross-
                                 validation, over 200 repeats, was first used to select the optimal number of components
                                 and variables to keep in the model. VOCs with variable importance in projection (VIP)
                                 coefficient ≥ 1.0 were considered as compounds contributing to discriminating genotypes.
                                 Using this threshold, some compounds were selected and compared between the eight
                                 mānuka genotypes using generalized linear models (GLMs), assuming Gamma distributed
                                 errors (link = log) and the “relevel” function was used to construct sets of level contrast
                                 between genotypes. For all the GLMs performed, a small constant (0.001) was added to the
                                 response variables (either chemical class or individual VOC) to avoid zeros, as described
                                 in [9].

                                 3. Results
                                           Thirty-four compounds were identified in the headspace collections of mānuka plants,
                                    and these were grouped into their respective chemical classes. Most of the identified
                                    compounds were sesquiterpenes (14), followed by monoterpenes (11), other aldehydes (4),
                     Agronomy 2022, green   leaf
                                    12, x FOR    volatiles
                                              PEER REVIEW(3), and two other volatile compounds (isoamyl acetate and α-ionone)                  6o
                                    (Supplementary Table S1). The emission rates of monoterpenes were relatively high,
                                    followed by sesquiterpenes (Figure 2).

                                 Figure 2. The proportion of major chemical classes from eight mānuka genotypes (n = 5). A set of
                                                    Figure 2. The proportion of major chemical classes from eight mānuka genotypes (n = 5). A se
                                 level contrasts was constructed using the “relevel” function in R. Bars show mean ± SE emissions,
                                                    level contrasts was constructed using the “relevel” function in R. Bars show mean ± SE emissio
                                 and different letters
                                                    andindicate significant
                                                         different            differences
                                                                   letters indicate        between
                                                                                    significant      genotypes.
                                                                                                differences between genotypes.

                                                        Using a threshold of VIP coefficient ≥ 1, twenty-three volatile compounds were
                                                   lected as the most contributory compounds in discriminating the eight plant genoty
                                                   (Supplementary Table S1 and Figure S1). The proportions of selected compounds, inclu
                                                   ing green leaf volatiles, monoterpenoids, sesquiterpenes, and other compounds, w
                                                   compared between plant genotypes. The results show significant differences in all
                                                   lected green leaf volatiles (Figure 4, Supplementary Table S3).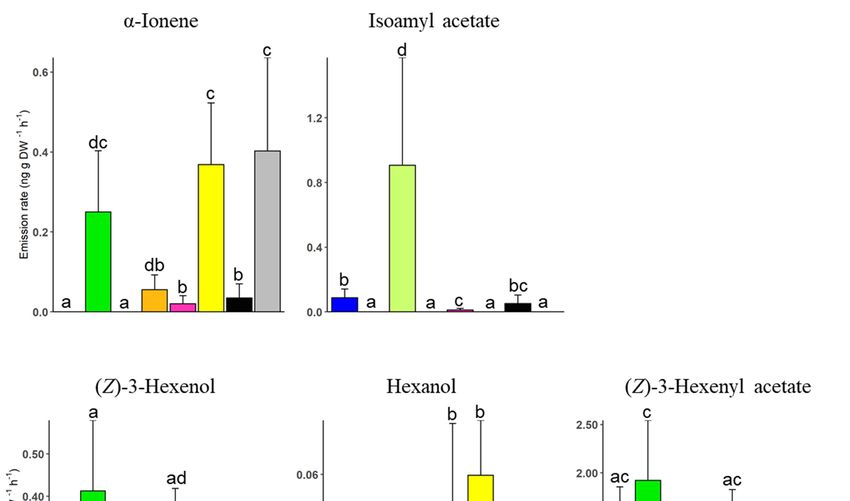
Agronomy 2022, 12, 169                                                                                                           6 of 13

                                      The proportions of respective chemical classes were compared between the eight plant
                                genotypes (Figure 2, Supplementary Table S2). The results show a significant reduction
                                in total monoterpenoids in the mint green clone than the blue (t = 3.35, p = 0.002), lime
                                green (t = 2.62, p = 0.013), orange (t = 2.83, p = 0.008), pink (t = 2.72, p = 0.011), yellow
                                (t = 3.13, p = 0.004), and the CVT4 cultivar (t = 2.97, p = 0.006). Green leaf volatiles were
                                significantly high in lime green clone compared to mint green (t = −3.16, p = 0.003), orange
                                (t = −2.09, p = 0.045), CVT2 (t = −3.19, p = 0.003), and CVT4 (t = −3.32, p = 0.002), whereas
                                the proportion of other volatiles was significantly high in the mint green clone than blue
                                (t = −2.48, p = 0.019), orange (t = −2.95, p = 0.006), pink (t = −3.56, p = 0.001), and CVT2
                                (t = −2.49, p = 0.018). Monoterpenoids, other aldehydes, and the total volatile emissions
                                did not differ between genotypes (Figure 2, Supplementary Table S2).
                                      The sparse partial least square discriminant analysis based on the individual volatile
                                compounds identified from mānuka plants clearly separates some genotypes. For example,
                                the first two components, which accounted for over 35% of the total variance, show a
Agronomy 2022, 12, x FOR PEER REVIEW
                                separation of the yellow clone from others, while the lime green and pink clones highly
                                overlap. There was also a separation between the two cultivars (CVT2 and CVT4) and
                                some clones (Figure 3).

                                     Figure
                                   Figure       3. Sparse
                                            3. Sparse partialpartial   leastdiscriminant
                                                               least square   square discriminant
                                                                                          analysis scores analysis
                                                                                                          plot based scores    plot based
                                                                                                                     on the thirty-four       on the thir
                                                                                                                                         volatile
                                     tile compounds
                                   compounds      identifiedidentified     from the
                                                              from the headspace       headspace
                                                                                    of eight mānuka of   eight mānuka
                                                                                                       genotypes              genotypes
                                                                                                                   (n = 5). The              (n = 5). Th
                                                                                                                                plot shows the
                                   first
                                     thetwo   latent
                                          first  twovariables    (components
                                                      latent variables         1 and 2), which1explained
                                                                             (components         and 2), about
                                                                                                           which  35%  of the totalabout
                                                                                                                    explained       variance.
                                                                                                                                           35% of the t
                                        Using a threshold of VIP coefficient ≥ 1, twenty-three volatile compounds were se-
                                          Emission
                                   lected as            of (Z)-3-hexenol
                                             the most contributory   compoundswasinsignificantly
                                                                                     discriminatinghigher     inplant
                                                                                                      the eight  the genotypes
                                                                                                                      lime green clon
                                   (Supplementary   Table S1
                                    green (t = −2.26,      p =and Figure S1).
                                                                0.031),       The proportions
                                                                         orange    (t = −2.07,of selected compounds,
                                                                                                 p = 0.046),    CVT2including
                                                                                                                        (t = −7.17, p <
                                   green leaf volatiles, monoterpenoids, sesquiterpenes, and other compounds, were com-
                                    CVT4 (t = −2.67, p = 0.012). Similarly, (Z)-3-hexenyl acetate was significantly h
                                   pared between plant genotypes. The results show significant differences in all selected
                                    limeleaf
                                   green  green   clone
                                              volatiles    compared
                                                        (Figure          to mint Table
                                                                4, Supplementary   greenS3).
                                                                                           (t = −3.46, p = 0.002), orange (t = −2.1
                                    CVT2 (t = −3.11, p = 0.004), and CVT4 (t = −3.40, p = 0.002), while a significantly
                                    of hexanol was identified in the lime green clone and the CVT4 cultivar (Figur
                                    mentary Table S3). The proportions of isoamyl acetate and α-ionene also diff
                                    cantly between genotypes. The emission of isoamyl acetate was significantly h
                                    mint green clone than the blue (t = −2.84, p = 0.008), pink (t = −5.29, p < 0.001), a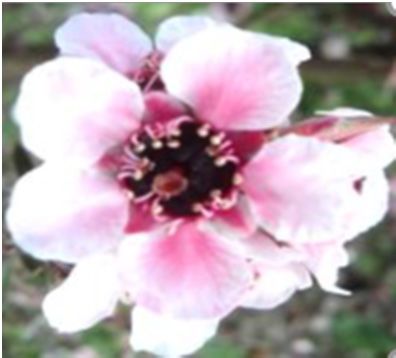
Agronomy 2022, 12, 169 Agronomy 2022, 12, x FOR PEER REVIEW                                                                                 7 of 13       8 of

                                  Figure 4. Comparison    of selected
                                                      Figure            green leaf
                                                              4. Comparison          volatiles
                                                                                of selected      andleaf
                                                                                             green    other  compounds
                                                                                                         volatiles         (α-ionene
                                                                                                                   and other compoundsand(α-ionene
                                                                                                                                           isoamyland isoam
                                  acetate) between genotypes     (n = 5).genotypes
                                                      acetate) between     Compounds  (n = were   selected based
                                                                                            5). Compounds           on theirbased
                                                                                                              were selected        on their VIP(≥
                                                                                                                             VIP coefficients     1).
                                                                                                                                                coefficients (≥
                                                      A setwas
                                  A set of level contrasts   of level  contrasts using
                                                                  constructed     was constructed
                                                                                         the “relevel”using the “relevel”
                                                                                                          function         function
                                                                                                                     in R. Bars showin R. Bars±show
                                                                                                                                       mean      SE mean ± S
                                                      emissions,
                                  emissions, and different  lettersand  different
                                                                     indicate     letters indicate
                                                                               significant         significant
                                                                                             differences        differences
                                                                                                           between          between genotypes.
                                                                                                                      genotypes.

                                                          The emission
                                       Emission of (Z)-3-hexenol     wasrates   of selectedhigher
                                                                            significantly     sesquiterpenes    alsogreen
                                                                                                      in the lime     differed significantly
                                                                                                                            clone   than mint between m
                                                     nuka  genotypes.   For  instance,  the yellow   clone  emitted   a significantly
                                  green (t = −2.26, p = 0.031), orange (t = −2.07, p = 0.046), CVT2 (t = −7.17, p < 0.001), and       high  amount    of (E
                                                     α-bergamotene    compared     to blue  (t = −7.95, p < 0.001), lime  green
                                  CVT4 (t = −2.67, p = 0.012). Similarly, (Z)-3-hexenyl acetate was significantly higher in the (t = −3.54, p = 0.001), mi
                                                     green (t = −7.95, p < 0.001), orange (t = −3.30, p = 0.002), pink (t = −3.26, p = 0.003), CVT2 (t
                                  lime green clone compared to mint green (t = −3.46, p = 0.002), orange (t = −2.13, p = 0.041),
                                                     −7.95, p < 0.001), and CVT4 (t = −7.95, p < 0.001). A significant amount of isoledene, yla
                                  CVT2 (t = −3.11, p = 0.004), and CVT4 (t = −3.40, p = 0.002), while a significantly low
                                                     gene, γ-cadinene, and β-elemene was also released by the yellow clone (Figure 6, Suppl
                                  amount of hexanol was identified in the lime green clone and the CVT4 cultivar (Figure 4,
                                                     mentary Table S2). The blue clone also emitted a higher amount of isoledene, ylangen
                                  Supplementary Table     S3). The proportions
                                                     α-amorphene,    and β-selinene   ofthan
                                                                                         isoamyl    acetate
                                                                                               the mint   greenand      and thealso
                                                                                                                    α-ionene
                                                                                                                 clone           twodiffered
                                                                                                                                       cultivars (Figure
                                  significantly between   genotypes.    The
                                                     Supplementary Table S5). emission    of  isoamyl    acetate  was   significantly   higher
                                  in the mint green clone than the blue (t = −2.84, p = 0.008), pink (t = −5.29, p < 0.001), and
                                  CVT2 (t = −3.47, p = 0.002), while the compound was not identified in lime green, orange,
                                  yellow, and CVT4. α-ionene, on the other hand, was not identified in the blue and mint
                                  green clones (Figure 4, Supplementary Table S3).
                                       The proportions of the selected monoterpenoids varied significantly between geno-
                                  types (Figure 5, Supplementary Table S4). For instance, the yellow clone emitted signifi-
                                  cantly higher amount of eucalyptol than the orange (t = −2.05, p = 0.049), pink (t = −2.46,
                                  p = 0.019), and CVT4 (t = −2.47, p = 0.019). Similary, sabinene’s emission was significantly
                                  higher in the yellow clone compared to the mint green (t = −2.48, p = 0.019), orange
                                  (t = −2.59, p = 0.015), and pink clones (t = −2.16, p = 0.039), while β-myrcene was signifi-
                                  cantly higher in CVT2 than the blue (t = −3.05, p = 0.005), lime green (t = −3.96, p < 0.001),
                                  mint green (t = −2.81, p = 0.008), and yellow clones (t = −3.58, p = 0.001). Eucalyptol,
                                  α-phellandrene, sabinene, and o-cymene were not identified in the lime green clone and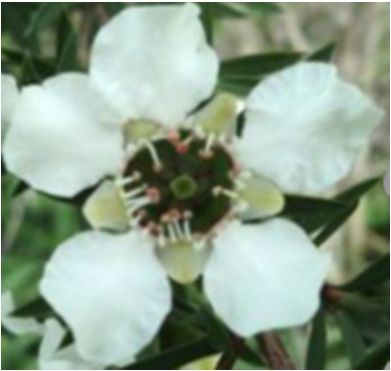
Agronomy 2022, 12, 169 8 of 13
CVT2
Agronomy 2022, 12, xcultivar, while the
emission of nerol and perillene also varied between genotypes
FOR PEER REVIEW 9 of 14
(Figure 5). A summary of all the comparisons is available in Supplementary Table S4.
Figure 5. Emission rates
Figurefor
5. selected
Emission monoterpenoids by different genotypes
rates for selected monoterpenoids by different(ngenotypes
= 5). Compounds
(n = 5). Compounds
were selected basedwere selected
on their VIPbased
coefficients (≥1).
on their VIP coefficients
A set of(≥1).
levelA set of level contrasts
contrasts was constructed
was constructed usingusing the
“relevel”
the “relevel” function function
in R. Bars show in mean
R. Bars±show mean ± SE emissions,
SE emissions, and different
and different letters significant
letters show show significant dif-
ferences between genotypes.
differences between genotypes.
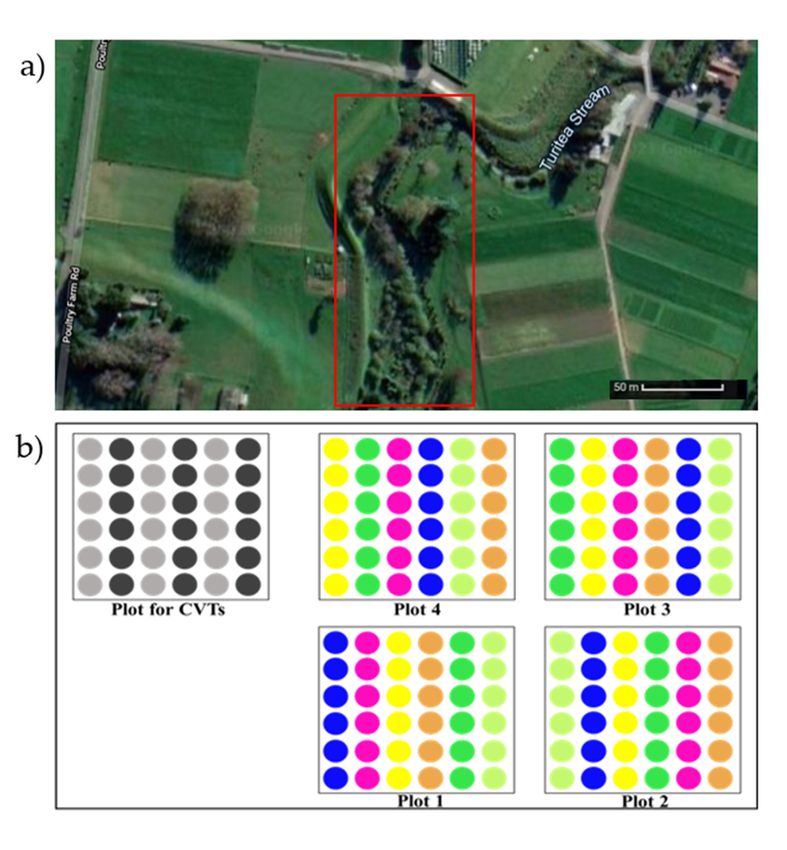
The emission rates of selected sesquiterpenes also differed significantly between
manuka genotypes. For instance, the yellow clone emitted a significantly high amount of
(E)-α-bergamotene compared to blue (t = −7.95, p < 0.001), lime green (t = −3.54, p = 0.001),
mint green (t = −7.95, p < 0.001), orange (t = −3.30, p = 0.002), pink (t = −3.26, p = 0.003),
CVT2 (t = −7.95, p < 0.001), and CVT4 (t = −7.95, p < 0.001). A significant amount of
isoledene, ylangene, γ-cadinene, and β-elemene was also released by the yellow clone
(Figure 6, Supplementary Table S2). The blue clone also emitted a higher amount of
isoledene, ylangene, α-amorphene, and β-selinene than the mint green clone and the two
cultivars (Figure 6, Supplementary Table S5).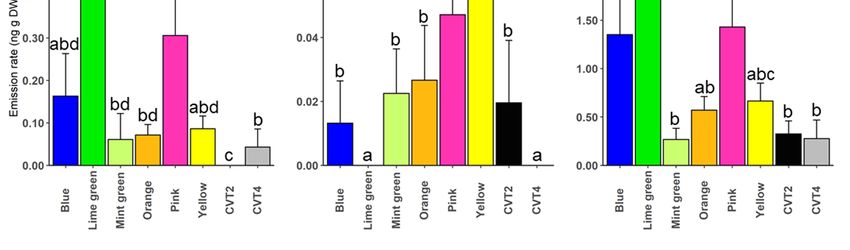
Agronomy 2022, 12, 169 Agronomy 2022, 12, x FOR PEER REVIEW
9 of 13
10 of 14
Figure 6. EmissionFigure
rates 6.for selected
Emission sesquiterpenes
rates by different
for selected sesquiterpenes genotypes
by different (n = (n
genotypes 5).= 5).
Compounds
Compounds were
were selected basedselected
on their VIPoncoefficients
based (≥1). A set
their VIP coefficients (≥1).ofAlevel
set ofcontrasts was was
level contrasts constructed
constructedusing
using the
the “relevel” function in R. Bars show mean ± SE emissions, and different letters show significant dif-
“relevel” function in R. Bars show mean ± SE emissions, and different letters show significant
ferences between genotypes.
differences between genotypes.
4. Discussion
4. Discussion
Mānuka plants are prolific VOC emitters, with terpenoids being very abundant in
Mānuka plantsthe are prolific
blend, VOC emitters,
as reported earlier [25].with terpenoids
Therefore, being
it is not very abundant
surprising that severalin the
terpenoids
blend, as reportedandearlier [25]. Therefore,
compounds belonging toitother
is not surprising
classes that several
differ between clones,terpenoids
giving them and
a distinct
compounds belonging to other
scent. The classesanalysis
multivariate differ between
shows thatclones, giving
some clones arethem
clearlya distinguishable
distinct scent.from
others based
The multivariate analysis showson their
thatVOC
some profile
clones(e.g.,
aretheclearly
yellow distinguishable
clone is well separated
fromfrom others),
others
based on their VOC profile (e.g., the yellow clone is well separated from others), while
other profiles have a high overlap (e.g., lime green and pink clones). The patterns in the
plants chemical profiles may be strongly shaped by their genetic composition. For instance,
the yellow clone originates from a field selection of L. scoparium var. scoparium, whereas
both the lime green and pinks clones were obtained by crossing L. scoparium var. scoparium
selection and L. rotundifolium cultivar (Table 1).
Green leaf volatiles (GLVs) were found, as a group, to differ significantly between
clones, with the pink and lime green clones producing more GLVs than the remaining clones.Agronomy 2022, 12, 169 10 of 13
This trend can also be observed when looking at individual compounds (Z)-3-hexenol and
(Z)-3-hexenyl acetate. GLVs are typically foliar volatiles emitted upon mechanical damage
such as that caused by herbivory, and are well known to be involved in plant defences
against herbivores and pathogens by acting as insect repellents or deterrents, natural enemy
(parasitoid and predator) attractants, microbial growth inhibitors, and by directly eliciting
or priming plants defence responses [31,32]. For example, (Z)-3-hexenol, a ubiquitous
wound-induced compound, can repel herbivores, attract predators and parasitoids, and is
involved in priming [33]. Other GLVs that differed between clones such as (Z)-3-hexenyl
acetate and hexanol also mediate direct and indirect plant defences [34,35]. Therefore,
selecting plant clones rich in GLVs could be useful to take advantage of plants’ natural
defences, especially under the increased pressure of introduced pests and pathogens due to
global commerce, human mobility, and climate change.
GLVs are also used by plants to attract other beneficial community members, such as
pollinators. For instance, plants can use GLVs, including (Z)-3-hexenol and (Z)-3-hexenyl
acetate, to recruit non-specific pollinators like wasps, which are typically attracted to prey-
related plant scents [36]. Pollinators may also use the foliage scent as a background to
identify the right host. A study by Karpati and colleagues [37] showed that hawkmoths
(Manduca sexta) are more attracted to floral scents when these are presented against the right
background (i.e., host plant foliage) than to floral scents alone or presented simultaneously
with non-host foliage.
Total sesquiterpenoids and individual monoterpenes eucalyptol, α-phellandrene, β-
myrcene, sabinene, o-cymene nerol, perillene, and 11 sesquiterpenes also differed between
clones (Figures 5 and 6). Terpenoids have been associated with differential pollinator
attraction in other systems. For instance, myrcene, along with two other monoterpenes, was
found to be a strong determinant of bumble bee visitation in monkeyflowers [38] and are
involved in distinguishing the bouquet of six different species in the family Apiaceae visited
by different pollinators [39], while bergamotene was found to drive pollinator preferences
independently from pollen rewards in seep monkeyflower [40] and have a dual role in
pollinator attraction and anti-herbivore defence in wild tobacco (Nicotiana attenuata) [41].
These studies suggest that specific terpenoids can mediate pollinator preference. In this case,
compounds, including both β-myrcene and (E)-α-bergamotene, show more differences in
emission between clones and would be interesting candidates for further exploration.
Given that VOCs change in response to biotic and abiotic stress, changes in their
emission can be an honest signal of plant quality to the pollinator. A study by Burkle
and Runyon [42] manipulated drought and herbivory for four forb species to determine
their individual and combined effects on visual plant traits, plant scents, and pollinator
visitation. The authors found VOCs, but not visual traits, to be highly responsive to
drought and herbivory and closely correlated with pollinator visitation, suggesting that
VOCs, rather than visual cues, provide information on plant quality to pollinators. Another
study showed that ozone exposure of Brassica nigra degrades floral scents and changes
the ratios of compounds, leading to reduced pollinator attractiveness [43]. These studies
highlight the importance of VOCs as plant quality indicators, especially under changing
environmental conditions.
A previous study using the same mānuka plants to investigate pollinator visitation
found the pink and lime green clones to be the most visited plants by honey bees in
2014 [21]. The two clones emit higher quantities of GLVs, suggesting that these compounds
could be involved in honey bee attraction. The same study showed that sugar content
(µg) per flower was a better predictor of bee visitation than visual cues such as flower
density; and that the amount of DHA (the molecule of interest for honey producers) was
not significantly correlated with pollinator visitation, showing that high DHA-producing
plants are not necessarily more attractive to honey bees. Therefore, it would be interesting
to explore the relationship between VOCs and sugar content.
Mānuka honey has high recognition globally as a rich and essential food. Like other bee
products, mānuka honey contains many secondary metabolites, including VOCs. VolatileAgronomy 2022, 12, 169 11 of 13
compounds in honey are diverse and include terpenes, fatty acid-derived compounds,
ketones, and aldehydes, among others [44,45]. Measuring plant volatiles and the presence
of these compounds in honey may contribute to characterizing the aroma of honey (volatile
markers) and increase our understanding of their botanical and geographical origins.
Besides, mānuka honey has high antimicrobial properties [15], and it would be interesting
to explore whether plant-derived volatiles contribute to this and other known properties of
honey and other bee products such as propolis [46].
This study only comprises data from a single year, season and plants tested under
similar environmental conditions. However, VOCs are highly dynamic in response to
internal and external changes experienced by plants, such as phenological stage and
environmental factors [3]. A study on wild mānuka plants conducted on the Central
Plateau of North Island (New Zealand) showed that factors such as season, herbivore
damage, soil properties, and the vicinity of invasive plant species have a substantial impact
on VOC emissions [25]. Therefore, further studies need to explore the VOC emissions of
different mānuka clones in their cultivation areas and how internal and external factors
influence these emissions. Moreover, further bee visitation tests need to be conducted,
integrating plant scent as a variable, and the relationship between other plant traits and
VOC emissions must be further explored. Finally, bees’ use of plant scent as an indicator of
plant quality in mānuka promises to be an exciting area for new research.
5. Conclusions
The market’s interest in honey with high bioactive compounds, such as MGO, has
driven the selection of mānuka clones based on the DHA content (the MGO precursor) in
their nectar. However, a high DHA content does not secure high honey bee visitation. Floral
scents are key to pollinator attraction and preference. Therefore, a better understanding of
the role of plant volatiles in honey bee visitation to mānuka plants would significantly con-
tribute to the honey industry seeking to balance high DHA nectar contents with successful
pollinator visitation to enhance honey production. This study shows that eight mānuka
genotypes (six clones and two wild varieties) differ significantly in their VOC emissions.
The lime green and pink clones emitted more GLVs, while the production of terpenoids was
mainly compound-dependent and invites further research to elucidate their relationship
with pollinator attraction and preference and to explore the role of VOCs in the chemical
composition and properties of bee products (honey and propolis) and plant defence.
Supplementary Materials: The following are available online at https://www.mdpi.com/article/
10.3390/agronomy12010169/s1, Figure S1. Loading values of variables selected on each component.
Table S1. List of volatile compounds identified from mānuka plants, under their respective chemical
classes and their variable importance in projection (VIP) coefficients under various components.
Table S2. GLM summary for major chemical classes. Table S3. GLM summary for green leaf volatiles
and other compounds with VIP coefficient ≥ 1. Table S4. GLM summary for monoterpenoids with
VIP coefficient ≥ 1. Table S5. GLM summary for sesquiterpenoids with VIP coefficient ≥ 1.
Author Contributions: A.C.M. conceived and designed the experiment. All authors contributed to
data collection. E.E. analyzed the data. A.C.M. and E.E. led the writing of the manuscript. K.M.T.
and N.R. were involved in editing and providing comments on the manuscript. All authors have
read and agreed to the published version of the manuscript.
Funding: Massey University supported this work through a summer scholarship provided to NR.
Data Availability Statement: Data will be made available upon request.
Acknowledgments: We wish to thank Julia Bohórquez Rodríguez de Medina for permission to use
her pictures of mānuka flowers. We also thank Jonathan Stephens and COMVITA for allowing us
to use their clones for this experiment. We are also grateful to Jorge Bresciano for his assistance on
data collection, and to Cleland Wallace, Tracy Harris, Shaun Nielson and Paul Barrett (all at Massey
University) for their technical support.
Conflicts of Interest: The authors declare no conflict of interest.Agronomy 2022, 12, 169 12 of 13
References
1. Pichersky, E.; Gershenzon, J. The formation and function of plant volatiles: Perfumes for pollinator attraction and defense.
Curr. Opin. Plant Biol. 2002, 5, 237–243. [CrossRef]
2. Clavijo McCormick, A.; Unsicker, S.B.; Gershenzon, J. The specificity of herbivore-induced plant volatiles in attracting herbivore
enemies. Trends Plant Sci. 2012, 17, 303–310. [CrossRef]
3. Clavijo McCormick, A. Can plant–natural enemy communication withstand disruption by biotic and abiotic factors? Ecol. Evol.
2016, 6, 8569–8582. [CrossRef]
4. Effah, E.; Holopainen, J.K.; McCormick, A.C. Potential roles of volatile organic compounds in plant competition. Perspect. Plant
Ecol. Evol. Syst. 2019, 38, 58–63. [CrossRef]
5. Pettersson, J.; Ninkovic, V.; Ahmed, E. Volatiles from different barley cultivars affect aphid acceptance of neighbouring plants.
Acta Agric. Scand. B—Plant Soil Sci. 1999, 49, 152–157.
6. Keskitalo, M.; Pehu, E.; Simon, J.E. Variation in volatile compounds from tansy (Tanacetum vulgare L.) related to genetic and
morphological differences of genotypes. Biochem. Syst. Ecol. 2001, 29, 267–285. [CrossRef]
7. Vivaldo, G.; Masi, E.; Taiti, C.; Caldarelli, G.; Mancuso, S. The network of plants volatile organic compounds. Sci. Rep. 2017,
7, 11050. [CrossRef]
8. Moreira, X.; Abdala-Roberts, L. Specificity and context-dependency of plant–plant communication in response to insect herbivory.
Curr. Opin. Insect Sci. 2019, 32, 15–21. [CrossRef]
9. Effah, E.; Barrett, D.P.; Peterson, P.G.; Godfrey, A.J.R.; Potter, M.A.; Holopainen, J.K.; Clavijo McCormick, A. Natural variation in
volatile emissions of the invasive weed Calluna vulgaris in New Zealand. Plants 2020, 9, 283. [CrossRef]
10. Ronghua, Y.; Mark, A.F.; Wilson, J.B. Aspects of the ecology of the indigenous shrub Leptospermum scoparium (Myrtaceae) in New
Zealand. N. Z. J. Bot. 1984, 22, 483–507. [CrossRef]
11. Stephens, J.M.C.; Molan, P.C.; Clarkson, B.D. A review of Leptospermum scoparium (Myrtaceae) in New Zealand. N. Z. J. Bot. 2005,
43, 431–449. [CrossRef]
12. Derraik, J.G. New Zealand manuka (Leptospermum scoparium; Myrtaceae): A brief account of its natural history and human
perceptions. N. Z. Gard. J. 2008, 11, 4–8.
13. Dawson, M. A history of Leptospermum scoparium in cultivation-discoveries from the wild. New Plantsman 1997, 4, 51–59.
14. Primack, R.B.; Lloyd, D.G. Andromonoecy in the New Zealand montane shrub manuka, Leptospermum scoparium (Myrtaceae).
Am. J. Bot. 1980, 67, 361–368. [CrossRef]
15. Mavric, E.; Wittmann, S.; Barth, G.; Henle, T. Identification and quantification of methylglyoxal as the dominant antibacterial
constituent of Manuka (Leptospermum scoparium) honeys from New Zealand. Mol. Nutr. Food Res. 2008, 52, 483–489. [CrossRef]
[PubMed]
16. Alvarez-Suarez, J.M.; Gasparrini, M.; Forbes-Hernández, T.Y.; Mazzoni, L.; Giampieri, F. The composition and biological activity
of honey: A focus on manuka honey. Foods 2014, 3, 420–432. [CrossRef]
17. Niaz, K.; Maqbool, F.; Bahadar, H.; Abdollahi, M. Health benefits of manuka honey as an essential constituent for tissue
regeneration. Curr. Drug Metab. 2017, 18, 881–892. [CrossRef]
18. Williams, S.; King, J.; Revell, M.; Manley-Harris, M.; Balks, M.; Janusch, F.; Kiefer, M.; Clearwater, M.; Brooks, P.; Dawson, M.
Regional, annual, and individual variations in the dihydroxyacetone content of the nectar of mānuka (Leptospermum scoparium) in
New Zealand. J. Agric. Food Chem. 2014, 62, 10332–10340. [CrossRef] [PubMed]
19. King, J. An Investigation of Factors That Contribute to Dihydroxyacetone Variation Observed in New Zealand Leptospermum
scoparium. Ph.D. Dissertation, University of Waikato, Hamilton, New Zealand, 2013.
20. Nickless, E.M. Influential Factors in Nectar Composition and Yield in Leptospermum scoparium.. Ph.D. Dissertation, Massey
University, Palmerston North, New Zealand, 2015.
21. Bohórquez Rodríguez de Medina, J. Companion Biota Associated with Leptospermum scoparium (mānuka; Myrtaceae).
Ph.D. Dissertation, Massey University, Palmerston North, New Zealand, 2018.
22. Clearwater, M.J.; Revell, M.; Noe, S.; Manley-Harris, M. Influence of genotype, floral stage, and water stress on floral nectar yield
and composition of mānuka (Leptospermum scoparium). Ann. Bot. 2018, 121, 501–512. [CrossRef] [PubMed]
23. Irwin, R.E.; Adler, L.S.; Brody, A.K. The dual role of floral traits: Pollinator attraction and plant defense. Ecology 2004, 85,
1503–1511. [CrossRef]
24. Ayasse, M.; Stökl, J.; Francke, W. Chemical ecology and pollinator-driven speciation in sexually deceptive orchids. Phytochemistry
2011, 72, 1667–1677. [CrossRef] [PubMed]
25. Effah, E.; Barrett, D.P.; Peterson, P.G.; Potter, M.A.; Holopainen, J.K.; Clavijo McCormick, A. Seasonal and environmental variation
in volatile emissions of the New Zealand native plant Leptospermum scoparium in weed-invaded and non-invaded sites. Sci. Rep.
2020, 10, 11736. [CrossRef] [PubMed]
26. Sheridan, R.E. Environmental and Genetic Influences on Growth, Flowering, and Nectar Production in Mānuka (Leptospermum
scoparium JR Forst. & G. Forst.). Ph.D. Dissertation, Massey University, Palmerston North, New Zealand, 2019.
27. Team, R.C. R: A language and environment for statistical computing. R Foundation for Statistical Computing. Vienna, Austria. 2021.
Available online: https://www.R-project.org/ (accessed on 27 December 2021).
28. Dowdy, N.J.; Conner, W.E. Nonchalant flight in tiger moths (Erebidae: Arctiinae) is correlated with unpalatability. Front. Ecol.
Evol. 2019, 7, 480. [CrossRef]Agronomy 2022, 12, 169 13 of 13
29. Lê Cao, K.-A.; Boitard, S.; Besse, P. Sparse PLS discriminant analysis: Biologically relevant feature selection and graphical displays
for multiclass problems. BMC Bioinform. 2011, 12, 253. [CrossRef]
30. Rohart, F.; Gautier, B.; Singh, A.; Lê Cao, K.-A. mixOmics: An R package for ‘omics feature selection and multiple data integration.
PLoS Comput. Biol. 2017, 13, e1005752. [CrossRef] [PubMed]
31. Scala, A.; Allmann, S.; Mirabella, R.; Haring, M.A.; Schuurink, R.C. Green leaf volatiles: A plant’s multifunctional weapon against
herbivoRes. and pathogens. Int. J. Mol. Sci. 2013, 14, 17781–17811. [CrossRef]
32. ul Hassan, M.N.; Zainal, Z.; Ismail, I. Green leaf volatiles: Biosynthesis, biological functions and their applications in biotechnology.
Plant Biotechnol. J. 2015, 13, 727–739. [CrossRef] [PubMed]
33. Wei, J.; Kang, L. Roles of (Z)-3-hexenol in plant-insect interactions. Plant Signal. Behav. 2011, 6, 369–371. [CrossRef] [PubMed]
34. Frost, C.J.; Mescher, M.C.; Dervinis, C.; Davis, J.M.; Carlson, J.E.; De Moraes, C.M. Priming defense genes and metabolites in
hybrid poplar by the green leaf volatile cis-3-hexenyl acetate. New Phytol. 2008, 180, 722–734. [CrossRef] [PubMed]
35. Williams, L.; Rodriguez-Saona, C.; Castle, S.C.; Zhu, S. EAG-active herbivore-induced plant volatiles modify behavioral responses
and host attack by an egg parasitoid. J. Chem. Ecol. 2008, 34, 1190–1201. [CrossRef] [PubMed]
36. Brodmann, J.; Twele, R.; Francke, W.; Hölzler, G.; Zhang, Q.-H.; Ayasse, M. Orchids mimic green-leaf volatiles to attract
prey-hunting wasps for pollination. Curr. Biol. 2008, 18, 740–744. [CrossRef]
37. Kárpáti, Z.; Knaden, M.; Reinecke, A.; Hansson, B.S. Intraspecific combinations of flower and leaf volatiles act together in
attracting hawkmoth pollinators. PLoS ONE 2013, 8, e72805. [CrossRef] [PubMed]
38. Byers, K.J.R.P.; Bradshaw, H.D., Jr.; Riffell, J.A. Three floral volatiles contribute to differential pollinator attraction in monkeyflow-
ers (Mimulus). J. Exp. Biol. 2014, 217, 614–623. [CrossRef]
39. Borg-Karlson, A.-K.; Valterová, I.; Nilsson, L.A. Volatile compounds from flowers of six species in the family Apiaceae: Bouquets
for different pollinators? Phytochemistry 1993, 35, 111–119. [CrossRef]
40. Haber, A.I.; Sims, J.W.; Mescher, M.C.; De Moraes, C.M.; Carr, D.E. A key floral scent component (β-trans-bergamotene) drives
pollinator preferences independently of pollen rewards in seep monkeyflower. Funct. Ecol. 2019, 33, 218–228. [CrossRef]
41. Zhou, W.; Kügler, A.; McGale, E.; Haverkamp, A.; Knaden, M.; Guo, H.; Beran, F.; Yon, F.; Li, R.; Lackus, N.; et al. Tissue-Specific
Emission of (E)-α-Bergamotene Helps Resolve the Dilemma When Pollinators Are Also Herbivores. Curr. Biol. 2017, 27, 1336–1341.
[CrossRef] [PubMed]
42. Burkle, L.A.; Runyon, J.B. Drought and leaf herbivory influence floral volatiles and pollinator attraction. Glob. Change Biol. 2016,
22, 1644–1654. [CrossRef] [PubMed]
43. Farré-Armengol, G.; Peñuelas, J.; Li, T.; Yli-Pirilä, P.; Filella, I.; Llusia, J.; Blande, J.D. Ozone degrades floral scent and reduces
pollinator attraction to flowers. New Phytol. 2016, 209, 152–160. [CrossRef]
44. Langford, V.; Gray, J.; Foulkes, B.; Bray, P.; McEwan, M.J. Application of selected ion flow tube-mass spectrometry to the
characterization of monofloral New Zealand honeys. J. Agric. Food Chem. 2012, 60, 6806–6815. [CrossRef]
45. Machado, A.M.; Miguel, M.G.; Vilas-Boas, M.; Figueiredo, A.C. Honey volatiles as a fingerprInt. for botanical origin—A review
on their occurrence on monofloral honeys. Molecules 2020, 25, 374. [CrossRef] [PubMed]
46. Mountford-McAuley, R.; Prior, J.; Clavijo McCormick, A. Factors affecting propolis production. J. Apic. Res. 2021, 1–9. [CrossRef]You can also read