LWT - Universidade NOVA de Lisboa
←
→
Page content transcription
If your browser does not render page correctly, please read the page content below
LWT - Food Science and Technology 154 (2022) 112688
Contents lists available at ScienceDirect
LWT
journal homepage: www.elsevier.com/locate/lwt
Impact of temperature during beer storage on beer chemical profile
Inês M. Ferreira a, Flávia Freitas b, Sara Pinheiro b, Maria Filipa Mourão c, Luís Ferreira Guido a,
Marco Gomes da Silva b, *
a
REQUIMTE/LAQV, Departamento de Química e Bioquímica, Faculdade de Ciências, Universidade do Porto, Rua do Campo Alegre 687, 4169-007, Porto, Portugal
b
LAQV/REQUIMTE, Department of Chemistry, NOVA School of Science and Technology, Universidade Nova de Lisboa, 2829-516, Caparica, Portugal
c
Instituto Politécnico de Viana do Castelo, Avenida do Atlântico, 4900-348, Viana do Castelo, Portugal
A R T I C L E I N F O A B S T R A C T
Keywords: Aiming to gain insights into the impact of storage conditions on the chemical profile of beer samples, changes on
Beer the relative amount of several chemical classes of compounds was monitored. The influence of storage conditions
Temperature was statistically discerned using the hierarchical cluster analysis complemented by heatmap date visualization.
Furanic compounds
Aldehydes, furanic compounds and esters showed a clear role in beers stored at 37 ± 1 ◦ C (contribution >1, as
Aldehydes
obtained in the heatmap data visualization). The reaction rate constant and temperature dependence was well
Esters
described by the Arrhenius equation for these compound classes, for which the reaction rate increased with
increasing temperatures. The rate of development of furanic compounds, aldehydes and esters showed to be
almost 140, 90 and 20 times higher in beers stored at higher temperatures (37 ± 1 ◦ C) when compared to beers
stored at 4 ± 1 ◦ C, respectively. These results indicate that temperature was the main parameter contributing to
the major changes in beer chemical profile. Through olfactometric analysis, the major difference was found in
aged beers, both naturally and forced aged, where the prevalence of sweet and papery aroma notes were noticed,
linked to the development of β-damascenone and E-2-nonenal, respectively.
1. Introduction flavor during storage is mainly due to the development of aldehydes,
esters, higher alcohols, and other compounds arising from several steps
Beer aging is considered one of the most serious problems currently of the brewing process (Ferreira & Guido, 2018). Aldehydes are a group
faced by the brewing industry. Hence, changes in the beer chemical of compounds with a high contribution to beer staling. These com
composition during storage can be considered the main quality problem pounds are produced mainly through the Maillard reactions, Strecker
faced by brewers. Flavor instability or beer staling is a highly complex degradation and lipid oxidation (Baert et al., 2012). An increase of their
process owing to the numerous different oxidative and non-oxidative concentration in aged beers can significantly enhance the appearance of
reactions that take place throughout beer storage (Lehnhardt, Gastl, & unpleasant flavors, such as, nut, fat, fruit, cardboard, caramelic and
Becker, 2018). Consequently, utmost attention has been given to the bready flavors (Gonçalves et al., 2010; Wang, Li, Ji, Hu, & You, 2014).
study on the mechanisms behind the appearance of undesirable aromas Esters of short-chain and branched-chain fatty acids, which are most
in beer (Murakami, Goldstein, Navarro, Seabrooks, & Ryder, 2003; aroma-active, are arguably the most important volatile compounds in
Schieberle & Komarek, 2003, pp. 70–79). beer. They have a positive impact on the overall beer flavor, especially
A vast variety of flavors may arise, depending on the beer type as aroma, but excessive levels of esters can lead to overly fruity, fermented
well as on the storage conditions (Vanderhaegen, Neven, Verachtert, & off-flavors (Liu, 2015, pp. 357–374; Verstrepen et al., 2003). Esters, as
Derdelinckx, 2006). The course of aging of lager beers is well docu well as higher alcohols, are produced by the yeast metabolism during
mented since it is especially susceptible to chemical changes after 3–6 fermentation. Besides ethanol, higher alcohols are the major alcohols
months of storage at room temperature (Baert, De Clippeleer, Hughes, that impart sensory properties to beer. Higher alcohols impart a range of
De Cooman, & Aerts, 2012; Guido et al., 2007; Lehnhardt et al., 2018; organoleptic attributes such as alcoholic, fruity, pungent, solvent-like
Saison, De Schutter, Uyttenhove, Delvaux, & Delvaux, 2009; Vander and rose-like or floral, depending on the concentration and type of
haegen et al., 2006). The occurrence of changes in beer chemistry and alcohol (Liu, 2015, pp. 357–374). Hops (Humulus lupulus L.) are essential
* Corresponding author. Department of Chemistry, NOVA ST, Campus de Caparica, 2829-516, Caparica, Portugal.
E-mail address: mdr@fct.unl.pt (M. Gomes da Silva).
https://doi.org/10.1016/j.lwt.2021.112688
Received 6 September 2021; Received in revised form 20 October 2021; Accepted 21 October 2021
Available online 25 October 2021
0023-6438/© 2021 The Authors. Published by Elsevier Ltd. This is an open access article under the CC BY license (http://creativecommons.org/licenses/by/4.0/).
I.M. Ferreira et al. LWT 154 (2022) 112688
for the brewing process in order to confer singular sensory properties of absence of contaminations and/or carryover. The samples, with 4.0 mL
beer. Hop-derived compounds play a crucial role in beer flavor by volume each, with 0.8 g of sodium chloride (pure, LabChem, Loures,
contributing not only to the bitter taste but also to the fruity, citrus-like Portugal), were introduced in a 20 mL vial and sealed with Teflon-lined
and floral aromas; the latter is ascribed to terpenes in hops. The specific rubber septum/magnetic screw cap. The vials were stored at 4 ◦ C,
flavor notes derived from hops depends on the type of hopping pro overnight, to promote degasification of the samples. For the extraction,
cedure applied, during the wort boiling (Liu, 2015, pp. 357–374; Steven, the vials were equilibrated for 10 min at 40 ◦ C and then extracted for 30
2017). min at the same temperature. The thermal desorption of analytes was
As beer undergoes a huge variety of chemical reactions leading to the carried out by exposing the fiber to the GC injection port at 260 ◦ C for 3
development of staling compounds, and consequently staling aromas, min in a splitless mode.
the identification of chemical markers of beer aging, is extremely
important. To achieve this, a sample preparation methodology is 2.2.2. GC/MS conditions
required in order to pre-concentrate/isolate the target analytes. Solid The analyses were performed on a GC/MS system consisting of a
phase microextraction (SPME) has proven to be a suitable technique Bruker GC 456 with a Bruker mass selective detector Scion TQ (Bruker,
providing many advantages over conventional sample preparation Billerica, MA, USA). An automatic sampler injector was used: CTC
techniques (ben Hammouda, Freitas, Ammar, Da Silva, & Bouaziz, 2017; Analysis auto sampler CombiPAL (Agilent, Santa Clara, CA, USA). Data
Branco et al., 2020; Martins et al., 2018; Santos, da Silva, & Cabrita, were acquired with MSWS 8.2 Bruker and analyzed with Bruker MS Data
2020) for volatile organic compounds (VOCs) analysis. Frequently it is Review 8.0. The chromatographic separation was achieved on a ZB-
associated to gas chromatography/mass spectrometry (GC/MS) tech WAX PLUS capillary column (60 m × 0.32 mm i.d., 1.0 μm df) sup
niques (Martins et al., 2020; Ribeiro, Freitas, & da Silva, 2008) in order plied by Phenomenex (Torrance, CA, USA). The oven temperature pro
to characterize complex matrices, namely in beer analysis (Dennenlöhr, gram began at 40 ◦ C hold for 5 min, raised at 4 ◦ C.min− 1 up to 240 ◦ C
Thörner, Manowski, & Rettberg, 2020; Giannetti, Mariani, Torrelli, & and hold for 15 min. An acquisition delay of 15 min was carried out in
Marini, 2019). order to avoid the detection of the ethanol peak present in beer samples.
In recent years, intensive studies have been carried out regarding the Helium was used as carrier gas at a constant flow of 1.7 mL min− 1. The
sensory activity of the individual components of food and alcoholic MS transfer line and source temperatures were set at 240 ◦ C and 220 ◦ C,
beverages, like beer. The majority of accomplishments within this area respectively.
can be attributed to the combination of gas chromatography with The spectra were matched by NIST MS Search Program Version 2.3 g.
olfactometry detection (GC-O) (Plutowska & Wardencki, 2008). The To determine the retention times and characteristic mass fragments,
determination of analyte’s odor is possible thanks to the presence of a electron ionization (EI) at 70 eV mass spectra of analytes were recorded
special attachment, a so-called olfactometric port, connected in parallel at full scan, from 40 to 450 Da. The linear retention index (LRIs) values
to conventional detectors, such as flame-ionization detector (FID) or were calculated by analyzing the commercial hydrocarbon standard
mass spectrometer (MS) (Delahunty, Eyres, & Dufour, 2006). solution C8 – C20 (Sigma-Aldrich, Darmstadt, Germany), using the same
The present work combines the use of HS-SPME with gas chroma chromatographic conditions. The relative amount of individual com
tography/mass spectrometry (GC/MS) and gas chromatography – ponents are expressed as area ratio (AR) relative to the peak area of 1-
olfactometry (GC-O) analysis for the assessment of the volatile profile in octanol.
fresh, naturally and forced aged beers. These techniques, together,
allowed the detection of chemical markers of beer aging and, at the same 2.2.3. GC-O/FID conditions
time, the identification of the main aromas developed through the The analyses were performed on a GC-O/FID system consisting of an
storage time, contributing to the changes in beer flavor. The ability to Agilent 6890 chromatograph equipped with a GL Science PHASER GC
distinguish beers submitted to different storage conditions, regarding Olfactory Port and a flame ionization detector (FID) (Agilent, Santa
their volatile and aroma fingerprints, has been evaluated by multivariate Clara, CA, USA). Chromatographic separation was achieved on a DB-
techniques, namely hierarchical cluster analysis (HCA) and heat map 5ms capillary column (15 m × 0.25 mm i.d., 0.25 μm df) supplied by
ping and multiple correspondence analysis (MCA). Phenomenex (Torrance, CA, USA). About 1 m of deactivated silica col
umn, with 0.25 mm i.d., was connected through a “Y” piece, to link the
2. Materials and methods column to olfactometer and 1 m of deactivated silica column, with 0.25
mm i.d., was connected to the FID detector. The oven temperature
2.1. Sampling and aging assay program began at 35 ◦ C, holds for 2 min, raised at 4 ◦ C/min up to 140 ◦ C,
and raised at 20 ◦ C.min− 1 up to 270 ◦ C. Hydrogen was used as carrier gas
All beer samples were kindly provided by Super Bock Group (Porto, at constant flow of 1.2 mL min− 1. The water vapor flow at the olfac
Portugal). Beers were submitted to a naturally and forced aging process. tometer was set at 24 mL/min. The transfer line temperature was set at
During forced aging, beers were stored in an oven (Raypa, Incuterm, 270 ◦ C. LRIs values were calculated by analyzing the commercial hy
Barcelona, Spain) under controlled temperature at 37 ± 1 ◦ C, in order to drocarbon standard solution C8 – C20 (Sigma-Aldrich, Darmstadt, Ger
reproduce warm storage conditions. The differences in the relative levels many), using the same chromatographic conditions.
of several chemical classes were monitored during 7 and 14 days.
Additionally, the study was also conducted in natural aging conditions. 2.2.4. GC/TOFMS conditions
For this purpose, beers were stored during 3 and 6 months at 20 ± 2 ◦ C The analyses were performed on a LECO Pegasus BT GC/TOFMS
(room temperature) and at 4 ± 1 ◦ C (considered as control samples). comprised of an Agilent 7890B GC with a split/splitless injector (Agi
lent, Santa Clara, CA, USA) and a LECO Time-of-flight mass spectrom
2.2. Analysis of beers volatile fingerprint by HS-SPME-GC/MS and HS- eter (LECO, St. Joseph, MI, USA). Injections were performed by a CTC-
SPME-GC-O/TOF-MS Analytics L-PAL3 autosampler fitted with a 10 μL syringe (SETonic,
Ilmenau, Germany). Chromatographic separation was achieved on an
2.2.1. Preparation of the samples: HS-SPME extraction HP-5ms Ultra-inert column (30 m × 0.25 mm i.d., 0.25 μm df) supplied
The HS-SPME extraction was performed using a carboxen/divinyl by Agilent, CA, USA. The oven temperature program began at 35 ◦ C hold
benzene/polydimethylsiloxane fiber (Carb/DVB/PDMS, 1 cm, 50/30 for 2 min, raised at 4 ◦ C.min− 1 up to 140 ◦ C, and raised at 20 ◦ C.min− 1
μm film thickness (df)) supplied from Supelco (Bellefonte, PA, USA). up to 270 ◦ C. Helium was used as carrier gas at constant flow of 1.2 mL
Prior to use, the fiber was conditioned following the manufacturer’s min− 1. The MS transfer line and source temperatures were set at 300 ◦ C
recommendations. Fiber blanks were run periodically to ensure the and 270 ◦ C, respectively. LRIs values were calculated by analyzing the
2
I.M. Ferreira et al. LWT 154 (2022) 112688
commercial hydrocarbon standard solution C8 – C20 (Sigma-Aldrich, applied to characterize the data set, revealing natural groupings (or
Darmstadt, Germany), using the same chromatographic conditions. clusters) within it, through the representation of dendrogram (tree di
agram) and a heatmap. Squared Euclidean distances were used, and
clustering algorithm used was Ward’s minimum variance. Both outputs,
2.3. Statistical analysis tree diagram and heatmap, provided a clear and rapid visualization of
similarities and differences between the seven samples under study.
Peak areas of identified compounds were extracted from the chro Instead of calculating relationships pair-wise, the inter-relationships
matograms and used to calculate the area ratio (AR) relative to the peak among all the variables were evaluated and visualized using MCA. This
area of 1-octanol. These values were used to build the full data matrix, is a method that allows studying the association between two or more
consisting of 21 observations (7 beer samples, each one by three inde qualitative variables. It reduces the dimensionality of data and can be
pendent assays) and 42 variables (analytes). The complete list of these thought of as analogous to Principal Component Analysis (PCA) for
analytes is provided in Table 1. quantitative variables. In this work, MCA was applied to determine a
The differences between the sum of the relative content, represented relationship between the different storage conditions applied to beers
as the total area ratio (AR) ± SD, of each compound’s family found in samples, the aromas noticed by olfactometric analysis, and the com
aged beers (naturally and forced aged beers) and those found in fresh pounds identified by mass spectrometry.
beers (FB, considered as control samples), were compared using the t- All the statistical analyses were performed using Addinsoft
test. Statistically significant differences were considered for p < 0.05, p (v.2021.2.2.1129, 2021) XLSTAT statistical and data analysis solution,
< 0.01 and p < 0.001, to evaluate the strength of the observed New York, USA.
differences.
Multivariate analysis, in particular hierarchical cluster analysis
(HCA) and heat mapping and multiple correspondence analysis (MCA)
were applied to the present data. HCA is an exploratory tool, being
Table 1
Volatile compounds identified in beer samples (fresh, naturally and forced aged beers).
Nr. RT (min) Compound Most abundant ions (m/z) LRIcalc.a LRIlit. b
Odor descriptor c
1 17.760 Isobutyl acetate 43/41/56 1025 1018–1034 Alcoholic, Fruity
2 18.830 Ethyl butanoate 71/43/88/41/73/42 1050 1031–1055 Fruity
3 20.936 Isobutyl alcohol 41/43/42 1099 1090–1102 Alcoholic
4 22.481 Isoamyl acetate 43/55/70 1136 1103–1137 Fruity, banana
5 23.004 Ethyl pentanoate 43/70/85/55 1149 1138 Fruity
6 23.206 1-Butanol 41/56/43/55 1154 1142–1152 Alcoholic, sweet
7 25.758 Isoamyl alcohol 55/41/42/43/70 1217 1203–1253 Alcoholic, fruity
8 26.051 Limonene 67/93/68/94/41 1224 1193–1194 Citrus
9 27.018 Ethyl hexanoate 88/43/99/70/60 1249 1202–1251 Sweet, fruity
10 29.106 2-Furfuryl ethyl ether 81/82 1303 1297 Nutty, coffee
11 30.117 Unknown 1 69/41 1330
12 31.001 Unknown 2 106/109/108/73/41 1356
13 31.113 Unknown 3 79/45/93/137/77/43 1358
14 31.324 1-Hexanol 56/41/69 1364 1338–1380 Green, grass
15 33.363 Nonanal 57/41/70/81/95 1421 1388–1403 Aldehydic, sweet
16 34.446 Ethyl octanoate 88/70/101/57/41/127 1452 1407–1440 Fruity, sweet
17 34.631 1-Octen-3-ol 57/72 1457 1456 Sweet, perfumy
18 34.979 1-Heptanol 70/41/55 1467 1458–1460 Green, solvent
19 35.914 Furfural 95 1494 1463–1497 Caramel, bready
20 36.462 Unknown 4 81/96/67/79 1511 1492–1545 Sweet, fat, fruity
21 37.463 2-Acetylfuran 95/110 1542
22 37.877 Linalool 93/71/43/69/121 1554 1511–1523 Roasted, backed
23 38.441 1-Octanol 56/55/41/69/83 1571 1546–1554 Citrus, floral
24 38.516 Benzaldehyde 105/77/51 1574 1558–1561 Citrus, rose
25 41.103 Ethyl decanoate 88/101/70/55/41 1656 1506–1547 Almond
26 41.309 3-(Methylthio) propyl acetate 73/88/43 1663 1603–1647 Fruity, floral
27 41.687 Furfuryl alcohol 98/81/41 1675 1616–1672 Bready, burnt
28 42.174 Phenylacetaldehyde 91/92 1691 1630–1669 Floral
29 42.777 Ethyl 9-decenoate 55/88/41/69/101/110/135 1711 1674–1708 Fruity, fatty
30 43.254 α-Terpineol 93/59/81/43 1727 1709 Citrus, floral
31 43.882 3-(Methylthio) propanol 75/57/106 1748
32 44.741 Unknown 5 105/77 1777 1768–1792 Citrus, floral
33 44.894 Citronellol 69/41/60/81/95 1783 1783–1811 Floral, honey
34 46.060 Ethylphenyl acetate 91/164 1823 1777–1848 Floral, sweet
35 47.015 2-Phenylethyl acetate 104/43/91 1857 1785–1825 Waxy, fruity
36 47.115 Ethyl dodecanoate 88/101/70/55/41 1861
37 48.331 Unknown 6 43/71/41/73 1904 1914–1945 Floral, sweet
38 48.984 Ethylphenyl propanoate 104/91 1929 1859–1989 Rose, perfume
39 49.682 Phenylethyl alcohol 91/62/65/122 1955 Caprylic, vegetable
40 51.193 Hexanoic acidd 60/73/45/43/87 NC Caprylic
41 56.058 Octanoic acidd 60/73/45/87/101 NC Tallowy, caprylic
a
LRIcalc – retention index calculated from C8 – C20 n-linear alkanes; NC – not calculated.
b
LRIlit – linear retention indices reported in the literature for WAX capillary column (Aubert & Bourger, 2004; Bianchi, Careri, Mangia, & Musci, 2007; Escudero,
Campo, Fariña, Cacho, & Ferreira, 2007; Giannetti et al., 2019; Goodner & Technology, 2008; Kishimoto, Noba, Yako, Kobayashi, & Watanabe, 2018; Z.; Li et al., 2019;
Pereira et al., 2021; Welke, Manfroi, Zanus, Lazarotto, & Zini, 2012).
c
According to the information collected from www.thegoodscentscompany.com and from (Steven, 2017).
d
Tentative identification by NIST comparison.
3
I.M. Ferreira et al. LWT 154 (2022) 112688
3. Results and discussion The chromatic scale of the heatmap allows access to the relative
amount of each chemical class (from white, minimum, to dark,
3.1. Beer chemical profile maximum) and, consequently, to observe the chemical pattern for the
beers under study. The dendrogram (Fig. 1) built for HCA is an explor
The combination of HS-SPME with GC/MS is a powerful tool to atory tool that reveals clustering between the beers under study, gath
establish volatile fingerprints with great sensitivity, namely in food ering them according to their chemical profile’s similarities.
samples and beverages (Alves et al., 2020). In this work, beers submitted Despite the large number of potential variables among the samples, it
to different storage conditions (fresh, naturally aged (3 and 6 months at was possible to observe the formation of two principal clusters (Fig. 1):
20 ± 2 ◦ C) and forced aged beers (7 and 14 days at 37 ± 1 ◦ C)) were cluster 1 and cluster 2. Cluster 1 aggregates fresh beers (FB) and beers
analyzed. A commercial hydrocarbon mixture (C8 – C20) was used in stored at low temperatures (4 ± 1 ◦ C). In contrast, cluster 2 groups
order to calculate the linear retention indices (LRI). These LRI values naturally and forcibly aged beers. Fresh beers were characterized by the
were compared with those found in literature. lower levels of the compounds belonging to the chemical classes iden
A total of 42 metabolites were tentatively identified based on the tified, being the alcohols those that showed higher levels in these sam
comparison of their mass spectra to the reference database (NIST MS ples. When higher temperatures were applied, the relative chemical
Search Program Version 2.3), as well as the calculated LRI (LRIcalc.) with composition of beers changes: a highlighted increase in aldehydes, esters
the values reported in the literature (LRIlit.) for the polyethylene glycol and furanic compounds; a decrease in the relative contribution of al
(or equivalent) capillary column (Table 1). The total metabolites iden cohols; and a very low contribution of terpenes and fatty acids was
tified in this work are listed in Table 1 according to their elution order on observed, when compared to fresh beers.
a DB-WAX capillary column, and including their retention times (min), Regarding the chemical profile of beers submitted to different stor
LRI (LRIcalc and LRIlit), their most abundant ions and odor descriptors. age conditions, it is clearly demonstrated that temperature is the prin
The mentioned metabolites (Table 1) were identified in all beer samples cipal contributor to the dissimilarities observed among beers under
(fresh, naturally and forced aged beers). study. Despite naturally and forcibly aged beers are grouped in the same
The metabolites tentatively identified by MS, were grouped into six cluster, they belong to different sub-groups (B and A, respectively).
different chemical classes. These include esters (13), aldehydes (3), al Particularly, the higher levels of furanic compounds observed in beers
cohols (9), furanic compounds (4), fatty acids (3) and terpenes (4). exposed to higher temperature (37 ± 1 ◦ C), are found to be the key
compounds contributing to the chemical differences induced by tem
perature. In addition, the higher content of alcohols, terpenes and fatty
3.2. Beer chemical classes acids observed in naturally aged beers, compared to forced aged beer,
contributes to these dissimilarities. Regarding the fatty acids and ter
Table 2 shows the sum of the relative content of the compounds penes, it is possible to observe that the main factor contributing to
identified in each chemical class for beers submitted to different storage changes in their levels, is the time of storage, instead of temperature.
conditions. The statistical t-test was applied to estimate the differences Concerning the cluster 1, with the grouping of fresh beers and beers
in the relative content of esters, alcohols, aldehydes, furanic compounds, stored at low temperature (4 ± 1 ◦ C), it is possible to observe that storing
carboxylic acids and terpenes, in comparison to the relative levels of beer at low temperatures helps to protect the freshness of this beverage,
these classes found in fresh beers. conserving the original chemical profile of fresh beers, mainly by
A hierarchical cluster analysis (HCA) combined with the heatmap avoiding the development of aldehydes and furanic compounds.
representation was constructed in order to evaluate if cluster analysis
could be used to define chemical differences among beers exposed to
different storage conditions. The heatmap (Fig. 1) shows a graphical 3.3. Effect of storage temperature on the rate of development of staling
representation of the chromatographic data achieved for the 36 detected compounds in beer
and identified analytes subdivided into their correspondent chemical
class. The effect of temperature in a chemical reaction rate may be repre
Table 2
Sum of the relative content, represented as the total area ratio (AR) ± SD, of all the compounds identified in each defined chemical class for fresh beers (FB), natural
aged beers (3 and 6 months at 20 ± 2 ◦ C) and forced aged beers (7 and 14 days at 37 ± ± 1 ◦ C). * represents statistical differences with p < 0.05; ** represents statistical
differences with p < 0.01; and *** represents statistical differences with p < 0.001, in comparison to FB.
Natural Aged Beers Forced Aged Beers
Fresh Beers 4±1 C◦
20 ± 2 C
◦
37 ± 1 ◦ C
3m 6m 3m 6m 7d 14d
Esters
100.1672 ± 123.7924 ± 11.5267 143.6694 ± 2.9959 (p- 153.5435 ± 19.1218 (p- 171.0003 ± 2.6926 (p- 137.5158 ± 1.6751 (p- 152.2136 ± 6.3479 (p-
10.6515 (p-value = 0.060) value = 0.002)** value = 0.014)* value = 0.000)*** value = 0.004)** value = 0.002)**
Aldehydes
1.1831 ± 1.5557 ± 0.0609 (p- 1.8064 ± 0.3048 (p- 2.3645 ± 0.0519 (p- 4.0641 ± 0.2094 (p- 2.8789 ± 0.0767 (p- 4.4008 ± 0.0356 (p-
0.0833 value = 0.003)** value = 0.027)* value
I.M. Ferreira et al. LWT 154 (2022) 112688
Fig. 1. Heatmap and dendrogram representation of the chemical classes identified in beers under study (fresh beers (FB), naturally aged beers (3 and 6 months at 20
± 2 ◦ C) and forced aged beers (7 d and 14 d at 37 ± 1 ◦ C)). The content of each chemical class was illustrated through different colors (from white, minimum, to dark,
maximum). Dendrogram for the HCA results using Ward’s cluster algorithm to the data set was also included.
sented by Arrhenius equation: furanic compounds and esters, which showed to be the most affected by
the application of higher storage temperature.
(1)
− Ea/
k = A⋅e RT
It can be seen from the results shown in Table 2 that the ratio of rate
constants of aldehydes and furanic compounds at room temperature (20
where the k is the rate constant, A is the pre-exponential factor assumed
± 2 ◦ C) is nearly 10 times that at 4 ± 1 ◦ C. Additionally, the ratio of rate
to be independent of temperature, Ea is activation energy; R is the gas
constants of furanic compounds and aldehydes in beers stored at 37 ±
constant and T is the temperature in Kelvin.
1 ◦ C is nearly 130 and 70 times that at 4 ± 1 ◦ C, respectively, which
According to the rate constants of the chemical classes of compounds
means that the development of these chemical class of compounds in
under study at different temperatures, together with the corresponding
beer is temperature dependent. Regarding the ratio of rate constants of
temperature, the rate constants for each chemical classes at different
esters, they are lower when compared to the other classes of compounds.
temperatures were estimated, according to Arrhenius equation
Neverthless, the ratio of rate constant of esters in beers stored at 37 ±
(Table 3). The ratio of the rate of development of furanic compounds,
1 ◦ C is nearly 15 times that at 4 ± 1 ◦ C.
aldehydes and esters in beers stored at different temperatures were
The shelf-life of a product, namely beer, may be defined as the time
calculated by dividing the rate constants at different temperatures by
that essential characteristics are maintained under specific storage
those at 4 ± 1 ◦ C (Table 3).
conditions. Nonetheless, it may be estimated by accelerated stability
According to several authors, temperature have a great impact on
testing protocols. The determination of beer shelf-life was assessed,
beer fermentation and maturation kinetics and ester production during
using an accelerated beer aging, concerning different storage conditions
fermentation (Kucharczyk & Tuszyński, 2018; Nakatani, Fukui, Nagami,
(different times and temperatures), regarding furanic compounds, al
& Nishigaki, 1991), on stale flavor development (H. Li, Liu, He, Cui, &
dehydes and esters relative contents. Based on these indicators, beer
Hao, 2015) and on methional and phenylacetaldehyde development
shelf-life was estimated. From the results obtained, it is not completely
during beer aging (Soares da Costa et al., 2004). In this work, the in
reliable to choose a single marker to define the beer shelf-life. According
fluence of different storage temperatures was studied regarding the
to the results obtained, furanic compounds and aldehydes proved to be
levels of several chemical classes of compounds, such as, aldehydes,
good chemical markers for this purpose. Storing beer at lower
Table 3
Rate constant (k) and ratio of rate constants (in comparison to beers stored at 4 ± 1 ◦ C) obtained for aldehydes, furanic compounds and esters, for three different
temperatures (4 ± 1, 20 ± 2 and 37 ± 1 ◦ C).
ka Ratio of rate constants
Temperature ( C) ◦
Aldehydes Furanic Compounds Esters Aldehydes Furanic Compounds Esters
4 ◦C 0.0029 0.0005 0.1776 1.0 1.0 1.0
20 ◦ C 0.0243 0.0058 0.7157 8.4 11.6 4.0
37 ◦ C 0.1857 0.0632 2.6875 64.0 126.4 15.1
a
Estimated rate constant according to the Arrhenius equation.
5I.M. Ferreira et al. LWT 154 (2022) 112688
temperatures (4 ◦ C) increases its shelf-life, as expected. In contrast, correlation between the different identified aromas and chemical spe
higher storage temperatures (37 ± 1 ◦ C) showed to be detrimental for cies detected in beers submitted to the different storage conditions.
the beer shelf-life. Regarding furanic compounds and aldehydes, beers Fig. 3B shows the observations plot, where it is possible to see the
stored at 37 ± 1 ◦ C for 12 days mimic the impact on beer stability of contribution of the different beer samples analyzed for both dimensions.
beers stored at 20 ± 2 ◦ C during 6 months (beer best-before date). The data was reduced into a two-dimensional plot, where the first
dimension accounts for 10.25% of the variance and the second for
10.08%, yielding a total variance of 20.33%. Although the variability
3.4. Identification of volatile compounds in beer by GC-O/TOF-MS explained by MCA is 20% for the dimension 1 and 2 together, not un
usual in MCA, stills relevant since qualitative data are collected, namely
The flavor profile of beers submitted to different storage conditions subjective, like the sensorial panel olfactometric perceptions. Indeed,
were analyzed by an untrained sensory panel composed by 8, not- from the obtained bidimensional plot (Fig. 3) a dataset is represented as
trained, sensorial panel. Fresh beers, naturally aged and forced aged clouds of points in a multidimensional Euclidean space as described by
beers were analyzed with the purpose to understanding the impact of (Costa, Santos, Cunha, Cotter, & Sousa, 2013), showing in this case that
different storage times and temperatures on beer aromas/odors. a relationship exists and how variables are related, thus offering a valid
Combining olfactometric and chromatographic (with MS detection) in statistical result that can be visualized and interpreted.
formation, 15 compounds were olfactometric detected by all panel Analyzing the data in Fig. 3A, it is possible to observe that the fruity
members, of those, 11 were recognized (Table 4) by matching mass aromas identified in analyzed samples are due to the presence of ethyl
spectra with spectra of reference compounds in NIST MS Search Pro hexanoate and isoamyl acetate in beers matrix. In addition, the detec
gram Version 2.3 g, and LRI data from literature. Several other com tion of papery aroma is linked to the development of E-2-nonenal. The
ponents were identified by FID. However, no olfactory characteristics floral aromas perceived in analyzed beers were due to the presence of
were assigned since, probably, they were below the olfactory perception phenylacetaldehyde, ethylphenyl acetate and the unknown compounds
threshold of the untrained panel. The HS-SPME-GC/O-FID analysis was at RT = 15.29 min and RT = 16.29 min. The herbal aromas were
supported by GC/TOFMS analysis with an analytical column with the detected due to the presence of ethylphenyl acetate, and the sweet and
same low-polarity stationary phase in order to allow LRI calculations honey aromas identified are linked to the detection of nonanal, β-dam
and literature comparison. Indeed, less polar columns are known to ascenone and the unknown compound at RT = 16.49 min.
allow much higher reproducibility in the determination of LRI, regard Analyzing both Figures (Fig. 3A and B), it is possible to observe that
less of column size as well as film thickness and purchaser, as referred the fruity, floral and herbal aromas are correlated to all the analyzed
and studied by Mateus, Barata, Zrostlíková, da Silva, & Paiva, 2010, beer samples (fresh beers and natural and forced aged beers). However,
when compared with polar columns (Mateus et al., 2010). the papery and sweet aromas are highly correlated with natural and
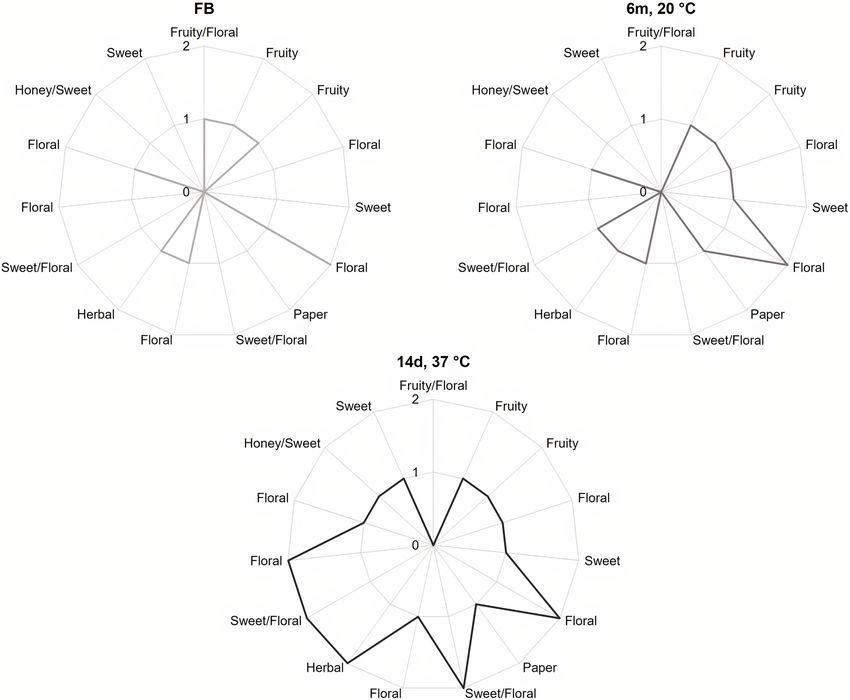
To create a visual profile of “fingerprint” of product attributes, spider forced aging. The papery aroma was identified due to the presence of E-
plots were created by plotting intensity values on each scale. Fig. 2 2-nonenal in aged beers, that is formed by the lipid-oxidation of fatty
shows attributes (aromas/odors) identified by the olfactometric analysis acids. This compound has been considered for several years the main
in fresh, naturally (6 months at 20 ± 2 ◦ C) and forced aged beers (14 responsible for the beer staling but, nowadays it is recognized as just a
days at 37 ± 1 ◦ C). part of a more complex picture of staling (Baert et al., 2012). The sweet
These plots illustrated that sweet, sweet/floral and sweet/honey aromas developed in natural and forced aged beers are well correlated
aromas were the most prominent flavor characteristics of forced aged with the presence of β-damascenone, a compound formed by the
beers (14 days at 37 ± 1 ◦ C). In addition, the perception of several acid-catalyzed hydrolysis of glycosides present in fresh beers (Chevance,
aromas, like herbal, increased in forced aged beers. Guyot-Declerck, Dupont, & Collin, 2002). Furthermore, nonanal was
Based on these information (aromas/odors, compounds and in also identified as a contributor for the detection of sweet aromas in the
tensities), MCA was applied to identify the odor profile of the analyzed analyzed aged beers. This compound is considered as a possible dihydro
beers. Fig. 3A shows the two-dimensional Categories plot, showing the
Table 4
Identification of flavoring compounds by HS-SPME-GC/O-FID in fresh (FB), naturally (6 months at 20 ± 2 ◦ C) and forced aged beers (14 days at 37 ± 1 ◦ C).
Nr. RT (min) LRI* LRI (Literature)a Aroma/Odor Compound Odor Threshold (μg/L)b Samplec
FB 6m, 14d,
20 ◦ C 37 ◦ C
1 2.48 826 – Fruity/Floral Unknown 1 1 0 0
2 6.23 875 872–875 Fruity Isoamyl acetate 1200 1 1 1
3 6.34 1000 995–1002 Fruity Ethyl hexanoate 210 1 1 1
4 7.44 1052 1046–1058 Floral Phenylacetaldehyde 1600 0 1 1
5 8.59 1103 1103–1106 Sweet Nonanal 18 0 1 1
6 10.06 1134 1115–1130 Floral Phenylethyl alcohol 125000 2 2 2
7 11.24 1161 1162 Papery E-2-nonenal 0.11 0 1 1
8 13.01 1199 1196–1205 Sweet/Floral Ethyl octanoate 900 0 0 2
9 14.14 1234 1240–1248 Floral Ethyl phenylacetate 160 1 1 1
10 14.40 1244 1252–1265 Herbal 2-phenylethyl acetate 3800 1 1 2
11 15.29 1272 – Sweet/Floral Unknown 2 0 1 2
12 16.11 1298 1297 Floral Ethyl nonanoate 1200 0 0 2
13 16.29 1303 – Floral Unknown 3 1 1 1
14 16.49 1310 – Honey/Sweet Unknown 4 0 0 1
15 19.14 1398 1386–1393 Sweet β-damascenone 25 0 0 1
*LRIcalc – retention index calculated from C8 – C20 n-linear alkanes in DB-5ms capillary column.
a
(Attchelouwa et al., 2020; Babushok, Linstrom, & Zenkevich, 2011; Cabrita, Aires de Sousa, Gomes Da Silva, Rei, & Costa Freitas, 2012; El-Sayed, Heppelthwaite,
Manning, Gibb, & Suckling, 2005; Goodner & Technology, 2008; Z.; Li et al., 2019).
b
(Miller, 2019).
c
The different numbers displayed in the table correspond to the different intensities felt, for each compound, in the different analyzed samples: 0 – not detected; 1 –
medium intensity; 2 – high intensity.
6I.M. Ferreira et al. LWT 154 (2022) 112688
Fig. 2. Sensory profiles of beer samples (fresh beers (FB), naturally aged beers (6 months at 20 ± 2 ◦ C) and forced aged beers (14 days at 37 ± 1 ◦ C). Individual
aromas/odors are positioned like the spokes of a wheel around a center (zero, not detected) point, with the spokes representing attribute intensity scales, with higher
(more intense) values radiating outward.
Fig. 3. Multiple correspondence analysis (MCA) of the analytical and olfactometry data obtained by the analysis of beer samples submitted to different storage
conditions (fresh beer (FB), naturally aged (6 months at 20 ± 2 ◦ C) and forced aged beers (14 days at 37 ± 1 ◦ C) showing (A) the two dimensional categories plot (A)
and (B) the two-dimensional observations plot.
7I.M. Ferreira et al. LWT 154 (2022) 112688
derivative of the initial unsaturated aldehyde, E-2-nonenal (Baert et al., Chemistry—LAQV [UID/QUI/50006/2020] and the project [UIDB/
2012). 05183/2020]. Inês M. Ferreira is recipient of a grant from FCT (PD/BD/
135091/2017). This work has also received funding from the European
4. Conclusion Union’s Horizon 2020 research and innovation program under the Marie
Skłodowska-Curie grant agreement No. 778045. This research was also
This work deals with the analysis of the chemical and sensorial anchored by the RESOLUTION LAB, an infrastructure at NOVA School of
profiles of beer samples submitted to different storage conditions (fresh Science and Technology.
beers, naturally aged beers (3 and 6 months at 20 ± 2 ◦ C) and forced
aged beers (7 and 14 days at 37 ± 1 ◦ C)). The chemical profile was Author statement
assessed by the extraction of volatile compounds by HS-SMPE, followed
by GC/MS detection. The sensorial profile was assessed by the extraction Inês M. Ferreira: Experimental part – sample preparation and
of volatile compounds using HS-SPME and the sensorial analysis was chromatographic analysis, data treatment and analysis, data curation,
conducted by an untrained sensory panel using GC-O/TOFMS technique. Writing-Original draft preparation.
Different chemical classes of compounds were identified and some of Flávia Freitas: GC/MS and GC/TOFMS analysis and systems
them are of utmost importance during beer staling. Beer aging comprises maintenance.
a large number of chemical reactions, which may occur at different rates Sara Pinheiro: GC-O-FID analysis and system maintenance.
depending on the storage conditions applied to beers. At the storage Maria Filipa Mourão: Statistical work design.
conditions studied in this work, significant differences were found, Luís Ferreira Guido: Conceptualization, Funding acquisition,
especially for the relative contents of aldehydes, esters and furanic Methodology, Supervision, Reviewing and Editing.
compounds in aged beers. Based on the HCA analysis, temperature of Marco Gomes da Silva: Conceptualization, Project administration;
storage is the principal factor that allow to distinguish among beers due Resources, Analytical Methodology, Supervision, Reviewing and
to its high dissimilarity concerning the overall chemical composition. Editing.
Usually, the industrial beers shelf-life is about 1 year. However, even the
rate of chemical reactions being low in beers stored at room temperature References
(20 ± 2 ◦ C), this study shows that the chemical composition after 6
months of storage is significantly different compared to fresh beers. In Alves, V., Gonçalves, J., Figueira, J. A., Ornelas, L. P., Branco, R. N., Câmara, J. S., et al.
(2020). Beer volatile fingerprinting at different brewing steps. Food Chemistry,
addition, HCA analysis has allowed us to conclude that the storage of 126856.
beer at low temperatures is the better way to preserve the freshness and Attchelouwa, C. K., N’guessan, F. K., Marcotte, S., Amoikon, T. L. S., Charmel, M., &
the organoleptic characteristics of fresh beers. Djè, M. K. (2020). Characterisation of volatile compounds associated to sensory
changes during the storage of traditional sorghum beer by HS-GC/FID and SPME-
Temperature was shown to be highly injurious with respect to the GC/MS. Journal of Agriculture and Food Research International, 2, 100088.
development of staling compounds, for beers stored at 37 ◦ C. The data Aubert, C., & Bourger, N. (2004). Investigation of volatiles in Charentais cantaloupe
obtained suggest a clear role of temperature on the development of melons (Cucumis melo var. cantalupensis). Characterization of aroma constituents in
some cultivars. Journal of Agricultural and Food Chemistry, 52(14), 4522–4528.
staling compounds, as confirmed by the increase on the amounts of al Babushok, V. I., Linstrom, P. J., & Zenkevich, I. G. J. (2011). Retention indices for
dehydes, furanic compounds and esters in analyzed beers. The depen frequently reported compounds of plant essential oils. Journal of Physical and
dence between the reaction rate constant and temperature was well Chemical Reference Data, 40(4), Article 043101.
Baert, J. J., De Clippeleer, J., Hughes, P. S., De Cooman, L., & Aerts, G. (2012). On the
described by the Arrhenius equation for these three chemical classes of
origin of free and bound staling aldehydes in beer. Journal of Agricultural and Food
compounds, for which the reaction rate increased with increasing tem Chemistry, 60(46), 11449–11472. https://doi.org/10.1021/jf303670z
peratures. The rate of development of furanic compounds showed to be Bianchi, F., Careri, M., Mangia, A., & Musci, M. (2007). Retention indices in the analysis
of food aroma volatile compounds in temperature-programmed gas chromatography:
almost 130 times higher in beers stored at higher temperatures (37 ±
Database creation and evaluation of precision and robustness. Journal of Separation
1 ◦ C) when compared to beers stored at 4 ± 1 ◦ C. The comparison be Science, 30(4), 563–572.
tween beers stored at 37 ± 1 ◦ C and 4 ± 1 ◦ C allowed us to verify that, in Branco, S., Mateus, E. P., Gomes da Silva, M. D. R., Mendes, D., Pereira, M. M. A.,
the first ones, the formation of aldehydes and esters was 70 and 15 times Schütz, S., et al. (2020). Identification of pheromone candidates for the eucalyptus
weevil, Gonipterus platensis (Coleoptera, Curculionidae). Journal of Applied
higher, respectively. The estimation of beer shelf-life allowed us to Entomology, 144(1–2), 41–53.
verify that higher storage temperatures are detrimental for beer shelf- Cabrita, M. J., Aires de Sousa, J., Gomes Da Silva, M. D. R., Rei, F., & Costa Freitas, A. M.
life and, in contrast, lower storage temperatures helps to extend beer (2012). Multivariate statistical approaches for wine classification based on low
molecular weight phenolic compounds. Australian Journal of Grape and Wine
shelf-life. According to the obtained results, furanic compounds and Research, 18(2), 138–146.
aldehydes showed to be good chemical markers of beer instability. Chevance, F., Guyot-Declerck, C., Dupont, J., & Collin, S. (2002). Investigation of the
Regarding these two indicators, beers stored at 37 ± 1 ◦ C for 12 days β-damascenone level in fresh and aged commercial beers. Journal of Agricultural and
Food Chemistry, 50(13), 3818–3821.
mimic the impact on beer stability of beers stored at 20 ± 2 ◦ C during 6 Costa, P. S., Santos, N. C., Cunha, P., Cotter, J., & Sousa, N. (2013). The use of multiple
months (beer best-before date). correspondence analysis to explore associations between categories of qualitative
Concerning the olfactometric analysis, different aromas were variables in healthy ageing. Journal of Aging Research, 2013, 12.
Delahunty, C. M., Eyres, G., & Dufour, J. P. (2006). Gas chromatography-olfactometry.
detected in the analyzed beers, such as fruity, floral, sweet, honey and
Journal of Separation Science, 29(14), 2107–2125.
paper-like aromas. The fruity and herbal aromas detected are related to Dennenlöhr, J., Thörner, S., Manowski, A., & Rettberg, N. (2020). Analysis of selected
the presence of esters and the floral-like aromas are related to the hop aroma compounds in commercial lager and craft beers using HS-SPME-GC-MS/
MS. Journal of the American Society of Brewing Chemists, 78(1), 16–31.
presence of esters and aldehydes. The major difference was found in
El-Sayed, A. M., Heppelthwaite, V. J., Manning, L. M., Gibb, A. R., & Suckling, D. J. J.
aged beers, both naturally and forced aged, where the prevalence of o. A. (2005). Volatile constituents of fermented sugar baits and their attraction to
sweet and papery aroma notes were noticed. The sweet aromas were lepidopteran species. Journal of Agricultural and Food Chemistry, 53(4), 953–958.
linked to the presence of β-damascenone in aged beers and. The papery Escudero, A., Campo, E., Fariña, L., Cacho, J., & Ferreira, V. (2007). Analytical
characterization of the aroma of five premium red wines. Insights into the role of
aroma notes were linked to the presence of E-2-nonenal. These two odor families and the concept of fruitiness of wines. Journal of Agricultural and Food
compounds, both detected only in aged beers, have been identified, by Chemistry, 55(11), 4501–4510.
several authors, as good chemical markers of beer aging. Ferreira, I. M., & Guido, L. (2018). Impact of wort amino acids on beer flavour: A review.
Fermentation, 4(2), 23. https://doi.org/10.3390/fermentation4020023
Giannetti, V., Mariani, M. B., Torrelli, P., & Marini, F. (2019). Flavour component
Funding analysis by HS-SPME/GC–MS and chemometric modeling to characterize Pilsner-
style Lager craft beers. Microchemical Journal, 149, 103991.
Gonçalves, L. M., Magalhães, P. J., Valente, I. M., Pacheco, J. G., Dostálek, P., Sýkora, D.,
This work was supported by National Funds through FCT—Foun et al. (2010). Analysis of aldehydes in beer by gas-diffusion microextraction:
dation for Science and Technology: Associate Laboratory for Green
8I.M. Ferreira et al. LWT 154 (2022) 112688
Characterization by high-performance liquid chromatography–diode-array Murakami, A. A., Goldstein, H., Navarro, A., Seabrooks, J. R., & Ryder, D. S. (2003).
detection–atmospheric pressure chemical ionization–mass spectrometry. Journal of Investigation of beer flavor by gas chromatography-olfactometry. Journal of the
Chromatography A, 1217(24), 3717–3722. American Society of Brewing Chemists, 61(1), 23–32.
Goodner, K. L., & Technology. (2008). Practical retention index models of OV-101, DB-1, Nakatani, K., Fukui, N., Nagami, K., & Nishigaki, M. (1991). Kinetic analysis of ester
DB-5, and DB-Wax for flavor and fragrance compounds. LWT-Food Science, 41(6), formation during beer fermentation. Journal of the American Society of Brewing
951–958. Chemists, 49(4), 152–157.
Guido, L. F., Curto, A., Boivin, P., Benismail, N., Gonçalves, C., & Barros, A. A. (2007). Pereira, C. B., Mendes, D., Dias, T., Garcia, R., da Silva, M. G., & Cabrita, M. J. (2021).
Predicting the organoleptic stability of beer from chemical data using multivariate Revealing the yeast modulation potential on amino acid composition and volatile
analysis. European Food Research and Technology, 226(1), 57–62. profile of Arinto white wines by a combined chromatographic-based approach.
ben Hammouda, I., Freitas, F., Ammar, S., Da Silva, M. D. R. G., & Bouaziz, M. (2017). Journal of Chromatography A, 1641, 461991.
Comparison and characterization of volatile compounds as markers of oils stability Plutowska, B., & Wardencki, W. (2008). Application of gas
during frying by HS–SPME-GC/MS and Chemometric analysis. Journal of chromatography–olfactometry (GC–O) in analysis and quality assessment of
Chromatography B, 1068, 322–334. alcoholic beverages–A review. Food Chemistry, 107(1), 449–463.
Kishimoto, T., Noba, S., Yako, N., Kobayashi, M., & Watanabe, T. (2018). Simulation of Ribeiro, L. H., Freitas, A. M. C., & da Silva, M. D. R. G. (2008). The use of headspace solid
Pilsner-type beer aroma using 76 odor-active compounds. Journal of Bioscience and phase microextraction for the characterization of volatile compounds in olive oil
Bioengineering, 126(3), 330–338. matrices. Talanta, 77(1), 110–117.
Kucharczyk, K., & Tuszyński, T. (2018). The effect of temperature on fermentation and Saison, D., De Schutter, D. P., Uyttenhove, B., Delvaux, F., & Delvaux, F. (2009).
beer volatiles at an industrial scale. Journal of the Institute of Brewing, 124(3), Contribution of staling compounds to the aged flavour of lager beer by studying their
230–235. flavour thresholds. Food Chemistry, 114(4), 1206–1215.
Lehnhardt, F., Gastl, M., & Becker, T. (2018). Forced into aging: Analytical prediction of Santos, C. V. A., da Silva, M. G., & Cabrita, M. J. (2020). Impact of SO2 and bentonite
the flavor-stability of lager beer. A review. Critical Reviews in Food Science and addition during fermentation on volatile profile of two varietal white wines.
Nutrition, 1–12. https://doi.org/10.1080/10408398.2018.1462761 Lebensmittel-Wissenschaft & Technologie, 133, 109893.
Li, Z., Dong, L., Jeon, J., Kwon, S. Y., Zhao, C., & Baek, H. H. (2019). Characterization Schieberle, P., & Komarek, D. (2003). Changes in key aroma compounds during natural beer
and evaluation of aroma quality in doubanjiang, a Chinese traditional fermented red aging Freshness and Shelf Life of Foods. ACS Publications.
pepper paste, using aroma extract dilution analysis and a sensory profile. Molecules, Soares da Costa, M., Goncalves, C., Ferreira, A., Ibsen, C., Guedes de Pinho, P., & Silva
24(17), 3107. Ferreira, A. C. (2004). Further insights into the role of methional and
Li, H., Liu, F., He, X., Cui, Y., & Hao, J. (2015). A study on kinetics of beer ageing and phenylacetaldehyde in lager beer flavor stability. Journal of Agricultural and Food
development of methods for predicting the time to detection of flavour changes in Chemistry, 52(26), 7911–7917.
beer. Journal of the Institute of Brewing, 121(1), 38–43. Steven, A. G. F. A. (2017). Beer. In H. Maarse (Ed.), Volatile compounds in foods and
Liu, S. Q. (2015). Impact of yeast and bacteria on beer appearance and flavour Brewing beverages (pp. 585–616). CRC Press.
Microbiology: Managing Microbes. Ensuring Quality and Valorising Waste. Vanderhaegen, B., Neven, H., Verachtert, H., & Derdelinckx, G. (2006). The chemistry of
Martins, N., Garcia, R., Mendes, D., Freitas, A. M. C., da Silva, M. G., & Cabrita, M. J. beer aging – a critical review. Food Chemistry, 95(3), 357–381. https://doi.org/
(2018). An ancient winemaking technology: Exploring the volatile composition of 10.1016/j.foodchem.2005.01.006
amphora wines. Lebensmittel-Wissenschaft & Technologie, 96, 288–295. Verstrepen, K. J., Derdelinckx, G., Dufour, J. P., Winderckx, J., Thevelein, J. M.,
Martins, N., Jiménez-Morillo, N. T., Freitas, F., Garcia, R., da Silva, M. G., & Pretorius, I. S., et al. (2003). Flavor-active esters: Adding fruitiness to beer - review.
Cabrita, M. J. (2020). Revisiting 3D van Krevelen diagrams as a tool for the Journal of Bioscience and Bioengineering, 96(2), 110–118.
visualization of volatile profile of varietal olive oils from Alentejo region, Portugal. Wang, W., Li, G., Ji, Z., Hu, N., & You, J. (2014). A novel method for trace aldehyde
Talanta, 207, 120276. determination in foodstuffs based on fluorescence labeling by HPLC with
Mateus, E. P., Barata, R. C., Zrostlíková, J., da Silva, M. D. R. G., & Paiva, M. R. (2010). fluorescence detection and mass spectrometric identification. Food Analytical
Characterization of the volatile fraction emitted by Pinus spp. by one-and two- Methods, 7(7), 1546–1556.
dimensional chromatographic techniques with mass spectrometric detection. Journal Welke, J. E., Manfroi, V., Zanus, M., Lazarotto, M., & Zini, C. A. (2012). Characterization
of Chromatography A, 1217(11), 1845–1855. of the volatile profile of Brazilian Merlot wines through comprehensive two
Miller, G. H. (2019). Appendix A - threshold data whisky science: A condensed distillation dimensional gas chromatography time-of-flight mass spectrometric detection.
(pp. 421–530). Springer. Journal of Chromatography A, 1226, 124–139.
9You can also read


