Liverpool City Region
Skills Investment Statement
           2020-21

      February 2020
←
→
Page content transcription
If your browser does not render page correctly, please read the page content below
Liverpool City Region
Skills Investment Statement
2020-21
February 2020
CONTENTS

Introduction and summary

Section A
Current Context

Section B
Adult Education Budget Devolutions review and priority actions for 2020-21

Section C
Careers Education, Information, Advice and Guidance

Section D
Other Key Thematic Policy Areas

Section E
Key Thematic Policy Area: The Future of Work and the impact on learning and
skills

Section F
Priority Actions for 2020/21

Appendices

Appendix 1. Review of Actions delivered in 2019/20
Appendix 2. National Careers Service current delivery sites
Appendix 3. Jobcentre Plus office locations
Appendix 4. Summary Sector Skills Priorities
Appendix 5. Liverpool City Region Education Funding

                                                                              2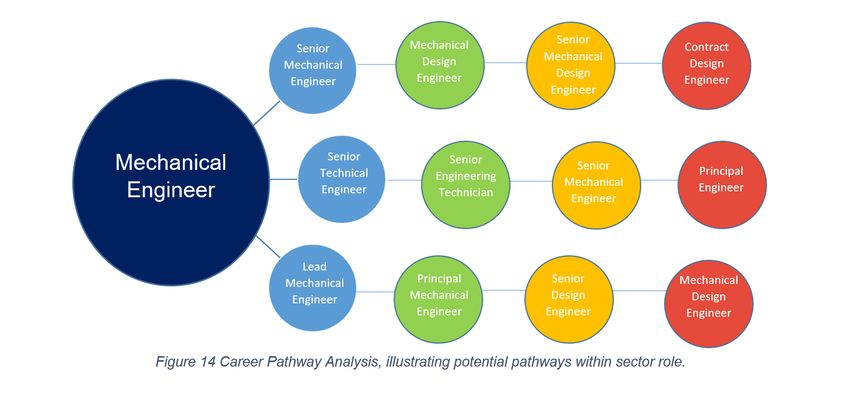
INTRODUCTION AND SUMMARY

                         LABOUR MARKET HEADLINE SUMMARY
                                   Table 1 – Key messages

Employment rates in the     •   Each year a growing number of our residents are employed,
Liverpool City Region           with significant growth in our employment rate from 2014
are improving                   onwards. As of 2018, 72% of our Working Age Population
                                were in employment, compared to 74% in the North West
                                and the UK rate of 75%.

                            •   Despite the progress made at narrowing the employment
                                gaps across particular groups of the population, gaps and
                                variations do exist, particularly for those with disabilities and
                                those from a black and minority ethnic background.
Unemployment is lower       •   Unemployment has fallen significantly from 6.2% in 2004, to
than the NW and the UK.         3.7% in 2019, lower than that of both the North West and the
                                UK.

                            •   Unemployment rates for particular groups (e.g. those with
                                disabilities, 16-24s) are still higher than the overall total
                                unemployment rate. These may be masking specific issues
                                with communities who are particularly affected by welfare
                                reform.
Health remains a            As a result of long-term sickness nearly a third of people do not
significant barrier to      participate in the labour force. This reflects the range of complex
work and a barrier to       health and wellbeing challenges residents face:
increasing overall          • One in four people of working age in the LCR have limiting
productivity                    health conditions;
                            • Life expectancy is two and a half years lower than for
                                England;
                            • The prevalence of ill health is increasing; and
                            • There is a high prevalence of mental health disorders.

Prevalence of low paid      •   Almost a quarter of jobs pay less than the real living wage,
work and the need for           and non-permanent forms of employment are less prevalent
better jobs                     than in other parts of the country.
                            •   Many people are trapped in a no pay, low pay cycle and are
                                unable to break out of this.

Education and Skills        •   The Skills Profile of the Working Age Population of the
attainment has improved         Liverpool City Region is improving. The proportion of highly
but the gap to national         skilled residents has increased whilst at the same time the
rates remains high              proportion of residents with no qualifications has fallen.

                            •   Liverpool City Region now lags the national rates for both
                                Key Stage 2 Numeracy (77% against 79%) and Key Stage 2
                                Literacy 72% against 73%);

                            •   More than 50% of Liverpool City Region pupils do not
                                achieve the expected standard at age 16

                            •   Significant resources are spent by 16+ providers in
                                addressing lack of English and maths qualifications, and a
                                significant amount of the devolved Adult Education Budget is
                                                                                                    3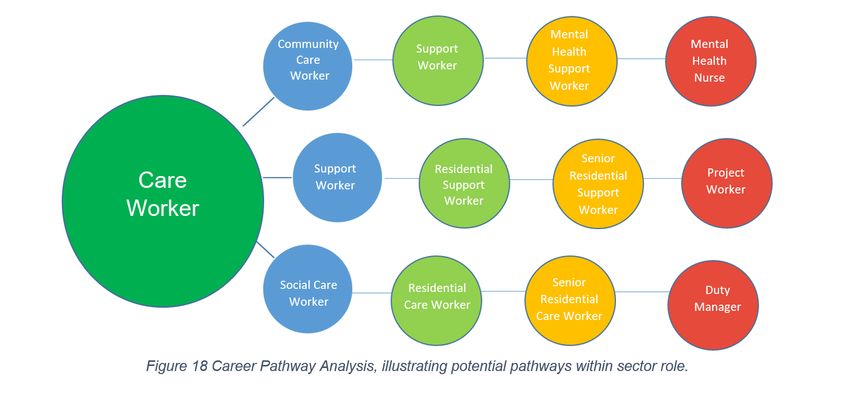
likely to be spent on English and maths entitlement
                               provision.

                           •   LCR has a relatively high proportion of young people who
                               are Not in Education, Employment which is driven in part by
                               low rates of attainment at all stages of the education system,
                               and all levels of apprenticeships.

Youth unemployment         •   Gaps in educational attainment at 16 and 17 are likely to
and levels of NEET is          contribute to youth unemployment.
still too high but
progress has been made

Skills shortage and gaps   •   Skills shortages are concentrated in mid-skill occupations,
in a variety of                while skills gaps are more concentrated in high skill
occupations                    occupations;

                           •   Nursing skills and wider health and social care workforce
                               development are key priorities not only for the sectors
                               themselves but also as part of functional labour market and
                               economy

                                                                                                4
SECTION A: CONTEXT
1. Population and demographics
1.1. Liverpool City Region Combined Authority is comprised of the Local Authorities of
Halton, Knowsley, Liverpool, Sefton, St Helens and Wirral. Established in 2014, it has a
£32bn economy, serving 1.5m people.
1.2. More than 1.5million people live within Liverpool City Region, of which 976,500 are of
working age (16-64 years). Currently there are 638,300 jobs and 78,200 self-employed
people.1
2. Employment, Unemployment, Inactivity and Transformational Growth
2.1. Liverpool City Region is a £32bn economy - measured by Gross Value Added (GVA).
2.2. A growing number of our residents are employed, with significant growth in our
employment rate from 2014 onwards. We have narrowed the employment gap between
ourselves and other areas.
2.3. The fast rate of growth has closed the gap considerably between the LCR employment
rate and that of the UK and other areas. As of late 2019, 72.9% of our Working Age
Population were in employment, compared to 74.3% in the North West and the national
rate of 75.9%. This is illustrated in figures 1 and 2 below.
Figure 1 Employment Rate Comparison 2004 - 19
1
LCR LIS Evidence Base 2019 and Annual Population Survey 2018
578.0
76.0
74.0
72.0
70.0
68.0
66.0
64.0
62.0
60.0
58.0
2004 2005 2006 2007 2008 2009 2010 2011 2012 2013 2014 2015 2016 2017 2018 2019
LCR England North West
78.0
76.0
74.0
72.0
70.0
68.0
66.0
64.0
62.0
2015 2016 2017 2018 2019
Greater Manchester CA Liverpool City Region England North West
Figure 2 - Employment rate comparison: LCR, GM, England and the North West.
2.4. However, it must be noted that evidence suggests that the share of 18- to 29-year-olds
working in lower-paying roles has expanded over the last decade, whilst the overall
number individuals employed on zero-hours contracts and with insecure work (known as
the gig economy), has increased adding to the lack of regular and secure employment.
More work will be undertaken locally to identify the scale of the issue as part of our work
on the Fair Employment Charter examining the position relating to unnecessary and /or
unsustainable business practices.
6Figure 3 - Unemployment Rate Comparison: LCR, NW, England
12.0
10.0
8.0
6.0
4.0
2.0
0.0
2005 2006 2007 2008 2009 2010 2011 2012 2013 2014 2015 2016 2017 2018 2019
LCR England North West
2.5. Unemployment has fallen significantly from 6.2% in 2004, to 4.1% in 2018 and as of late
2019; the unemployment rate in LCR was lower than that of both the North West and
England at 3.7%.
Inactivity
2.6. Health remains a significant barrier to work and a barrier to increasing overall
productivity and because of long-term sickness, nearly a third of people do not
participate in the labour force.
Figure 4 - Economic Inactivity Rates
30.0
29.0
28.0
27.0
26.0
25.0
24.0
23.0
22.0
21.0
20.0
2015 2016 2017 2018 2019
Greater Manchester Liverpool City Region West Midands England North West
72.7. Whilst some progress has been made to reduce the levels of inactivity and reduce the
gap between ourselves and other areas, the Liverpool City Region has a significant
number of people who are economically inactive due to long-term sickness.
Table 2 - Reasons for Economic Inactivity (Nomis September 2019)
Proportion of economic inactivity
Sickness related Non sickness related
Greater Manchester 28.1% 71.9%
Liverpool City Region 30.7% 60.3%
Sheffield City Region 27.7% 72.3%
Tees Valley 31.8% 68.2%
West Midlands 21.1% 78.9%
England 28.3% 71.7%
2.8. The economic inactivity rate reflects the range of complex health and wellbeing
challenges residents in the City Region face:
• One in four people of working age in the LCR have limiting health conditions;
• Life expectancy is two and a half years lower than for England;
• The prevalence of ill health is increasing; and
• There is a high prevalence of people with mental health issues.
Figure 2 Population Profile (2018 ONS NOMIS)
England
Liverpool
21.1
City
Region 25.6
Employed
4.2
Unemployed
3.5
Inactive
71.8
75.6
Narrowing the Gaps
2.9. Whilst there have been improvements in overall employment rates, variations exist
across particular groups of our population, as illustrated in Tables 3 and 4 below; work
8continues to narrow these gaps through our investment in skills and employment
support.
Liverpool England Gap 2019 Gap 2018 Gap 2017
City
Region
Overall 71.8% 76.4% 4.6% 5.5% 5.5%
Males 74.3% 80.6% 6.3% 5.7% 6.6%.
Females 69.3% 72.2% 2.9% 5.2% 4.4%
Black and minority 63.4% 66.1% 2.7% 5.4% 6.4%
ethnic people
People with a 49.5% 59.3% 9.8% 10.4% 10.8%
disability
Table 3 - Employment Rate Longitudinal Comparison (ONS NOMIS 2017 – 2019)
Table 4 - Unemployment Rate Longitudinal Comparison (ONS NOMIS 2017 – 2019)
Liverpool England Gap 2019 Gap 2018 Gap 2017
City
Region
Overall 3.4% 4.2% -0.8% 0.6% 0.1%
Males 3.8% 3.7% 0.1% 1.3% 0.8%
Females 3.1% 3.1% 0.0% -0.1% 0.6%
Black and minority 4.5% 6.9% -2.4% -0.1% 0.5%
ethnic people
People with a 6.6% 8.1% -1.5% -2.1% -2.0%
disability
2.10. There are increasing concerns about the quality and pay levels of job across the City
Region: around a quarter of jobs pay less than the real living wage and more are
assessed as being in precarious employment locally than nationally. This contributes to
people going through the low pay, no pay cycle, and being unable to progress in work,
something that is strongly encouraged within the Universal Credit benefit. Enabling
individual progression in work will benefit people and employers, whilst reducing the call
on public benefit support.
Skills Levels
2.11. The Skills Profile of the Working Age Population of the Liverpool City Region is
improving. The proportion of highly skilled residents has increased whilst at the same
time the proportion of residents with no qualifications has fallen. People with no formal
qualifications are less than half as likely to be in employment compared to graduates.
Over 4% of new recruits have no formal qualifications meaning that employment rates
are lower than average for this group.
2.12. However, the Liverpool City Region has a low proportion of highly skilled workers
qualified at and above NVQ Level 4 and equivalent but there remains significant skills
gaps at all levels, with progress earlier in life is the key to the progression into advanced
technical and higher level skills.
2.13. In order to match the national average2, the City Region would need:
• Another 27,063 residents with Level 1+ skills;
2
NOMIS, Official Labour Market Statistics, Office for National Statistics 2018
9• Another 21,275 residents with Level 2+ skills;
• Another 55,082 residents with Level 3+ skills; and
• Another 59,016 residents with Level 4+ skills.
Figure 6 NVQ Qualification Rate (ONS NOMIS 2019)
90.0
80.0
70.0
60.0
50.0
40.0
30.0
20.0
10.0
0.0
% with NVQ4+ - % with NVQ3+ - % with NVQ2+ - % with NVQ1+ - % with no
aged 16-64 aged 16-64 aged 16-64 aged 16-64 qualifications
(NVQ) - aged 16-
64
Liverpool City Region North West England
2.14. Significant resources are therefore inevitably spent by 16+ providers in addressing lack
of English and maths qualifications, and a significant amount of the devolved Adult
Education Budget is likely to be spent on English and maths entitlement provision with
learner funding entitlements in digital to follow in 2020/21
2.15. The proportion of jobs requiring a degree level qualification has increased in the City
Region, along with the supply of those skills: however this is still lower than other parts
of the country. The current levels of graduate retention in the City Region (as defined as
graduates who stay in the area after graduating) is relatively high compared to other
areas:
Table 4 - Proportion of graduates in stay in the area they study in after graduating
Area Proportion
South West Scotland 73%
Greater Manchester 50%
West Yorkshire 44%
Liverpool City Region 41%
Tees Valley 32%
South Yorkshire 31%
This is thought to be due to the higher proportion of students from the area who study at
local Universities then decide to stay after graduating.
2.16. There is consistent feedback from students that they would like to stay in the City
Region after graduating but are unable to find sufficient graduate level jobs. There is
European funding being invested to support this, and there are national programmes
(e.g. Knowledge Transfer Partnerships) which could be enhanced to deliver more
graduate level roles. In addition, support needs to be provided to businesses to enable
them to create those opportunities.
10Attainment in schools
2.17. Across Liverpool City Region, attainment at age 11 is significantly lower in reading than
in Grammar, Punctuation and Spelling (GPS) or Mathematics. The lowest attainment in
reading occurred in Wirral with 69% which is 4% lower than the national average
attainment in reading. The highest average attainment in reading was in Knowsley,
which was at 75%, a 2% higher attainment compared to reading at a national level.
Halton and Wirral also had the lowest average mathematics attainment at 75% which is
4% lower than the national average attainment at 79%. Halton also has the lowest
average GPS attainment at 74% which is 4% lower than the national average in that
category.
Figure 6 - Average KS2 attainment in the Liverpool City Region in 2019
Key Stage 2 Attainment in the LCR (%)
80
78
76
74
72
70
68
66
64
Knowsley Liverpool St Helens Sefton Wirral Halton National
Reading GPS Maths
Source: DfE data set for KS2 attainment in local authorities 2019
112.18. On average, the average level of attainment since 2016 has been lower than the
national average. However, prior to 2016, the average attainment in LCR was
consistently equal to or higher than the national average level of attainment. The
changes to assessment have seen a disproportionate negative impact in the City Region
compared to nationally. Ensuring that as many young people as possible have the
required literacy and numeracy skills before entering secondary school is therefore seen
an a necessary place for focus and potential improvement.
2.19. This performance is accentuated at secondary schools. Lower outcomes secured by
young people during secondary education act as a significant inhibitor to progress to
employment and skills opportunities- including apprenticeships, as illustrated below in
Figure 7:
Figure 7 Percentage of pupils who achieved grade 9-5 in English & Maths GCSE
50%
45%
40%
35%
30%
25%
20%
15%
10%
5%
0%
Halton Knowsley Liverpool Sefton St. Helens Wirral
2.20. This lower level of attainment then follows through into higher levels of not in education,
employment or training:
Table 5 - Average of Dec 2018, Jan 2019, Feb 2019 NEETs
Local Authority No. of 16 & 17 Total No. Proportion of
year olds of NEET NEET
North West 153,090 9,670 6.3%
Halton 2,910 150 5.1%
Knowsley 3,370 260 7.7%
Liverpool 9,480 1,010 10.7%
Sefton 5,540 210 3.8%
St Helens 3,810 230 6.0%
Wirral 6,940 340 4.9%
Liverpool City 28,620 2200 7.7%
Region
12Whilst Councils who have the statutory duty around 16-19 year olds have reduced the
NEET level in recent years, it still remains higher than regional and national rates. This
risks a scarring effect in young people in them not being able to develop skills or
experience, which can have a long lasting impact.
Employer responsiveness
2.21. Growth Sectors, and in particular those sectors and sub-sectors where the City Region
has, or can secure, a strong competitive advantage continues to be of importance within
the emerging economic approach. Increasingly, place-based regeneration and the
importance of clusters and the local business and business support eco systems are
recognised as important components of regeneration, business growth and business
resilience.
2.22. The City Region continues to have significant strengths and huge potential in innovative
and globally competitive sectors: Advanced Manufacturing, Digital and Creative,
Financial and Professional Services, Health and Life Sciences, Low Carbon Energy,
Maritime and Logistics, and the Visitor Economy.
2.23. The emerging Local Industrial Strategy, and accompanying evidence base, highlights
that across the City Region we have developed and continue to develop core strengths
across a number of sectors that provide significant transformational growth
opportunities- in terms of both jobs and Gross Value Added (GVA).
2.24. Sector accelerators have been identified and which are sub-sectors of the economy that
have strong growth potential, unique and nationally significant assets and strong
potential to form innovation-led growth clusters across the City Region.
2.25. The transformational areas that have been identified to drive opportunity are:-
Automotive manufacturing
Across the sector there are approximately 55 businesses employing more than
7,000 people;
Since 2010, the sector has grown considerably faster than the UK;
There is a high concentration of employment and output compared to the UK albeit a
lower concentration of businesses; and
The sector comprises a high number of large, key employers in the sector.
Chemicals and Pharmaceuticals manufacturing
Liverpool City Region is home to some of the world‟s biggest pharmaceutical
players;
In 2017 the sector contributed in excess of £1.5bn of GVA;
There are over 130 businesses operating in the sector and employing more than
7,500 employees; and
There is a considerably high concentration of employment, businesses and output
compared to the UK, demonstrating the City Region‟s sector specialism and
expertise.
Life Sciences and Healthcare
13 Our Universities produce world leading research related to Life Sciences and
Healthcare Sector
In 2017, the sector contributed more than £3bn of GVA and provided c.95,000 jobs,
across a business base of more than 2,000
Since 2010, the sector has grown – albeit at a slighter rate than seen nationally
The Liverpool City Region‟s specialism is demonstrated through a higher
concentration of employment, businesses and output than that seen nationally
Digital and Creative
The Digital and Creative Sector in the Liverpool City Region is growing, with a
constant stream of new businesses starting, locating and growing in the Liverpool
City Region;
The Liverpool City Region also has a strong, and growing advanced computer sector
and underpinned by nationally significant assets;
The sector is growing significantly- faster than the national rate
There are 2,500 businesses in the sector- providing close to 13,000 jobs
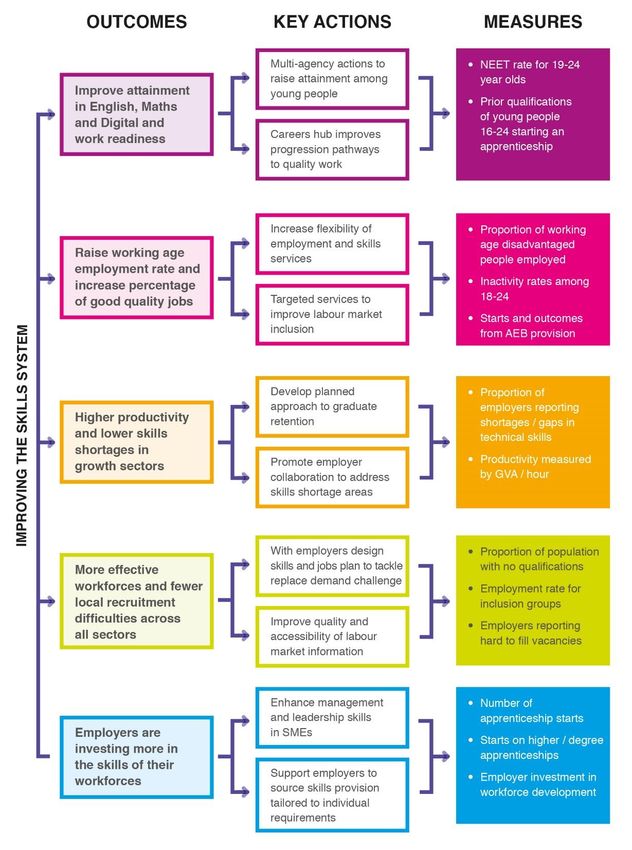
2.26. The City Region has consulted with employers to develop and publish a series of sector
and thematic based Skills for Growth Action Plans, which are summarised in Appendix
Four. These clearly set out the current and future needs of employers and provide skills
providers with the detailed information they require to respond. The Action Plans have
been embedded within commissioning approaches and are being delivered, ensuring
that opportunities can be captured and seized locally. The underlying premise however
is sound, and the Combined Authority wishes to see a higher proportion of funding being
directed by employers to meet their skills need.
2.27. It is acknowledged and recognised that skills provision can sometimes not be sufficiently
flexible or responsive to meet the needs of employers. This can lead to frustrations from
employers and act as a brake to improvements in productivity. The charge that is
sometimes laid on employers by skills providers is that they are unable to clearly or
consistently articulate their needs. Supporting employers to do so on an aggregated
basis is therefore something that needs to be accelerated.
Liverpool City Region Science Industry Partnership
The Combined Authority and Cogent (Sector Skills Council for Science) are working to
help employers in the science sector to more clearly and consistently articulate their
skills and see them met through the aggregation of demand. SIP Liverpool City Region
brings together the science-based sector to focus on skills in the region and support
local companies to develop and sustain the appropriate skills they need to innovate and
grow, through partnership. Sectors embraced include chemicals, pharmaceuticals,
medical technology, biotechnology, advanced materials and downstream oil and gas.
The group will drive a local approach to sharing best practice, addressing skills
challenges, growing the skills pipeline and developing specialist STEM training
provision.
14SECTION B:
ADULT EDUCATION BUDGET DEVOLUTION
1.1. Devolution of the Adult Education Budget (AEB) forms an integral part of the Liverpool
City Region‟s Devolution Agreement of November 2015. As a result, the Liverpool City
Region Combined Authority became responsible for the commissioning and delivery of
all AEB funded programmes for Liverpool City Region residents from 1 st August 2019.
The LCR devolved budget equates to 3.99% of the national AEB budget and for the
2019/20 academic year, this equates to £51.3m.
1.2. The AEB is a single revenue stream bringing together adult further education (all 19+
provision with the exception of apprenticeships and traineeships), community learning
and discretionary learner support. The principle purpose is to engage adults and provide
them with the skills and learning they need for work or further learning. It enables more
flexible tailored programmes of learning to be made available, which may or may not
require a qualification, to help eligible learners engage in learning, build confidence
and/or enhance their wellbeing.
1.3. The AEB also includes a guarantee to provide full funding for certain learners to support
the following statutory entitlements:
English and maths, up to and including level 2, for individuals aged 19 and over, who
have not previously attained a GCSE grade A* to C or grade 4, or higher, and/or
First full qualification at level 2 for individuals aged 19 to 23, and/or
First full qualification at level 3 for individuals aged 19 to 23.
The Government has additionally announced that an entitlement to free basic digital
skills will begin from the 2020-21 academic year.
1.4. The Liverpool City Region has a number of long-standing skills challenges that AEB
provision can help to address; however, currently over half of AEB funding supports the
delivery of national entitlements with 72% of programmes undertaken below Level 2.
This is a result of current and historic low levels of school leaver qualifications.
Therefore, whilst local devolution offers significant opportunity to ensure the education
and training offers better meets local employer and learner needs through targeted
investment, we have had to balance our ambitions for innovation with the need to ensure
stability in the first transitional year of devolution.
1.5. The Combined Authority has undertaken a dual approach to commissioning for 2019/20
– grant negotiations for LCR based FE Colleges and Local Authorities and external
procurement to secure additional contracts for services. As a result, from 1st August
2019, 33 organisations have an agreement in place to deliver AEB programmes to LCR
residents.
2. Key Actions delivered in 2019/20
2.1 The Combined Authority is keen to take advantage of and maximise the opportunities
afforded by devolution. As such, we have introduced a range of local flexibilities,
designed to ensure funding is better aligned to local need. In particular:
15 Supporting more residents in low wage sectors – fully funding learners who are
employed and would normally be co-funded where they earn less than the Real
Living Wage (£17,550/yr.), enabling a greater proportion of learners to access fully
funded provision in order to progress or transition their careers.
Increasing innovation and responsive delivery – providing additional funding
for Test & Learn Pilots– to help providers develop flexible delivery methodologies
aligned to key skills priority areas (ESOL, Maths & English and Digital Skills) to
inform future investment
Incentivising delivery to help more learners progress to employment –
providing additional payments for work experience and job outcomes delivered
through Sector Based Work Academies, to test the extent to which an outcome
payment model improves the engagement, impact and progression of learners to
employment
Improving efficiency with fewer providers collaborating more – we have
moved from 220+ providers to 33, with a clear emphasis on local and sector-based
collaboration.
Maximising the funding directed to front-line delivery – capping the amount
prime contractors are able to charge subcontractors at 20%
Capacity building the AEB System – to accelerate the impact of devolution,
supporting providers to better respond to local need, including a City Region wide
mental health first aid programme, and aligning investments from other funding
streams
2.2 Transitional funding measures are in place to protect against any potential impacts that
the first year of devolution may bring to the provider base and respond to identified need
for further in-year investment. Additionally, a capacity-building strand was provided to
accelerate the impact of devolution, enhance the local evidence base and improve the
responsiveness of delivery organisations. To date this has supported provider staff
Continuing Professional Development around mental health first aid in line with common
thematic development priorities delivered across other programmes such as Households
into Work.
3. Focus for 2020/21
3.1. It is essential that the Adult Education Budget is positioned as a cornerstone of our
education continuum offer that promotes and facilitates progression, upskilling, re-
skilling and „second chance‟ opportunities. Through AEB devolution we want to use the
ongoing development of our evidence base to ensure that those for whom the learning
will have the greatest impact are able to access learning- at the right level and delivered
in the most appropriate and effective way and location. This must have a strong
element of responsiveness to employers‟ needs, and over time, the proportion of funding
driven by employers will increase as the proportion spent on statutory entitlements
reduces.
3.2. Through the devolved Adult Education Budget, the Combined Authority- working with the
provider base and partners -will continue to secure provision that enables individuals to
participate and progress, including addressing the priority around the narrowing of the
gap of under-represented learners in learning and work. Through our Commissioning
Strategy we will:
Safeguard adult and community learning provision for City Region residents;
Ensure access to provision from across the City Region, prioritising specific groups
and communities through engagement and innovation;
16 Monitor delivery (subject to data reporting periods) against core equality and
diversity impact measures for:
o Black and minority ethnic learners;
o Learners with learning difficulties and/or disabilities; and
o Underrepresented learners by gender in priority sectors and high volume
employment sectors.
3.3. We will continue to work in partnership with the National Retraining Scheme, as an
early adopter of NRS, to support employers and sectors at risk of job change through
automation. We will support LCR residents to retrain as part of our approach to
upskilling and re-skilling for longer working lives. Locally, the proportion of those aged
over 50 and who are economically active is 39.1%. Whilst this is lower than the
national figure of 43.1% our work to address inactivity rates has the potential to engage
more people in learning and to acquire new skills funded through AEB.
3.4. We will also work with other Government Departments to align our offer to respond to
economic shock, enabling those who have been made redundant to retrain and re-
engage with the labour market.
4. Key Actions for consideration: 2020/21
4.1 The Combined Authority are using 2019/20 to gather both qualitative and quantitative
evidence to understand what works well to inform future prioritisation of AEB funding to
ensure AEB is targeted at those most in need.
Place Based Investment
4.2 Ongoing work with those delivering Adult and Community Learning provision (including
Councils) to ensure that those most in need of skills development are supported to
access relevant learning opportunities extending the place based approach to
investment and safeguarding the overall ACL budget.
Employer responsive
4.3 Whilst AEB is focused on the needs of the individual, it is important that we ensure the
local curriculum and training offer reflects the opportunities within the local economy and
meets the current and future needs of employers.
4.4 We will continue the test and learn approach, embedding any lessons learned from the
2019/20 Pilots to maximise the impact for pre-employability programmes. We will be
bold and innovative exploring how the model could support flexible learning in key
sectors such as construction, digital and low carbon, to remove any barriers to
progression to the technical skills our local economy and industrial strategy needs.
4.5 We will extend our investment in Digital Skills through both the national Digital
Entitlement and a locally developed package of support, for those who require a higher
level of digital skills for the workforce, such as coding, web development and social
media communications.
4.6 We will continue to provide funding for entitlement delivery in the workplace and look to
engage with intermediaries including TUC, Union Learn Reps and The Growth Platform
to promote the opportunities afforded by AEB devolution in addressing employer skills
needs. In tandem, we will work with our provider base to ensure the curriculum offer
supports progression to Level 3 and increase the proportion of our AEB funding invested
in Level 3 learning.
17Capacity building
4.7 Developing additional CPD options to support the ongoing development of the provider
base to better meet the learning needs of learners and employers.
18SECTION C
CAREERS EDUCATION, INFORMATION, ADVICE
AND GUIDANCE
1. Introduction
1.1. Given that the nature of work is changing at an increasingly rapid pace and that people
are employed in job roles that will change radically or disappear altogether, the need for
individuals to access Careers information and up-to-date information about the labour
market becomes ever more critical. Additionally, millions of new job roles will be created
requiring new skills and ways of working making it more critical to open up access to
information that better supports individuals to secure and retain meaningful work.
1.2. As Figure 8 illustrates there is a complex and often-confusing plethora of organisations
delivering careers guidance services of one sort or another. Agencies can often
commission additional activity without understanding what is on the ground locally.
Therefore, the involvement of the Combined Authority leading the Strategic Careers Hub
and working with our national, region and local partners is helping to minimise the risk of
this happening.
Figure 8 – Schematic of organisations involved in careers activity in Liverpool City
Region
1.3. As outlined in the Devolution Agreement, a key priority for the Liverpool City Region is to
secure greater cohesion and better alignment with growth opportunities to careers
education and advisory services. To address the City Region‟s overarching Careers
Strategic Objective, a City Region Careers Hub was established in July 2017. The
purpose and priority actions of the Hub (which meets quarterly) includes:
To lead the strategic coordination of Careers services locally- addressing local
priorities (such as those outlined in the Skills Strategy);
19 To lead and/ or co-ordinate key priority actions (such as the investment in the
production of careers materials and progression pathways) and using our networks
to roll out and share these resources with stakeholders;
Cohere delivery to ensure that this is effective, targeted and adding value- especially
by working more closely with organisations such as: Careers and Enterprise
Company, National Careers Service, Colleges, Universities and Jobcentre Plus and
Shaping Futures;
Develop and facilitate access to up to date local labour market information (which
also informs the careers materials)
1.4. It remains a priority for the Combined Authority to cohere delivery to ensure that this is
effective, targeted and adding value and to ensure that Advisors and organisations have
access to up to date local labour market information and this needs to be used
consistently by all organisations. Investing in production of careers materials and
progression pathways and using networks to roll out to stakeholders will continue to be a
key driver for improvement, and to this end we have delivered a number of key actions
in 2019/20.
12 sector specific careers booklets and a summary document have been developed
and produced incorporating digital content;
We have developed and produced careers in box materials - a suite of resources
designed to support individuals, school careers leaders, careers guidance
practitioners and adult learning tutors gain better access to resources that support
Careers Education and supplemented by digital content;
Working with the NCS, a detailed curriculum resource has been developed in
partnership with the Schools Careers Hub. This, together with the leaflets and future
content, will be launched as „Careers in a Box‟. Materials can be used and adapted
in a number of age group settings;
Working with the Department for Education and the National Careers Service Prime
contract holder, the Combined Authority is supporting the testing of an element of
the National Retraining Scheme. The initial rollout in the Liverpool City Region, with
the launch of a new digital service, is branded „Get Help to Retrain‟.
2. Key Actions for 2020/21
Launch of the Careers in a Box Careers support materials working jointly with the
School Careers Hub and Councils, and as part of a wider approach to engaging
employers, schools, Colleges, Adult and Community Learning Providers to improve
the dissemination of Careers information;
Launch of LCR Combined Authority Careers Website area, including digital versions
of the Careers Materials with embedded additional content; sector videos and
partner links and updates;
Develop BE More apprenticeship portal to include CEIAG resources and ensure
appropriate interface with the Apprenticeship Hub activity and website content;
Further development and trialling of iCan career management toolkit;
Development of sector specific solutions to aid recruitment and retention- such as
skills shows; and
Roll out of further work on progression pathways and Critical Career Path analysis
using data analytics tools such as Horsefly.
20Sample Case Study
Liverpool City Region Jobs & Skills in Demand
Although having a solid foundation of certified skills and qualifications is important for those
seeking employment, and for employers when they are recruiting, these are not in themselves
sufficient. Employers look for other qualities, capabilities and personal characteristics in
individuals when recruiting. The table below is an example mix of the top skills, capabilities,
competencies and personal characteristics sought by recruiting employers based in the
Liverpool City Region.
Table 6 - Three Year Labour Market Analysis Liverpool City Region Skills
(LCRCA Digital Skills For Growth Plan)
Communication Management Clients Sales Customer Service
Assertiveness Reporting Solutions Policy Engineering
Consulting Maintenance Planning Excel Data
Administration Healthcare Retail Finance Detail
There have continued to be continual changes to job roles and skills required by employers in
recent years, making it difficult to be clear about what the latest requirements are. The
Combined Authority has acquired a data analytics tool that we are now starting to use to
enhance our understanding of the way that the labour market operates, and the type of
information that we can analyse includes:
Numbers of people with specific job roles or declared skills within an area, and compared to
other areas;
Indications of increasing skills shortage (whereby there are fewer applicants per job);
Gender pay gaps at specific job roles;
Improved links between Universities;
Transferable skills between job roles; and
An analysis of the job roles in highest demand, whereby there is the lowest ratio of
applicants per role.
In the final pages of this section we have chosen two spotlight areas (Mechanical Engineer and
Care Worker) to illustrate the potential areas of analysis and its potential utility. These are very
much early drafts of what can be produced and feedback from Councils, practitioners and
broader stakeholders will be welcomed in developing further information.
Table 7 – Roles demand in the Liverpool City Region Source: Examine a Place, DWP (Alpha
Testing Stage)
Roles with the highest Typical Salary Roles with the Typical Salary
employer demand: largest growth in
employer demand:
1. General Nurse £28,000 to 1. General Nurse £28,000
£34,000
2. Social Care Worker £21,000 to 2. Assistant £16,000 to
£24,000 £24,000
3. Lorry Driver £31,000 to 3. GP £80,000 to
£36,000 £85,000
4. Warehouse Worker £19,000 4. Coordinator £18,000 to
£23,000
5. Customer Service Adviser £18,000 to 5. Administrator £17,000 to
£20,000 £29,000
21Table 8 - Top 10 Mechanical Engineer Vacancies Advertised in LCR (Analysis of Job Search Sites
(Indeed, Monster, CV Library) Liverpool 20 Miles+ October 2019)
Role Recruiter/Employer Salary
Assistant Mechanical Engineer Bennet & Game Recruitment £21,500
Principal Mechanical Engineer Viridor Jobs £47,000
Senior Mechanical Engineer Team Leader Entech £38,500
Mechanical Project Engineer CH2M Hill £40,615
Mechanical Project Engineer PRS £37,500
Mechanical Project Engineer Mech Electrics £44,000
Mechanical Engineer Teva Runcorn £37,399
Design Engineer Riverside Housing £36,022
Lead Engineer United Utilities £45,326
Site Services Mechanical Engineer Unilever £30,763
Table 9 - Top 10 Care Worker Vacancies Advertised in LCR (Analysis of Job Search Sites (Indeed,
Monster, CV Library) Liverpool 20 Miles+ October 2019)
Role Recruiter/Employer Salary
Community Care Worker Carewatch “Competitive”
Community Care Worker Holistic Care Services National Living Wage
Support Care Worker Home Instead £17,068
Care Worker Grace Community Care £8.50 P/H
Care Worker Warrencare £17,068
Care Worker Mears Group £17,068
Care Worker Assured Care Southport £8.88 P/H
Night Carer Private Household National Living Wage
Care Worker (Part-Time) Partnerships in Care £14,140
Senior Extra Care Worker Creative Support Social Care £16,844
Services
22Spotlight: Mechanical Engineers in Liverpool City Region
Total
Candidates
Mechanical Average
Engineer Candidates
Per Role
Average
Live
Adverts
Maintenance Operations
Training Production
Higher Education Institutes (HEIs) Attended
Design Inspections Knowsley Community College
Lancaster University
Safety Conveying
Loughborough University
University of Central Lancashire
Keyword
Liverpool Community College
Skills
Sheffield Hallam University
Autocad The Manchester Metropolitain College
Welding St Helens College
Fault Finding
Security University of Liverpool
Budgeting Sourcing Liverpool John Moores
Project Engineering 0% 5% 10% 15% 20% 25% 30% 35%
Management
23Spotlight: Care Workers in Liverpool City Region
Figure 3 Horsefly Data Analytics Sample of 2799 Roles Identifying as 'Care Worker' September 2019
Total
Candidates
Care Average
Candidates
Worker Per Role
Average
Live
Adverts
Customer
Healthcare
Service
Cash Handling Higher Education Institutes (HEIs) Attended
Training
Cooking The University of Manchester
Mental Health
Glyndwr University
University of Salford
Keyword
West Cheshire College
Skills
The Manchester Metropolitan…
University of Central Lancashire
Risk Reviews Liverpool Hope University
Teaching
Budgeting Edge Hill University
Planning University of Chester
Greeting University of Liverpool
Childcare Liverpool John Moores University
Personal Care
0% 5% 10% 15% 20% 25% 30% 35%
24SECTION D:
OTHER KEY THEMATIC POLICY AREAS
1. Apprenticeships
1.1 Apprenticeships have a long and positive track record in Liverpool City Region. They
have a strong brand and support from communities and employers alike, and have
contributed significantly in giving many people the first step on the work ladder. We
know their power as a tool of social mobility and inclusion, contributing towards a more
diverse workforce for employers, and that they contribute to worker retention. When we
launched our 2018-2020 Apprenticeship Growth Strategy we set an aspiration to deliver
20,000 apprenticeships per annum and to support the public sector to deliver against its
2.3% target. Given that apprenticeship delivery in 2016/17 was 18,500, and that the
anticipated reforms were expected to stimulate further growth, this target seemed
appropriately aspirational.
1.2. Whilst there have been some improvements in terms of the breadth and quality of
apprenticeships, and in particular through the offer of new apprenticeship standards,
there have been a number of unintended consequences of the apprenticeship reforms
that have resulted in fewer starts than anticipated. An example of this was the
Government‟s planning assumption that there would be a significant apprenticeship levy
underspend and that the underspend would be reallocated for non-levy funded
provision; the reality is that the levy draw down nationally has been greater than
anticipated limiting the available funds for non levy provision. The longer lead-in time of
some of the standards development as well as changes in the funding bands has also
contributed to lower apprenticeship take-up.
1.3 The Government introduced the series of reforms to apprenticeships in 2017 including:
requiring all large employers to pay an apprentice levy, which could then be used for
apprentice training; strengthening the requirement for apprentices to spend 20% of their
time in off the job training; lowering the employer contribution for non-levy firms; and
moving from qualification frameworks to sector determined standards. This year,
Government also reduced the amount of funding available to providers for non-levied
employers.
1.3 The introduction of these reforms has seen apprenticeship starts fall in the City Region
as shown in the tables below. The proportion of 16-18 year olds starts apprenticeships
has fallen locally, although the national fall is larger. There has been a shift from Level 2
apprenticeships to Higher and Degree Apprenticeships at Level 4+, with Level 3 now
being the largest group of apprenticeships being undertaken locally:
Table 10 – Apprenticeships Starts by age
LCR Apprenticeship Starts - All Level
2016/17 2017/18 2018/19
Age
Starts % Starts % Starts %
16-18 3,720 20% 3,240 26% 2,730 22%
19-24 4,940 27% 3,250 27% 3,270 27%
25+ 10,000 54% 5,750 47% 6,200 51%
Total 18,630 12,240 12,200
25Table 11 – Apprenticeships Starts by level
LCR Apprenticeship Starts - All Age
2016/17 2017/18 2018/19
Level
Starts % Starts % Starts %
L2 9,540 51% 5,300 43% 4,560 37%
L3 7,460 40% 5,210 43% 5,370 44%
L4+ 1,630 9% 1,730 14% 2,270 19%
Total 18,630 12,240 12,200
Given the impact of these reforms, it appears unlikely that the aspirational target of
20,000 apprenticeships starts by 2020 will be achieved.
1.4 There are willing employers, training providers and apprentices ready to start
apprenticeships, but no funding to do so. This is because demand for apprenticeships
from non-levied firms outstrips the available funds. There is consistent feedback from
colleges and independent training providers that this is acting as a brake on potentially
1,000 apprenticeship starts locally. Some have already spent their allocation for
2019/2020 and may have to begin turning students away. The Combined Authority has
been mitigating the full impact of this through helping companies to transfer
uncommitted levy funding, with over £400,000 funding transferred to date, supporting
the training of 104 apprentices. It is noted that this is not a straightforward process, and
options to simplify this should be considered.
1.5 Our skilled workers are getting more skilled but our residents with no or low level
qualifications are left further behind.
Many firms are choosing to invest in existing skilled staff rather than train lower
skilled workers or new recruits. This is in the financial interests of each firm, but the
collective impact on the City Region is to further constrain the number of people with
level 2 and 3 qualifications. The share of apprenticeships in the City Region at Level
4 and above has risen from 9% in 2016/17 to 14% in 2017/18 to 19% in Q3 of
2018/19, whereas qualifications at Level 2 have fallen from 51% 2016/17 to 37% in
2018/19.
Feedback from employers suggests that firms are using apprenticeship funding to
substitute for previously planned workforce development and non-levy firms are
investing in higher level, often University provided, qualifications for existing staff
that are now much more affordable. Many qualification standards have been
developed at higher levels to support this.
1.6 Some of our foundational sectors who struggle to recruit aren‟t able to offer
apprenticeships. Firms with small margins, fixed value public sector contracts, and a
high proportion of labour costs cannot afford to pay 100% of salaries for 80% labour
(due to the requirement for 20% off the job training time) so are offering fewer
apprenticeships than previously. This is contributing to wide spread challenges filling
roles in social care.
1.7 Some of our high productivity and emerging sectors are unable to offer apprenticeships.
Firms with structurally high staff turnover due to contract lengths – such as construction,
engineering, and the creative industries – continue to struggle to offer more
apprenticeships because they cannot commit to the length of course required.
1.8 The majority of apprenticeship starts in 2017/18 were in business, administration and
law or health, public services and care. These sectors are more common in LCR (59%
of all apprenticeships) compared to the national average (54%). On the other hand,
26there were relatively few apprenticeship starts in construction (800, or 7%), engineering
and manufacturing (1,550, or 13%) and ICT (250, or 2%). Construction, engineering
and creative industries are projected to grow in importance for the LCR economy over
the next two decades, both in terms of employment and GVA.
1.9 The cumulative effect of these four factors is a 35% reduction in the number of
apprentice starts from 2016/17 to 2017/18 with a further reduction expected this year.
This is compared with a 24% fall nationally in the same period.
1.10 The Combined Authority is well aware of the issues being faced and is on with the
following actions:
Maximising the impact of Be More, the apprentice application portal, and extending
this to cover training courses as well;
Investing £4m in a Skills and Apprenticeship brokerage service to help facilitate
transfers of funding from levy payers to non-levy payers, and to support firms to
identify the right courses and providers to suit their current and future staff needs.
Since Spring 2019, over £0.500m has been transferred to support 104 apprentice
starts and we aim to double that by the end of the year;
Supporting the creation of standards in key sectors of the LCRCA: we have provided
£2m funding for the creation of Maritime Standards and are looking at opportunities
to support social care standards; and
Embedding the creation of apprenticeships within our social value and community
wealth building approach.
1.11 The implementation of these actions will mitigate the impact of the introduction of the
reforms, but the system needs to be changed to better reflect the needs of employers
and learners locally. Discussions are continuing with Government to ensure that any
potential changes to apprenticeship funding will help to address the position locally, and
there will be a full engagement with the review of apprenticeship funding announced by
the Prime Minister.
1.12 In addition, Councils have been working with the Combined Authority to collaborate on
driving up the number of apprentice starts. This has included joint procurement,
development of cohorts of learners and sharing effective practice. This has had a
beneficial impact, with the number of starts almost doubling in 12 months. This joint
work will be continued through the Skills and Apprenticeship Hub and widened to
include other public sector organisations.
2. Technical Education
2.1 The Government is undertaking major reforms to the technical education system in
England. These proposed reforms were first set out in the Post-16 Skills Plan, and the
legislative framework for them was provided by the Technical and Further Education Act
2017. Underpinning these reforms is the belief that more higher level skills will be
needed in the future, with employers increasingly requiring employees qualified at level
4 and above, with a commensurate decrease for the demand for low and intermediate
skills
2.2 Under the reforms, a new technical education option will be created to sit alongside the
academic option (e.g. A Levels/ degree) and will comprise 15 routes based around
occupations with shared training requirements. Some of these routes will be further sub-
divided, with closely-related occupations grouped together into pathways.
2.3 The first 3 T Levels will be available at selected colleges and schools (providers) across
England in September 2020. Pupils who entered Year 10 in September 2018 will be the
27first to be able to study them and additional providers will commence delivery in 2021.
Locally, Hugh Baird College will be delivering T levels from September 2021, initially,
offer T Levels in Construction, Digital and Health Care.
2.4 The Combined Authority has secured £0.2m grant funding investment from the Gatsby
Foundation to deliver a routes ready programme of activity to help to prepare colleges
and training providers to be ready to deliver the new T levels. The key element of this is
the delivery of the Industrial Placement for up to 60 days, and work is under way with
colleges and the growth platform to explore options as to how to make this as easy as
possible for employers to engage with.
3. European Social Fund
3.1 Liverpool City Region was allocated around £100m of European Social Fund and Youth
Employment Initiative as part of the 2014-2020 European Programme. The value of this
has been underwritten by Government through the EU exit negotiations to ensure that
support can continue to be provided to people in local areas.
3.2 There has been a focus on investing in activities that fill in delivery gaps, responding to
the needs of employers and investing in capacity development. At the time of drafting,
the programmes in delivery are as follows:
Table 12 – Current ESF programme delivery
Programme Delivered by
Ways to Work Liverpool City Region Councils
Talent Match Plus Merseyside Youth Association
Directions The Women‟s Organisation and CVS partners
New Futures VOLA and CVS partners
Community Grants Workers‟ Educational Association
3.3 In addition, the following calls have closed and applications are awaiting appraisal by the
Department for Work and Pensions:
Table 13 – ESF calls awaiting appraisal
Programme Value
Graduate Placement and Employability £3.65m
Supported Employment Initiatives £2.5m
Skills and Apprenticeship Brokerage and Training Fund £5.5m
Higher Level Skills, Entrepreneurship and Leadership & £5.2m
Management
Youth Employment Initiative £1m plus up to £80m
from national call
Active Inclusion £4m
3.4 These calls take the value of commitments over and above the £100m allocated funding.
The City Region will be making submissions to the National Reserve Fund for additional
funding to continue programmes through to 2022.
3.5 There have been commitments that European Social Fund will be followed by a Shared
Prosperity Fund following the UK‟s exit from the European Union. This funding needs to
be available to support delivery from Summer 2022 if a significant gap in service delivery
is to be avoided. This is the matters of regular and detailed discussion with officials and
Ministers.
284. Households into Work
4.1 Households into Work is a £4.45m programme, designed to support people to tackle
their barriers and get into or closer to work. The innovation is that it operates on a
household basis, rather than individually. £3.45m funding was secured through the
devolution deal with the balance being provided locally by the Combined Authority.
4.2 Support is provided by 25 Employment Advocates located in each Council areas,
alongside and complementing Councils‟ own Ways to Work delivery. Advocates work
on a case management approach, seeking to align support across public services and
building capability and resilience within individuals and households.
4.3 The current performance is as follows:
Table 14 – Households into Work Delivery (September 2019)
Target for Year 3 Current position
(March 2020) (September 2019)
Number of households who have started on
800 1,007
the programme
Number of households where individuals
600 715
have completed at least one agreed activity
Number making significant improvements /
500 651
moving close to work
Moved into employment (16 hours per
20% 22%
week for 4 weeks)
4.4 People in receipt of support from Households into Work complete a series of
assessment against an Outcome Star. Across a range of measures, this provides the
ability to track progress across a range of themes.
Table 15 – Households with progress measures (September 2019)
Number of progress measures Proportion
0 or 1 41%
2-4 29%
5+ 30%
Of the 4,334 progress measures achieved „Emotional Wellbeing‟ accounts for the
highest number with 666; „Aspiration & Motivation‟ is 2nd with 642 „Skills‟ is 3rd with 607;
and „Money‟ is 4th with 603.
4.5 Individuals declare a variety of barriers to them finding or sustaining employment with
over 65% declaring a mental health condition; almost 26% declare a care responsibility;
almost 23% are lone parents; over 16% have been a victim of domestic violence; and
almost 16% declare themselves as homeless or temporarily housed. Over 45% of clients
identify 3-4 barriers, over 26% identify 1-2 barriers; and over 20% identify 5-6 barriers.
This underlines the multiple and complex nature of the barriers being faced and of the
complexities and challenges of working through them.
4.6 Funding has been secured to extend the delivery through to June 2020, and future
funding will be dependent upon accessing ESF funds for an extension through to June
2022.
4.7 There is a summative qualitative evaluation being conducted by the Heseltine Institute of
Public Policy and Practice at University of Liverpool. This will be aligned with the
29external quantitative evaluation, which will derive the economic and fiscal impact of
having delivered the support to Households.
5. Ways to Work
5.1 Ways to Work is a £40m Liverpool City Region Programme delivered by the six local
authorities over 200 employment advisors, Employer Engagement Officers, Mentors and
Coaches. It is a local intelligence driven, comprehensive and integrated programme for
young people and adults, designed to improve personal resilience and progress to
sustainable employment. The key deliverables are:
25,145 have accessed employability support;
1,111 have been supported into education or training; and
8,145 have been supported into employment.
5.2 The Ways to Work programme works with people to help them into work through
providing information, advice and guidance, work placements and targeted training.
There is also initiatives to specifically support vulnerable young people, other vulnerable
groups and people who are out of work. This provides a positive impact on our local
communities, and the opportunity to gain employment, skills and training for participants.
5.3 As Ways to Work is delivered by the 6 Local Authorities of the LCR close alignment with
other council services such as health, childrens services and social services has been
far easier to implement and the relationships developed between services and individual
staff have resulted in better outcomes for participants and a more developed joined up
thinking.
5.4 A major part of Ways to Works provision is delivering ILM opportunities throughout the
Liverpool City Region, which tackle the lack of access and opportunity for some groups
furthest from the job market and those most at risk of being left behind as the economy
strengthens, e.g. Care Leavers, residents with mental health problems, people with
learning difficulties, single parents and ex-offenders amongst others. Opportunities are
sourced by our employer engagement teams with businesses who employ less than 250
staff. Opportunities are for between 6 and 12 months and all participants are paid at
least living wage rates. Hours are between 16 and 40 hours per week.
5.5 ILMs provide a bridging route into long-term sustainable work, making the transition from
worklessness into employment and each participant is allocated a mentor to support
through the process, Support is individually tailored and targeted where it is needed
most ensuring a cost effective use of resources. After 3 years Ways to Work has
delivered 1,756 ILM opportunities to LCR residents and most participants end up in
permanent positions after their ILM.
6. The Youth Employment Gap
6.1 Equipping young people with the skills and qualifications to access and progress in
learning and employment continues to be a priority in the Liverpool City Region.
Practitioners and Policy makers and observers in the UK and around the world – from
the UK‟s National Institute of Economic and Social Research to the World Economic
Forum – all agree that youth unemployment and inactivity is one of the most serious
economic and social problems facing developed and developing economies alike.
6.2 Young people of working age who are not engaged in or able to contribute to the
productive output of the local economy are a loss of talent and resources. Young people
aged 19 and above who have not achieved the equivalent to 5 GCSEs including Maths
30You can also read