LEVELIZED COST OF ELECTRICITY RENEWABLE ENERGY TECHNOLOGIES - JUNE 2021
←
→
Page content transcription
If your browser does not render page correctly, please read the page content below
FRAUNHOFER INSTITUTE FOR SOLAR ENERGY SYSTEMS ISE

LEVELIZED COST OF ELECTRICITY
RENEWABLE ENERGY TECHNOLOGIES
JUNE 2021

  01

                                                    © Rainer Sturm 2010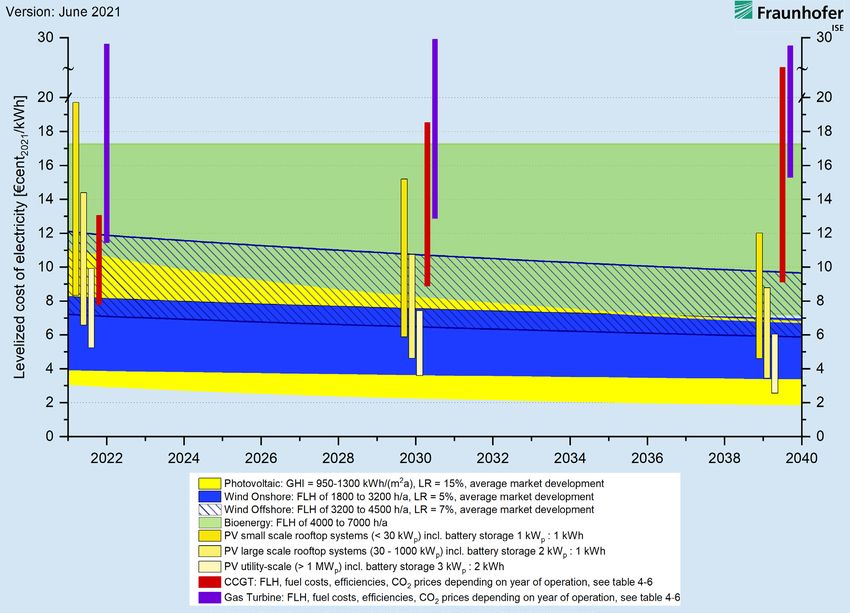
LEVELIZED COST OF ELECTRICITY
RENEWABLE ENERGY TECHNOLOGIES
June 2021

CHRISTOPH KOST
SHIVENES SHAMMUGAM
VERENA FLURI
DOMINIK PEPER
ASCHKAN DAVOODI MEMAR
THOMAS SCHLEGL

FRAUNHOFER INSTITUTE FOR SOLAR ENERGY SYSTEMS ISE

  02

CONTENTS

                                   Summary									2

                                   1. Objective of this analysis							 6

                                   2. Historical development of renewable energy technologies		                                    9

                                   3. Input data for the calculation of LCOE			                                                   11

                                   4. LCOE of energy technologies in 2021                                                         17

                                   5. Forecast of LCOE up to 2040 in Germany                                                      27

                                   6. LCOE for renewables in regions with high solar irradiation
                                      and favorable wind conditions		                                                             31

                                   7. Excursus: Structural evaluation of added PV systems                                         34

                                   8. Appendix                                                                                    36

                                   9. References                                                                                  41

Contact Person:
Dr. Christoph Kost
christoph.kost@ise.fraunhofer.de

Fraunhofer Institute
for Solar Energy Systems ISE
Heidenhofstraße 2
79110 Freiburg                     Acknowledgements
www.ise.fraunhofer.de
                                   We thank Patrick Jürgens, Andreas Bett, Peter Nitz, Matthias Vetter, Johannes Wüllner, Stephan
Directors of Institute:            Lux and Anne Joost for their valuable contribution and great support in creating this study.
Prof. Dr. Hans-Martin Henning
             1 Bett
Prof. Dr. Andreas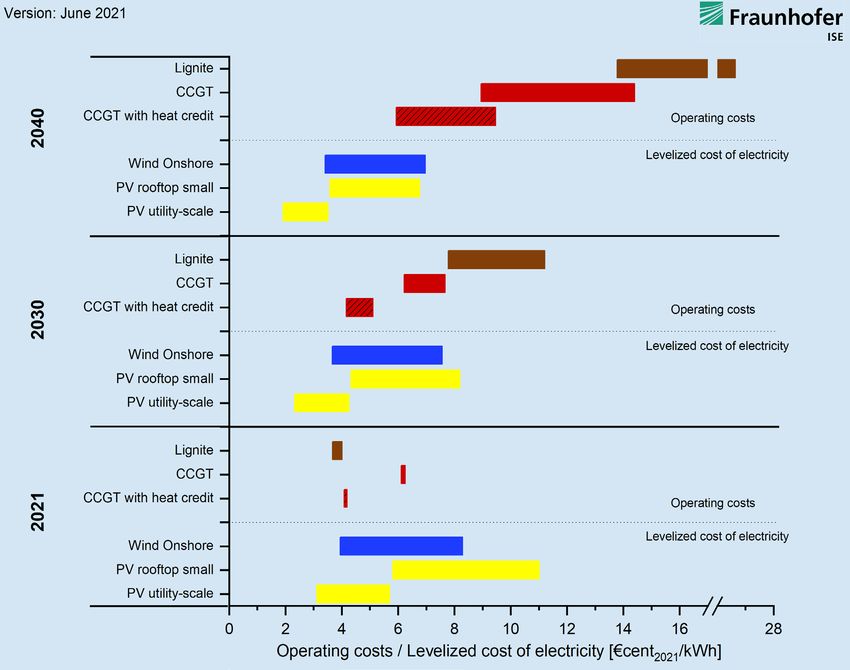
SUMMARY

The present study (2021) compares the levelized cost of elec-        ket. As a reference, the development of the LCOE for newly
tricity (LCOE) of renewable energy technologies for electricity      built conventional power plants (lignite, hard coal, combined
generation with conventional power plants. The future cost ra-       cycle gas turbines (CCGT), gas turbine) is also examined. Figure
tio between the different power generation technologies is also      1 shows the LCOE for renewable and fossil power plants po-
compared for the years 2030 and 2040. For the cost develop-          tentially built in 2021.
ment of renewables, cost development based on technology-
specific learning rates (LR) and market scenarios are used.          Depending on the type of systems and solar irradiation, PV sys-
                                                                     tems have a LCOE between 3.12 and 11.01 €cent/kWh, exclu-
The focus is on the LCOE of photovoltaic (PV), wind power            ding value-added tax (VAT). The study distinguishes between
plants (WPP) and bioenergy plants in Germany. For the first          smaller rooftop PV systems (< 30kWp), large rooftop PV sys-
time, PV battery systems are included in the study, as they re-      tems (> 30kWp), and ground-mounted utility-scale PV systems
present a growing segment of the German power system mar-            (> 1 MWp). Currently, specific system costs lie within the range

Figure 1: LCOE of renewable energy technologies and conventional power plants at locations in Germany in 2021. Specific investments are
considered using a minimum and maximum value for each technology. The ratio for PV battery systems expresses PV power output (kWp)
over usable battery usable capacity (kWh).

    2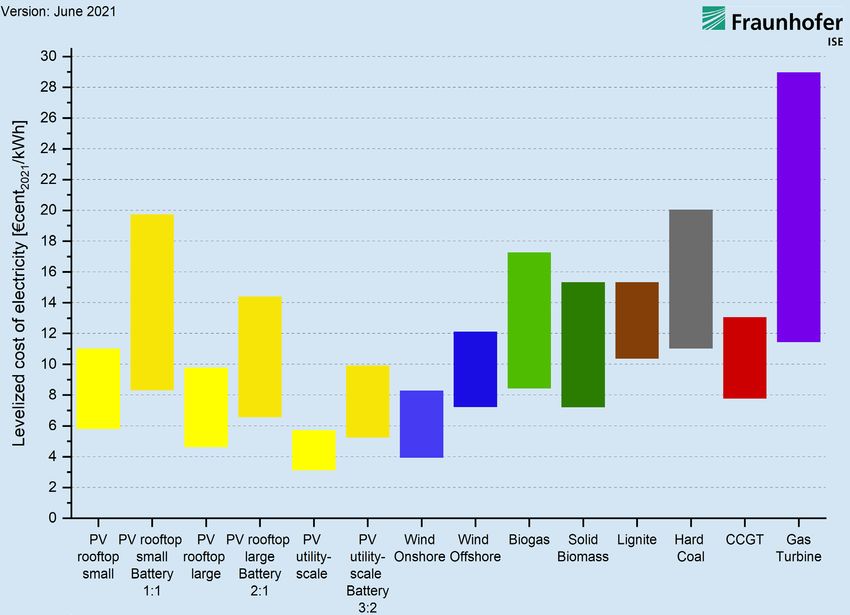
of 530 to 1600 EUR/kWp. Thus, they have continued to fol-            prices, solar irradiation, wind conditions, fuel costs, number of
low a decreasing trend, especially for large systems. For smaller    full load hours, costs of CO2 emission certificates, etc.), which are
rooftop systems, however, a trend towards slightly more ex-          listed in Tables 1 to 6. This methodology is exemplarily explained
pensive systems can be detected. The LCOE for PV battery sys-        for the cost range of PV: The upper limit of the LCOE results
tems currently range between 5.24 and 19.72 €cent/kWh. This          from the combination of a PV power plant with a high procure-
wide range is the result of cost differences for battery systems     ment price at a location with low solar irradiation (e.g. northern
(500 to 1200 EUR/kWh) in combination with cost differences           Germany). Conversely, the lower limit is defined by the most
for PV systems and varying levels of solar irradiation. In additi-   inexpensive solar system at locations with high solar irradiation
on, battery storage systems can contribute to system security in     in southern Germany. This same process is carried out for wind
the electricity system and the stabilization of feed-in curves or    and biomass power plants as well as conventional power plants.
battery discharges high demand periods.                              The usual financing costs on the market and the surcharges for
                                                                     risks are included in detail and are specific to each technology.
The LCOE of onshore wind power plants in 2021, with specific         This provides a realistic comparison of the power plant locations,
plant costs ranging from 1400 to 2000 EUR/kW, are between            technology risks and cost developments. The level of financing
3.94 and 8.29 €cent/kWh. As a result, PV systems and onshore         costs has considerable influence on the LCOE and the competi-
wind power plants are, on average, the least expensive techno-       tiveness of a technology. Furthermore, all of the costs and dis-
logies in Germany, both among renewable energy technologies          count rates in this study are calculated with real values (reference
as well as all other power plants. Offshore wind power plants        year 2021). Due to the high costs of coal-fired power plants in
also continue to record decreasing LCOE. With up to 4500 full        2021, the LCOE of these power plant types are not extrapolated
load hours, offshore wind power plants achieve electricity pro-      for the future, but are at least at the 2021 levels and significantly
duction costs between 7.23 €cent/kWh and 12.13 €cent/kWh.            higher if CO2 certificate prices rise.
The specific plant costs are between 3000 and 4000 EUR/kW,
including the connection to the mainland.                            For PV systems, a learning rate (LR) of 15% is assumed. In
                                                                     2040, the LCOE ranges from 3.58 to 6.77 €cent/kWh for
For the first time, a distinction was made between biogas and        small rooftop PV systems and from 1.92 to 3.51 €cent/kWh
solid biomass in the LCOE of bioenergy. In addition, heat uti-       for ground-mounted systems. From 2024, the LCOE of all PV
lization was also assumed, which lowers the LCOE. The LCOE           systems without battery storage is below 10 €cent/kWh. PV
of biogas range from 8.45 to 17.26 €cent/kWh at substrate            system prices drop to below 350 EUR/kW by 2040 for ground-
costs of 3.84 €cent/kWhth. For solid biomass plants, LCOE are        mounted systems and to as low as 615 to 985 EUR/kW for
slightly lower between 7.22 and 15.33 €cent/kWh, mainly due          small-scale systems. In 2030, electricity generation from a PV
to lower substrate costs considered here.                            battery system is projected to be cheaper than from a CCGT
                                                                     power plant. In 2040, even small PV battery systems can
The LCOE of potentially newly built coal-fired power plants          be expected to reach LCOEs between 5 and 12 €cent/kWh,
(hard coal and lignite) have risen considerably due to increased     provided battery storage prices drop to the assumed 200 to
CO2 certificate prices; the LCOE are above 10 €cent/kWh. If a        720 EUR/kWh.
lignite-fired power plant were built today, LCOE of 10.38 to
15.34 €cent/kWh could be expected. The LCOE of large coal-           The LCOE of onshore wind power plants are among the lo-
fired power plants are somewhat higher, at between 11.03 and         west of all technologies, together with PV utility-scale.
20.04 €cent/kWh. The LCOE of combined cycle power plants is          From current LCOE between 3.94 and 8.29 €cent/kWh,
somewhat lower at between 7.79 and 13.06 €cent/kWh. Gas              costs will decrease in the long term to between 3.40 and
turbine power plants for short-term flexible use land at 11.46       6.97 €cent/kWh. For the future trend, a LR of 5% is expected.
and 28.96 €cent/kWh. As described above, the decisive factor         Improvements are mainly expected in higher full load hours
here is the CO2 price, as the energy source prices were assumed      and the development of new sites with specialized low wind
to be constant due to declining demand.                              power plants. Offshore wind power plants still have a strong
                                                                     cost reduction potential compared to onshore wind power
                                                                     plants. By 2040, the LCOE will drop to values between 5.87
Forecast of LCOE in Germany through 2040                             and 9.66 €cent/kWh, depending on location and wind supply.

Figure 2 shows the results for the future development of the         Since cost reductions are expected to be low for biogas and
LCOEs in Germany until 2040. The illustrated range reflects the      solid biomass power plants, no learning rates are used for the
possible cost variations in the input parameters (e.g. power plant   technologies. This leads to constant LCOE until 2040 of 8.45 to

    3
17.26 €cent/kWh for biogas and of 7.22 to 15.33 €cent/kWh                Due to rising CO2 prices, the LCOE of CCGT power plants
for solid biomass, each taking into account revenues from heat           will increase from current values between 7.79 and
generation. For bioenergy, the availability, heat utilization and        13.05     €cent/    kWh     to    values    between      9.19    and
fuel costs of the substrate are decisive for the future develop-         25.05 €cent/kWh in 2040. Gas turbines account for an even
ment of the LCOE.                                                        higher LCOE between 15.29 and 28.69 €cent/kWh in 2040.

Figure 2: Learning-curve based forecast of the LCOE of renewable energy technologies and gas-fired power plants in Germany until 2040.
Calculation parameters are listed in Tables 1 to 6. The LCOE value per reference year refers in each case to a new plant in the reference year.

Finally, a comparison of LCOE (i.e., the cost of generating elec-        will continue to rise in order to achieve the climate goals, the
tricity, taking into account the construction or purchase of the         operating costs of CCGT and lignite-fired power plants will be
plant) of renewables with the operating costs of conventional            at the level of small rooftop PV systems in 2030. In the case
power plants was carried out (see Figure 3). For this purpose,           of lignite, even far exceeding this level. Only if the use of heat
the operating costs of existing lignite-fired power plants and           in district heating grids is possible via heat extraction, then
CCGT power plants (with and without heat extraction) are                 CCGT power plants can still achieve operating costs of 4 to
compared with the LCOE of new onshore wind plants, small                 5 €cent/kWh. In 2040, even the operating costs of CCGT pow-
rooftop PV systems and large ground-mounted PV systems. It               er plants with heat utilization will exceed 5 €cent/kWh. Normal
is shown that in 2021 the LCOE of renewables are at least on             CCGT power plants have operating costs of over 9 €cent/kWh,
a par with the operating costs of conventional power plants.             lignite power plants of over 13 €cent/kWh.
In some cases, wind onshore plants and ground-mounted PV
systems are already below the operating costs of conventional            The analysis shows how even existing conventional fossil po-
power plants, as these can reach values below 4 €cent/kWh                wer plants will reach very high operating costs by 2030 at the
only in some instances. With further decreasing LCOE for new             latest, while the LCOE of new renewable energy plants will be
renewable energy plants and the expectation that CO2 prices              significantly lower.

    4
Figure 3: Comparison of LCOE of renewables with operating costs of existing conventional fossil-fuel power plants in 2021, 2030, and 2040

    5
1. OBJECTIVE OF THIS ANALYSIS
Decarbonization and transformation of the energy system are Analysis of the current situation and future market deve-
associated with both technical and economic efforts. The cost lopment of photovoltaic and solar thermal power plants
of current and future power generation is heavily dependent on (CSP) for locations with favorable solar irradiation
the cost of expanding and operating power plants. The costs
of renewable energy technologies in particular have changed Insights into the statistical evaluation of PV systems in the
dramatically in recent years. This development is driven by tech- core energy market data register (Marktstammdatenregis-
nological innovations such as the use of less-expensive and bet- ter - MaStR)
ter-performing materials, reduced material consumption, more
efficient production processes, increasing efficiencies as well as In order to be able to realistically model the variations in market
automated mass production of components. For these reasons, prices and fluctuations in full load hours (FLH) within respective
the aim of this study is to analyze the current and future cost technologies, upper and lower price limits are indicated. These
situation as transparently as possible in the form of LCOE. limits are chosen based on a technology cost analysis of indivi-
dual components, market and literature research as well as la-
test reports from current power plants. It should be noted that
Central contents of this study market prices are often based on applicable feed-in tariffs and
are therefore not always in free competition. Characteristics
Analysis of the current situation and the future market de- of individual technologies that cannot be mapped into LCOE,
velopment of photovoltaic (PV), wind power plants (WPP) such as the advantages of easily integrable energy storage, the
and bioenergy plants in Germany number of FLH, decentralized power generation, capacity for
follow-up operation and time of day availability, have not been
Economic modeling of technology-specific LCOE (as of taken into account. The technologies are evaluated and com-
June 2021) for different types of installations and site con- pared based on standard market financing costs and historically
ditions (e.g. solar irradiation and wind conditions) on the proven learning curves. As a reference, the current and future
basis of common market financing costs LCOE of new conventional power plants (brown coal, hard coal,
combined cycle power plants and gas turbines) are calculated.
Economic analysis of photovoltaic and battery storage sys- In addition, the future operating costs of conventional power
tems plants are compared with the LCOE of renewables.
Assessment of the different technology and financial pa- The LCOE of renewable technologies depends largely on the
rameters based on sensitivity analyzes of the individual following parameters:
technologies
Specific investment cost (CAPEX)
Forecast of the future LCOE of renewable energy techno- for the construction and installation of power plants with upper
logies until 2040 using learning curve models and market and lower limits; determined based on current power plant and
growth scenarios market data
Forecast of LCOE of existing conventional power plants in Local conditions
2021, 2030 and 2040 under estimation of future opera- with typical solar irradiation and wind conditions for different
ting costs locations and full load hours (FLH) in the energy system
6
Operating cost (OPEX) The operation of onshore WPP in Germany is studied at 1800 to
during the power plant’s operational lifetime 3200 FLH per year as well as offshore WPP at 3200 to 4500 FLH
per year. In addition, high wind speed sites for both onshore
Lifetime of the plant and offshore WPP are investigated. Sites with FLH between
3000 and 4000 h for onshore WPP and between 4000 and
Financing condition 5000 h offshore are selected, corresponding to conditions in
earnings calculated on the financial market and maturity peri- the northeast of the UK.
ods based on technology-specific risk surcharges and country
specific financing conditions taking into account the respective Bioenergy power plants
shares of external and equity-based financing.
Biogas plants (> 500 kW) with substrate (renewable raw
The following power generation technologies are studied and materials and excrements)
assessed in various design sizes with respect to the current level Plants that use solid biomass fuels
of LCOE at local conditions in Germany:
Heat utilization is also specified. It lowers the LCOE because
Photovoltaic power plants (PV) part of the costs is allocated to the heat quantity.
Modules based on crystalline silicon solar cells
Conventional power plants
Small rooftop systems (≤ 30 kWp) – »PV rooftop small«
Large rooftop systems (> 30 kWp) – »PV rooftop large« Lignite-fired power plants (1000 MW)
Ground-mounted utility-scale power plants (> 1 MWp) – Hard coal power plants (800 MW)
»PV utility-scale« Combined Cycle Gas Turbine power plants
(CCGT power plants, 500 MW)
For the PV power plants, locations in Germany with global ho- Gas turbine power plants (200 MW)
rizontal irradiation (GHI) of 950 to 1300 kWh/(m²a) are studied.
Standard modules with multi-crystalline silicon solar cells are For comparison, the LCOE of new conventional power plants
taken into consideration. with different development paths for FLH as well as for prices of
CO2 emission certificates and fuels (lignite, hard coal or natural
Photovoltaic systems with battery storage gas) are analyzed. Heat utilization from CCGT power plants is
specified as a special case in the detailed analysis. It lowers the
Small rooftop systems (≤ 30 kWp) plus battery – ratio of LCOE, since part of the costs is allocated to the heat volume.
the power output of the PV system in kWp to the usable
capacity of the battery storage in kWh 1:1 - »PV rooftop Concentrated solar power plants (CSP)
small incl. battery 1:1«
Large rooftop systems (> 30 kWp) plus battery with PV Parabolic trough power plants (100 MW) with thermal
battery ratio 2:1 – »PV rooftop large incl. battery 2:1« storage – "CSP"
Ground-mounted utility-scale power plants (> 1 MWp)
plus battery with PV battery ratio 3:2 – »PV utility scale For locations with high solar irradiation, not only photovoltaic
incl. battery 3:2« technology, but solar thermal power plants (concentrated so-
lar power) are also investigated. As CSP power plants can only
The combination of PV system and battery storage is estimated be used to generate electricity under high direct irradiation,
using market-typical dimensions (evaluation of market master the analysis focuses on locations with direct normal irradiati-
data register and results of innovation tenders) of battery capa- on (DNI) of 2000 kWh/(m²a) (e.g. in Spain) and locations with
city to PV power output. 2500 kWh/(m²a) (e.g. in the MENA countries).
Wind power plants (WPP) Nuclear power plants, hydropower plants and geothermal pow-
er plants are not considered. As new constructions, they either
Onshore (turbine size 2 – 4 MW) no longer have any relevance in the German electricity system,
Offshore (turbine size 3 – 6 MW) have relatively low technical potential or have very site-specific
cost parameters that present a high degree of complexity when
recording costs as part of an LCOE analysis.
7
» Levelized Cost of Electricity: Renewable Energy Techno-           to the last study, higher bandwidths and target values in 2050
logies « version 2021 - Comparison to the previous studies          are chosen for CO2 certificate prices. Fuel prices and full load
                                                                    hours are lowered, as worldwide consumption is assumed to
The present study is a methodological and content update of         decline. In addition, the emitted CO2 emissions and thus also
the March 2018 (Kost et al. 2018), December 2013 (Kost et al.       the energy quantities must be significantly lowered with regard
2013), May 2012 (Kost et al. 2012) and December 2010 (Kost          to 2050.Due to a continued very low interest rate level, more fa-
und Schlegl 2010) versions and addresses current trends in cost     vorable financing conditions for power plants result. While the
development over the last three years. In addition to previous      interest rate for 20-year federal bonds was still 1.07% in 2017,
changes described below, the following changes have been            it has dropped to an average of 0.25% in 2021 (as of April
made in the 2021 version.                                           2021), in particular due to the effects of Covid-19. However,
                                                                    interest rates are expected to increase in coming years. There-
In this study (version 2021), the LCOE of PV systems are expan-     fore, the average interest rate level is expected to be somewhat
ded. The analysis now also includes the concept of PV storage       higher than today.
systems. In 2020, home storage systems with a total capaci-
ty of 850 MWh were installed. In the April 2021 innovation          The following key changes implemented in the 2018 version have
tender, all 18 bids awarded were PV battery systems (258 MW         been retained:
PV capacity). The main evaluation, therefore, also includes all
size categories with battery storage systems.                       For WPP, there is no distinction between high wind-speed and
                                                                    low wind-speed turbines. Increasing FLHs are assumed for both
The size categories of PV systems are adjusted according to the     onshore and offshore turbines, which correlates with the current
current market situation in Germany (small rooftop PV systems       market trend of increasing ratio between the rotor diameter and
up to 30 kW, larger rooftop systems on businesses or commer-        the nominal power of the generator, as well as the increasing
cial buildings larger than 30 KW, and large ground-mounted          hub height.
systems larger than 1 MW).
                                                                    Apart from that, both fixed and variable operational costs are
In addition to biogas plants, biomass plants combusting solid       considered for WPP. Fixed operating costs consist of non-revenue
biomass are also considered.                                        related maintenance and repair costs, management and lease
                                                                    costs, and the costs of insurance. Both fixed and variable ope-
Combined heat and power is considered for bioenergy plants          rating costs are also taken into account for conventional power
and CCGT power plants.                                              plants, which form a significant proportion of the LCOE, as these
                                                                    include fuel costs and the costs of CO2 certificates in addition to
The development of fuel prices, CO2 prices and full load hours is   the costs of auxiliary materials and raw materials.
adjusted according to the current targets for Germany towards
a climate neutral energy system in 2050. Specifically compared

     8
2. HISTORICAL DEVELOPMENT OF
RENEWALE ENERGY TECHNOLOGIES
Over the past 15 years, the global renewable energy market has power plant capacity installed worldwide to generate electricity
seen strong growth (see Figure 4). The further increased com- from all renewable sources was just under 2800 GW at the end
petitiveness compared to conventional power plants and the of 2020, a good 260 GW more than in 2019 (IEA 2020) 35
international efforts against climate change (Paris Agreement) and 37 GW more than the year before. The installed capacity
have opened up additional markets and fields of application for of nuclear power plants was 392 GW (WNA 2021), 4 GW less
renewables. Worldwide, renewables are among the most eco- than the year before.
nomical types of electricity generation in almost all countries.
Investment conditions for renewables are excellent in many Due to different cost and market structures as well as support
countries, as meeting climate targets has become a much high- schemes, the markets for individual technologies have develo-
er priority. Investments in technologies that burn fossil fuels are ped very differently. The market for wind power plants reached
increasingly restricted or no longer pay off. competitive market prices at an early stage and has therefore
found markets in many countries even without incentive pro-
grams. The installed capacity currently totals 733 GW, inclu-
ding 699 GW onshore and 34 GW offshore, each with new
installations in 2020 of about 105 and 6 GW, respectively
(IRENA 2021a). By the end of 2020, the installed capacity of
photovoltaics totaled 707 GW with new capacity additions of
126 GW and has caught up with wind power. Since 2016, the
annual addition of PV capacity has been higher than that of wind
(IRENA 2021a). In Germany, the total installed capacity of wind
power plants amounted to 62 GW and of PV systems to 54 GW
at the end of 2020.
The global outlook for market development of wind power
Figure 4: Global cumulative installed capacity 2011-2020 of PV, plants remains positive. Growth forecasts for offshore wind po-
onshore and offshore wind, biomass plants and CSP (IRENA 2021a).
wer plants assume an increasing share of annual installations
The strong market growth of renewables and the substanti- from the current 10% to around 20% (GWEC 2020b).
al investments in new power plants were accompanied by in-
tensive research efforts, resulting in improved system solutions The photovoltaic market has developed into the most impor-
with higher efficiencies, lower production and operating costs. tant segment of renewables in terms of capacity due to the
In combination with mass production, the specific investments strong expansion of production capacities, particularly in Asia,
and thus the LCOE of all technologies analyzed here were sig- using highly automated production lines. A further very strong
nificantly reduced. Further decreases in the LCOE will allow the expansion of production capacities and growth of the PV mar-
competitiveness and sales potential of the technologies to con- ket is expected, but no longer as severe price declines as in the
tinue to grow significantly and contribute to a further dynamic past.
market development of renewables.
The expansion of bioenergy plants has a significantly lower vo-
The amount of renewable energy power plant capacity installed lume compared to photovoltaics and wind power. The market
worldwide was just under 2800 GW at the end of 2020, a good for biogas plants has grown most strongly in Germany in the
260 GW more than in 2019 (IRENA 2021a). The amount of last 10 years, followed by China and Turkey. This is mainly due
9to the remuneration schemes in these respective countries. The ning curve models are based on market scenarios for each
capacity addition of solid biomass plants has been led by Chi- technology with a forecast of the future market developments
na in the past 10 years, followed by India and Brazil (IRENA taken from reference scenarios of various studies (Table 13 in
2021a). In Germany, the total installed capacity of bioenergy the appendix). The technology-specific market scenarios give
plants at the end of 2020 was 10.4 GW (AGEE-Stat 2021). each technology a development horizon, which is influenced
by numerous technological, energy-political and economic
In addition to the technologies described above, which are used decision-making variables over the next twenty years. For all
in Germany, solar thermal power plants can play an important technologies, there is considerable uncertainty about the actu-
role for power generation in countries with higher solar irradi- al realizable market development until the year 2040. Market
ation. CSP power plants have been gaining market shares in development in the coming years will depend in particular on
some countries since 2007, following the first installations in the implementation of the Paris climate targets. However, the
the USA in the 1980s, so that almost 6.5 GW have now been actual market development of each technology is crucial for
installed (IRENA 2021). Especially in the sunny MENA (Middle the temporal progress of the cost degression in the learning
East and North Africa) countries, but also in China, the concept curve model. The presented developments of LCOE are there-
of CSP power plants is currently being pursued by policy makers fore potential development paths based on current market de-
due to the advantages of thermal energy storage. velopments from different scenarios and technology-specific
assumptions such as learning rate, but also depending on loca-
For the forecast of the LCOE until 2040, this study uses lear- tion factors such as realized full load hours.
ning curve models to estimate future developments. The lear-
10ZUSAMMENFASSUNG
3. INPUT DATA FOR THE CALCULATION OF
LEVELIZED COST OF ELECTRICITY
Technology and financing parameters 30 kWp and ground-mounted PV systems (> 1 MWp). By using
these costs, the LCOE for each point of time for investment and
A detailed explanation of the methodology of LCOE and lear- construction are calculated. The technical and financial lifetime
ning rate is found in the Appendix on page 36. was set at 30 years for PV systems. The experience of Fraun-
hofer ISE in the field of plant monitoring reflects the longer
Upper and lower price limits that do not take outliers into lifetime – previously lifetime was set at 25 years. Battery storage
account is calculated for all technologies based on the data was investigated in a typical constellation with a PV system.
research; the regular market costs for installation of power While in practice a wide range of ratios of PV power output to
plants varies between them. Uniform amounts of investments battery storage can be found, three currently typical ratios were
are assumed for all locations. In practice, one must take into examined for the analysis. It is assumed that in the area of PV
account that the investments in power plants in markets that home battery storage system, the power output of the PV sys-
have not yet been developed can be considerably higher in tem in kWp corresponds to 1:1 capacity of the battery storage
some cases. Table 1 shows the investment costs in EUR/kW in kWh. In the area of large-scale rooftop systems, a ratio of 2:1
(nominal capacity) for all technologies considered that were is assumed. In the area of ground-mounted systems, a ratio of
determined based on market research on currently installed 3:2 is assumed. The costs for battery storage systems refer to
power plants in Germany as well as taking external market stu- the usable capacity, including installation costs. The service life
dies into account. Within the technologies, the system costs for battery storage was assumed to be 15 years. Thus, after this
were distinguished based on power plant size and power plant time, a replacement of the battery is incurred at reduced costs.
configuration.
The data for offshore wind were obtained from current and
For PV, the upper and lower limits for the installation cost are completed projects in the German North Sea and Baltic Sea.
differentiated according to the system sizes of small rooftop The input parameters for onshore wind power are also taken
systems up to 30 kWp, large rooftop systems greater than from current, planned and recently completed projects.
CAPEX Wind Wind Solid Gas
Biogas Lignite Hard coal CCGT
[EUR/kW] onshore offshore biomass turbine
2021 low 1400 3000 2500 3000 1600 1500 800 400
2021 high 2000 4000 5000 5000 2200 2000 1100 600
PV rooftop small PV rooftop large PV utility-scale
PV rooftop PV rooftop PV incl. battery incl. battery incl. battery
CAPEX small large utility-scale storage storage storage
(≤ 30 kWp) (> 30 kWp) (> 1 MWp) (≤ 30 kWp, PV (> 30 kWp, PV (> 1 MWp, PV
output to battery output to battery output to battery
capacity 1:1) capacity 2:1) capacity 3:2)
Unit [EUR/kWp] [EUR/kWp] [EUR/kWp] [EUR/kWh] [EUR/kWh] [EUR/kWh]
2021 low 1000 750 530 500 600 500
2021 high 1600 1400 800 1200 1000 700
Table 1: Specific CAPEX in EUR/kW or EUR/kWh for current plants in 2021 (excluding value-added tax).
11Currently, a large number of bioenergy plants with a wide The following parameters are used in the calculation of LCOE
variety of feedstocks, technologies and applications are in for mid-2021 and future installations (Table 2). The financing
operation. In this study, a distinction is made only between parameters have been continuously analyzed since the previous
electricity generation from solid biomass and from biogas. studies in 2010, 2012, 2013 and 2018. The risk and investor
Electricity generation from biogas plants is calculated based structure of each type has been adapted. It has to be noticed
on different substrates typical for agricultural biogas plants. that the financing conditions (in the form of interest rate for
The substrates used are cattle slurry and silage maize, whereby debt and equity) might increase again, especially for future pro-
silage maize is considered with a mass-related share of 47% jects.
(FNR 2020; Fraunhofer IEE 2019). Heat generation through
biogas plants presents an important operating parameter and In many studies, the aspect of technology specific financing
is also included in the calculation of the LCOE, taking into ac- conditions is not sufficiently analyzed. Often, similar discount
count a self-supply of heat of the biogas plants of 25%. In rates are assumed for all analyzed technologies and locations.
this study, biogas plants with a size of 500 kWel are depicted, This can lead to divergent LCOE compared to real LCOE. In this
as due to previous EEG structures, the average plant size is study, the discount rates are determined specifically for each
currently around 500 kWel (Matschoss et al. 2019). Electricity technology by applying the market capital cost (and the para-
generation from solid biomass covers a wide range of bioge- meter weighted average costs of capital – WACC) for each in-
nic fuels and in Germany is mainly generated from the com- vestment. The WACC consists of a share for the interest rate on
bustion of wood (waste wood, landscape wood residues, fo- debt and the return on equity. Large power plants constructed
rest wood residues, wood pellets and other industrial wood) and operated by large investors and institutions have a higher
(FNR 2020; Fraunhofer IEE 2019). In this study, wood WACC due to the expected return of the investor compared to
chips from forest wood residues, landscape wood residues small and medium size projects that are constructed by private
and bark are used as fuel for biomass plants ≥ 500 kWel persons or business partnerships. The return on equity expec-
(Fraunhofer IEE 2019). Heat generation of bioenergy plants ted by investors for technologies with lower maturity (e.g. off-
with combustion of solid biomass in form of heating energy shore wind) are additionally higher compared with established
is also specified in the calculation of the electricity generation technologies. It can be expected that the financial conditions
costs. Since CHP plants generate heat as well as electricity, the will be equalized after increase of installed capacity as the risk
total generation cost cannot be allocated to electricity genera- premium for new technology sinks with increasing experience.
tion alone. The heat credit is calculated from the fuel costs that
would be incurred for heat generation, but is available at no Since the WACC is derived from the usual interest rates and
cost from the heat generated in the combined production of expected returns on the market, which are given in nominal
the electricity-fueled CHP plant. values, the nominal value of the WACC is calculated first. This
Wind onshore Wind offshore Biogas Solid biomass Lignite Hard coal CCGT
Lifetime
25 25 25 25 40 30 30
in years
Share
80% 70% 80% 80% 60% 60% 60%
of debt
Share
20% 30% 20% 20% 40% 40% 40%
of equity
Interest rate
3.5% 5.0% 3.5% 3.5% 5.0% 5.0% 5.0%
on debt
Return
7.0% 10.0% 8.0% 8.0% 11.0% 11.0% 10.0%
on equity
WACC
4.20% 6.50% 4.40% 4.40% 7.40% 7.40% 7.00%
nominal
WACC
2.96% 5.24% 3.20% 3.20% 6.20% 6.20% 5.80%
real
OPEX fix
20 70 4% of CAPEX 4% of CAPEX 32 22 20
[EUR/kW]
OPEX var
0.008 0.008 0.004 0.004 0.0045 0.004 0.003
[EUR/kWh]
Annual
0 0 0 0 0 0 0
degradation
12PV rooftop PV rooftop PV PV rooftop small PV rooftop large PV utility-scale
small large utility-scale incl. battery incl. battery incl. battery
(≤ 30 kWp) (> 30 kWp) (> 1 MWp) (≤ 30 kWp, 1:1) (> 30 kWp, 2:1) (> 1 MWp, 3:2)
Lifetime
30 30 30 15 15 15
in years
Share
80% 80% 80% 80% 80% 80%
of debt
Share
20% 20% 20% 20% 20% 20%
of equity
Interest rate
3.0% 3.0% 3.0% 3.0% 3.0% 3.0%
on debt
Return
5.0% 6.5% 6.5% 5.0% 6.5% 6.5%
on equity
WACC
3.40% 3.70% 3.70% 3.40% 3.70% 3.70%
nominal
WACC
2.20% 2.50% 2.50% 2.20% 2.50% 2.50%
real
OPEX fix
26 21.5 13.3 0 6.0-10.0* 6.7-9.3*
[EUR/kW]
OPEX var
0 0 0 0 0 0
[EUR/kWh]
Annual
0.5% 0.25% 0.25% 0 0 0
degradation
Battery 40-50% of initial 35% of initial 30% of initial
- - -
replacement costs investment investment investment
Efficiency - - - 90% 90% 90%
Annual
- - - 200 100-300** 100-300**
charge cycles
Table 2: Input parameter for LCOE calculation. The real WACC is calculated with an inflation rate of 1.2%.
* related to the PV system power output (corresponds to 2% of the battery investment costs)
* Since the battery lifetime is assumed to be fixed, the annual charge cycles only have an influence on the value of the battery storage loss. A high number of
cycles (high losses) is used for the upper limit of the LCOE, a low number of cycles (low losses) is used to calculate the lower limit of the LCOE.
nominal value is then converted into a real value by taking an banks provide to the project. Since offshore wind parks conti-
assumed 1.2% p.a. inflation rate into account. This value has nue to evince a high project-specific risk, the average capital
been lowered from 2.0% compared to previous studies. costs are correspondingly higher than for comparable onshore
projects. If loans with low interest rates are available in suffici-
The decisive factor for the calculation of the LCOE is that all ent amount, for example from the KfW banking group, interest
payment streams are assumed at either nominal or real levels. rates on debt of approximately 1 to 3% can be achieved de-
A mixture of real and nominal values is incorrect and not per- pending on the technology. This is currently the case for small
mitted. To carry out the analysis on nominal values, the annual PV power plants, for which the effective interest rate of a KfW
inflation rate has to be projected by 2040. Since the forecast loan is currently only 1.75% for the highest rating class – with a
for the inflation rate over the long term is very imprecise and 20-year maturity and 20-year fixed interest (KfW 2021). In ge-
difficult, cost predictions are generally completed using real va- neral, interest rates are intentionally set somewhat higher as ac-
lues. All costs stated in this study therefore refer to real values tual rates are currently very low due to the COVID-19 pandemic
from 2021. The LCOE provided for future years in the figures and are expected to increase in the future.
always refer to new installations in the respective years. The
LCOE of a single project remains constant over its operational In international comparisons of locations, one must keep in
lifetime and is therefore identical to the value of the year of mind that the financing conditions differ, similar to the environ-
installation. mental conditions such as solar irradiation and wind conditions.
Especially in the case of renewable energy projects, whose eco-
A second factor influencing return on equity is the project-spe- nomic efficiency is significantly dependent on feed-in compen-
cific risk: The higher the risk of default, the higher the return sation, the country-specific risk of default of these payments,
on equity required by the investor. In order to keep the capital such as caused by national bankruptcy, must be taken into
costs low, a high share of debt with low interest rate is desira- account. Another factor is the availability of subsidized loans
ble. It is, however, also limited by the project-specific risk: The at favorable interest rates. Germany offers here very favorable
higher the risk of default, the lower the amount of debt that framing conditions for investments in renewable energy.
13Local Conditions The wind conditions are also location-dependent. Onshore
Solar irradiation and Full Load Hours (FLH) WPP can reach FLH of only 1800 hours per year at unfavorable
locations. The level of FLH, however, can reach values of up to
The amount of electricity yield at each power plant location is 3200 hours at selected locations near the coast in Germany.
an important parameter with a considerable influence on the The average FLH for onshore WPP constructed in 2016 is at
LCOE of renewable energy technologies. In the case of solar 2721 hours per year (Fraunhofer IWES 2018). Much higher FLH
technologies, the amount of diffuse or direct solar irradiation can be reached by offshore power plants with values between
(depending on the technology) plays an important role. The FLH 3200 hours at coastal areas and 4500 hours at locations with
of a wind farm can be calculated from the wind conditions at large distance to the coast (in the North Sea). Due to the trend
the power plant location as a function of the wind speed. In of increasing size and distance from the coast, offshore power
the case of biogas, however, the number of FLH is not sup- plants are expected to reach 5500 FLH in the best case (Reuter
ply dependent but is determined by the demand, availability of und Elsner 2016). This refers to an annual growth of 0.6%.
substrate and power plant design. Therefore, an annual growth of FLH for new installations is as-
sumed to be 0.5%.
For that reason, exemplary locations with specific FLH for
wind farms should be studied as well as locations with Biogas plants and plants using biogenic solid fuels can easily
specific energy sources from solar irradiation (see Tab- achieve a capacity utilization of 80-90% in Germany, which
le 3). At typical locations in Germany, the global horizontal corresponds to over 7000 FLH per year. Driven by the flexibili-
irradiation (GHI – consisting of diffuse and direct irradiation) is in ty premium introduced by the EEG, a flexible operation of the
the range of 950 and 1300 kWh per square meter per year (see plants is increasingly sought, which leads to decreasing full load
Figure 29). This corresponds to a solar irradiation of 1100 and hours. The aim of the flexibility premium is to increase the flexi-
1510 kWh/(m²a) onto an optimally oriented PV system (both ble share of the biogas plant's electricity production. This serves
in terms of southward orientation and optimum tilt angle). to compensate for the supply dependency of electricity gene-
After subtracting losses of electricity generation in the PV ration from solar and wind. For this reason, a range between
system, an average annual electricity yield between 935 and 4000 and 7000 full load hours is applied (DBFZ 2015).
1280 kWh per installed kWp is obtained. The full load hours of
the plants decrease accordingly if the plants are aligned to the Compared to most renewable energy technologies, the an-
east or west, for example, because the roof pitch is the same, or nual electricity generation and thus the number of FLH of a
if the plants are mounted flatter. Under certain circumstances, conventional power plant depends on the respective demand,
both aspects can be optimal from an economic efficiency calcu- the costs for fossil fuels and thus also on the competitiven-
lation and from the owner's point of view, taking into account ess of the technology in the energy system. Currently, the
the use of self-generated electricity. full load hours of lignite average 4625 hours across all plants.
Hard coal averaged 1640 hours and economic CCGT power
Electricity generation per 1 kWp
Solar irradiation
GHI with optimal angle of inclinati-
PV system (standard modules) on PV modules
[kWh/(m2a)] on and south orientation
[kWh/(m2a)]
[kWh/a]
Northern Germany 950 1100 935
Central Germany 1120 1300 1105
Southern Germany 1300 1510 1280
Wind speed at Electricity generation per 1 kW
Wind power plants (2 - 5 MW) Wind full load hours [h]
120 m hub height [m/s] [kWh/a]
Onshore: Inland Germany 5.5 1800 1800
Onshore: Northern Germany 6.4 2500 2500
Onshore: Coastal and high wind
7.8 3200 3200
locations Germany
Offshore: Short distance from coast 7.8 3200 3200
Offshore: Medium distance from coast 8.7 3600 3600
Offshore: Very good locations 10.3 4500 4500
Table 3: Annual returns at typical locations of PV and wind (Source: Fraunhofer ISE).
14Full load hours
of conventional Lignite Hard coal CCGT Gas turbine Biogas Solid biomass
power plants
[h/a]
Year 2020 High 7300 6200 8000 3000 7000 7000
Low 5300 2600 3000 500 4000 4000
Year 2030 High 5300 3300 7000 3000 7000 7000
Low 2300 2300 2000 500 4000 4000
Year 2040 High 2000 2000 5000 2000 7000 7000
Low 0 0 0 / 1000 0 / 1000 4000 4000
Year 2050 High 2000 2000 4000 2000 7000 7000
Low 0 0 0 / 1000 0 / 1000 4000 4000
Table 4: Development of full load hours (FLH) for conventional power plants and bioenergy plants.
plants 6500 hours in 2020 (Fraunhofer ISE 2021b). In the course costs and the energy yield of methane (9.97 kWh/Nm³). The
of increasing electricity generation from renewables, rising average substrate costs applied in this study therefore amount
CO2 certificate prices and the planned coal phase-out, how- to 3.84 €cent/kWhth. Fuel costs for solid biomass combustion
ever, the FLH of conventional power plants are continuously also vary depending on the raw material used. In Germany,
decreasing. In this study, the FLH for all new plants will fall biomass cogeneration plants are predominantly operated with
continuously until 2040. For lignite, the average value of FLH in wood chips from forest residues, waste wood, landscape con-
2040 thus falls to below 2000 hours per year and for CCGT to servation wood, and wood pellets (FNR 2020). Due to the vary-
5000. Higher FLH can reduce the LCOE of fossil power plants ing costs, this study considers blended wood of forest wood re-
and vice versa, as the market situation or demand development sidues, landscape wood residues and bark, for which fuel costs
allows it. in the amount of 1.53 €cent/kWhth are incurred. (Fraunhofer
IEE 2019).
Fuel Cost To compare the LCOE of renewable energy technologies and
conventional power plants, assumptions about the efficienci-
Substrate costs vary considerably for biogas power plants. The es and CO2 emissions of these power plants are needed. The
costs differ owing to the options for purchasing substrates or assumptions for the typical power plant sizes are for lignite
using substrates generated by biogas operators inhouse. Ad- between 800 and 1000 MW, for hard coal between 600 and
ditionally, the shares of the various substrates differ between 800 MW, for CCGT power plants between 400 and 600 MW
power plants. For example, a biogas plant commissioned in and for gas turbines 200 MW. Through further technological
2010 in Bavaria uses an average substrate mix of 35% silage improvements, the efficiency of new power plants will increase
maize, 35% cattle slurry/cattle manure, 15% grass silage and for lignite from 45% to 48%, for hard coal from 46% to 49%
15% whole plant silage (DBFZ 2019). Thereby, the methane and for CCGT from 60% to 62%. The price trends for fuels
yield of the individual substrates varies between 106 Nm³/t are assumed with very moderate increases. Due to a possible
FM (ton wet mass) for silage maize (DBFZ 2015) and 12 Nm³/t shortage of CO2 allowances, a long-term increase of the allo-
FM for pig slurry (FNR 2020). Furthermore, different costs are wance price is assumed (see Tables 4-6). CO2 certificate prices
incurred for the substrates. For example, the substrate costs as well as fuel prices reflect a world that pursues greenhouse
for the purchase of maize silage are 39 EUR/t FM (Fraunhofer gas neutrality. This means that energy-related CO2 emissions
IEE 2019) and for cattle and pig slurry 3 EUR/t FM (Guss et al. in Germany will trend quasi towards 0 by 2050. Accordingly,
2016). Substrate costs for self-produced substrate can be assu- the IEA's "Sustainable Development" scenario for fuel prices
med to be near zero. The energy-related costs of the respective was used, which assumes a strong decrease in the consumption
substrates are calculated from the methane yield, the substrate of conventional energy sources. The CO2 certificate price rises
15accordingly for a very high decarbonization to values of 180 to
400
FuelEUR/t
pricesin 2050.
2021 2025 2030 2035 2040
[EUR/MWh]
Lignite 2.0 2.0 2.0 2.0 2.0
Hard coal 10.0 10.0 10.0 10.0 10.0
Natural gas 25.0 25.0 16.0 16.0 17.0
Substrate
38.4 38.4 38.4 38.4 38.4
biogas
Substrate
15.0 15.0 15.0 15.0 15.0
solid biomass
Table 5: Assumptions about fuel prices are based on values (Hecking
et al. 2017; Fraunhofer IEE 2019; IEA 2020)
Efficiency
conventional 2021 2030 2040
power plants [%]
Lignite - electrical 45.0 - -
Hard coal - electrical 46.0 - -
CCGT - electrical 60.0 61.0 62.0
CCGT - thermal 33.0 33.5 34.0
Biogas - electrical 40.0 40.0 40.0
Biogas - thermal 44.0 44.0 44.0
Solid biomass -
25.0 25.0 25.0
electrical
sold biomass -
35.0 35.0 35.0
thermal
Table 6: Efficiency development for large power plants (Wietschel et
al. 2010; Fraunhofer IEE 2019)
CO2 certificate
prices 2021 2025 2030 2035 2040
[EUR/t CO2]
Lower Value 32 40 80 120 150
Upper Value 36 65 120 180 300
Table 7: CO2 certificate price (own assumption)
164. LEVELIZED COST OF ELECTRICITY OF
ENERGY TECHNOLOGIES IN 2021
In this chapter, the LCOE of the renewable energy technologies 11.01 €cent/kWh are reached at locations in northern Ger-
PV, wind, biogas and solid biomass at locations in Germany are many with a GHI of 950 kWh/(m²a). The results depend on
determined using market data on specific investments, opera- the amount of the specific investments, which is assumed to
ting costs and other technical and financial parameters. Refe- range from 1200 EUR/kWp to 1600 EUR/kWp. Larger rooftop
rence calculations for conventional power plants (lignite, hard PV systems (> 30 kWp) can produce electricity at a LCOE bet-
coal, CCGT and gas turbines) with different configurations, ween 4.63 and 7.14 €cent/kWh in southern Germany and
construction and operation strategies provide LCOE values for between 6.34 and 9.78 €cent/kWh in northern Ger-
comparison. many, each with specific investments between
750 and 1400 EUR/kWp. Ground-mounted PV systems
In southern Germany, the LCOE for small PV rooftop sys- (> 1 MWp) currently reach LCOE values between 3.12 and
tems (< 30 kWp) at locations with a global horizontal irra- 4.16 €cent/kWh in southern Germany and between 4.27 and
diation (GHI) of 1300 kWh/(m²a) lies between 5.81 and 5.70 €cent/kWh in northern Germany, with specific installation
8.04 €cent/kWh. LCOE values between 7.96 and costs of 53 EUR/kW to 800 EUR/kW.
Figure 5: LCOE of renewable energy technologies and conventional power plants at different locations in Germany in 2021. Specific system
costs are considered with a minimum and a maximum value per technology. The ratio for PV battery systems expresses PV power output (kWp)
over battery storage capacity (kWh). Further assumptions in Tables 3 to 6.
17The LCOE for PV battery systems refers to the total amount One must keep in mind that the LCOE calculation does
of energy produced by the PV system minus storage losses. not include the possible flexibility of a power generation
The storage losses are calculated based on the capacity of the technology or the worth of the generated electricity. For ex-
battery storage, the assumed number of cycles and the ef- ample, the specific seasonal and daily generation of each tech-
ficiency of the battery. Accordingly, the LCOE for small-scale nology is different. Differences due to the flexible use of power
PV battery systems ranges from 8.33 to 19.72 €cent/kWh. plants or the provision of ancillary services in relation to the
The results include differences in PV costs, battery costs market sales price of electricity obtained are not reflected in the
(500 to 1200 EUR/kWh), and varying solar irradiation. For LCOE (see also Chapter 8).
larger rooftop PV systems with battery storage, the LCOE
ranges from 6.58 to 14.40 €cent/kWh, for battery costs bet-
ween 600 and 1000 EUR/kWh. For ground-mounted PV with Photovoltaics
battery storage systems, LCOE are calculated to be between
5.24 and 9.92 €cent/kWh; for this, investment costs for batte- Market development and forecast
ry storage of 500 to 700 EUR/kWh were assumed. The prices
for smaller systems are in part lower, as these are standardized At the end of 2020, the global installed PV capacity exceeded
products, whereas larger battery systems tend to be individua- 707 GWp with global additions in 2020 amounting to around
lized projects that additionally incur costs for project develop- 127 GWp. This represents a market growth of 30% compa-
ment, project management, and infrastructure. The range of red to the 98 GWp installed globally in 2019 (IRENA 2021a).
investment costs is smaller for the larger sizes, as there is more Currently China dominates the global PV market in both pro-
competitive pressure. duction and installation. At the same time, more countries are
installing PV on a significant scale, as PV systems increasingly
The LCOE of onshore WPP with an average installation cost prevail in free competition and can thus be implemented inde-
of 1400 EUR/kW and a very high annual FLH of 3200 hours is pendent of subsidy programs. The PV market growth is now
3.94 €cent/kWh. However, such locations in Germany are very driven by purely economic reasons.
limited. LCOE in less suitable locations in Germany range up
to a value of 8.29 €cent/kWh, depending on the specific in-
vestment and the annual FLH (see Table 3). In comparison, the
cost of offshore WPP is significantly higher, displaying values
between 7.23 €cent/kWh and 12.13 €cent/kWh, despite higher
FLH of 3200 to 4500 per year.
The LCOE of biogas is between 8.45 and 17.26 €cent/kWh
with substrate costs of 3.84 €cent/kWh. For solid biomass
plants, the LCOE is slightly lower between 7.22 €cent/kWh and
15.33 €cent/kWh, mainly due to substrate costs. For both biomass
and biogas, heat credits, also referred to as revenue from heat
generation, have been subtracted from the LCOE. This means that
the values given here refer only to bioenergy with cogeneration. Figure 6: Market development scenarios of cumulative installed
Plants without heat utilization have significantly higher LCOE. power plant capacity [GW] for PV until 2040, own scenarios.
Based on the current conditions on the electricity market with This leads to the assumption that the global PV market will con-
respect to FLH and fuel prices for each technology, the following tinue to grow strongly. The three market development scenari-
LCOE for conventional power plants are determined: Lignite os “High”, “Medium” and “Low” on which the study is based
power plants built today achieve an LCOE between 10.38 and assume a continuous reduction in annual market growth. The
15.34 €cent/kWh for the selected operation parameters (with assumed market growth in 2021 of 24%, 20% and 18% for
a low CO2 price today and a sharply rising CO2 price in the fu- the "High", "Medium" and "Low" scenarios, respectively,
ture). The LCOE for large hard coal power plants shows slightly flattens out to 5% (High, Medium) and 4% (Low) by 2040.
higher values between 11.03 and 20.04 €cent/kWh. CCGT po- For 2040, the scenarios result in total capacity of 11,100 GW,
wer plants achieve values between 7.79 and 13.06 €cent/kWh, 6700 GW, and 4300 GW, respectively. The scenarios of cumula-
while the LCOE of gas turbines is considerably higher, ranging tive installed power plant capacity are shown in Table 11.
between 11.46 and 28.96 €cent/kWh.
18Performance Ratio of PV systems specified price ranges can be realized under certain conditions
The Performance Ratio is used frequently to compare the ef- of purchase. Compared to the 2018 study, significantly larger
ficiency of grid-connected PV systems at different locations ranges are given for the specific investment. The reasons for this
and with different module types. It describes the ratio of the are due to broader power definition in this study and a market
actual energy yield (final electrical energy) of a PV system development in which the location, design of the plant or the
and its rated power output. The nominal power of a PV sys- roof and building conditions have a strong influence on the
tem is usually expressed in kilowatt peak (kWp) and is based prices of the systems. This leads to a higher variation in specific
on the power of the PV modules in the PV system measured costs.
under Standard Testing Conditions (STC). The actual usable
energy yield of the PV system is influenced by the real ope- The current LCOEs of PV systems are shown in Figure 7 for va-
rating conditions at the system location. Deviations of the rious power plant sizes and costs at different solar irradiation
actual module yield in comparison with STC conditions may (based on Table 3). The number following power plant size
arise for various reasons, such as different solar radiation stands for the global horizontal irradiation (GHI) at the power
values, shading and soiling of the PV modules, reflection on plant location in kWh/(m²a). PV systems in northern Germany
the module surface at oblique incident angles, spectral de- produce approximately 935 kWh/a, while PV systems in sou-
viation from STC conditions, and increasing module tempe- thern Germany yield up to 1280 kWh/a.
rature. Other losses in the PV system are caused by electric
mismatch of modules, resistive losses in the AC and DC wi-
ring, inverter losses and eventual losses in the transformer.
New, optimally oriented PV systems achieve performance
ratios between 80 and 90% in Germany (Reich et al. 2012).
Price and cost development
Since 2018, wholesale prices for crystalline modules in
Germany have fallen significantly from 430 EUR/kWp to
310 EUR/kWp in 2020. The lowest net price for crystalline mo-
dules was 190 EUR/kWp in the third quarter of 2020. There
continues to be a difference between the price levels of Chinese
Figure 7: LCOE of PV systems in Germany based on system type and
and German manufacturers: In 2018, Chinese manufacturers solar irradiation (GHI in kWh/(m²a)) in 2021.
were able to offer their modules at an on average 80 EUR/kWp
lower price than German manufacturers. In 2020, the gap was
only 50 EUR/kWp (EuPD Research 2021). The strong price decline in investment for PV power plants has
continued to lead to significantly lower LCOE. Ground-moun-
The costs for inverters and balance of system (BOS) components ted utility-scale power plants in northern Germany already
like mounting system and cables, as well as their installation achieve a LCOE below 6 €cent/kWh and in the south below
costs, dropped, though not as strongly as PV module prices. 4.5 €cent/kWh respectively. The LCOE of large PV rooftop sys-
While in 2005, solar modules constituted almost 75% of the tems are between 9.78 €cent/kWh in northern Germany and
system costs, this share is around 30% today, even for rooftop 4.63 €cent/kWh in southern Germany. Small PV rooftop sys-
PV systems. tems in Germany generate electricity at LCOE between 5.81
and 11.01 €cent/kWh, and thus are well below the average
Table 1 shows price bands for PV systems of different size clas- electricity costs for households.
ses. The costs for a small PV system (up to 30 kWp) are current-
ly between 1000 and 1600 EUR/kWp. For larger PV systems Since PV still has significant cost reduction potential along the
above 30 kWp, the costs are currently 750 to 1400 EUR/kWp. entire value chain and for all components, it can be expected
PV ground-mounted systems with power outputs starting at that investment costs and thus LCOE will continue to fall in the
1 MWp reach investment costs of 530 to 800 EUR/kWp. These medium and long term - apart from possible price fluctuations
values include all component and installation costs associated due to special market events. Based on the current market de-
with the PV power plant. In some cases, investments below the velopment as well as the warranty offered by most module ma-
19You can also read