Lawrence Berkeley National Laboratory - Recent Work
←
→
Page content transcription
If your browser does not render page correctly, please read the page content below
Lawrence Berkeley National Laboratory
Recent Work

Title
A Plug-Loads Game Changer: Computer Gaming Energy Efficiency without Performance
Compromise

Permalink
https://escholarship.org/uc/item/6g84k0x7

Authors
Mills, Evan
Bourassa, Norman
Rainer, Leo
et al.

Publication Date
2019-04-01

Peer reviewed

 eScholarship.org                             Powered by the California Digital Library
                                                              University of California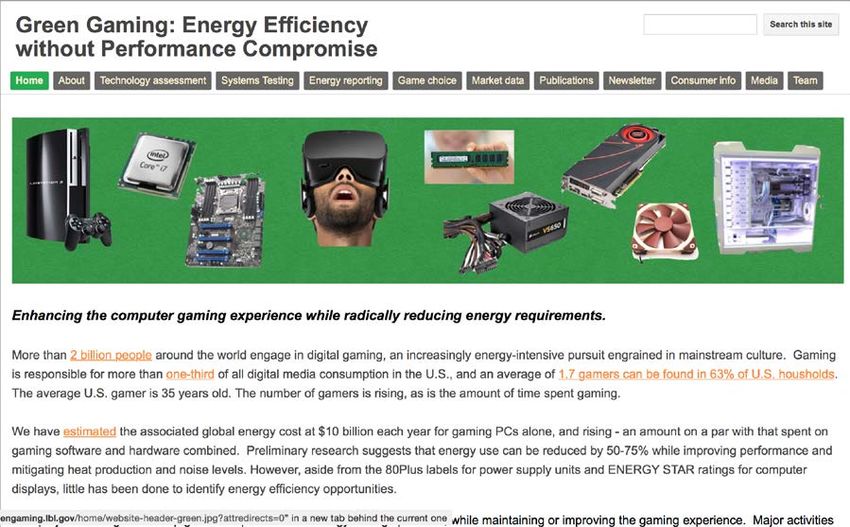
Energy Research and Development Division

       FINAL PROJECT REPORT

       A Plug-Loads Game
       Changer: Computer
       Gaming Energy Efficiency
       without Performance
       Compromise

California Energy Commission
Gavin Newsom, Governor

April 2019 | CEC-500-2019-042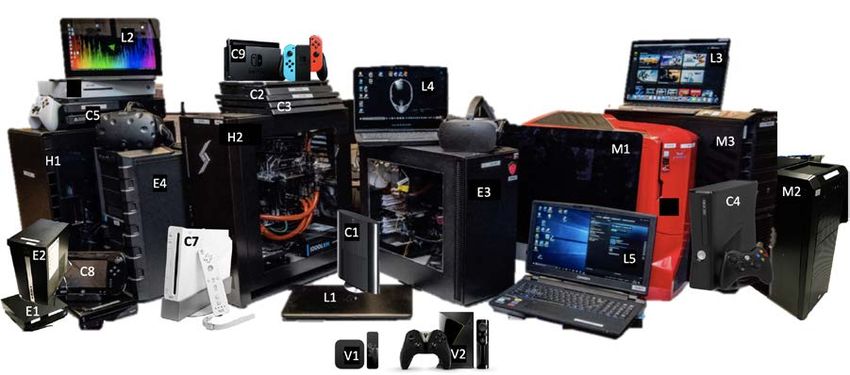
PREPARED BY:

Primary Authors:
 Evan Mills                          Claire Curtin
 Norman Bourassa                     Arman Shehabi
 Leo Rainer                          Louis-Benoit Desroches
 Jimmy Mai                           Nathaniel Mills
 Ian Vaino

Lawrence Berkeley National Laboratory
1 Cyclotron Road
Berkeley, CA 94720
Phone: 510-486-4000 | Fax: 510-486-5454
http://www.lbl.gov

Contract Number: EPC-15-023

PREPARED FOR:
California Energy Commission

Felix Villanueva
Project Manager

Virginia Lew
Office Manager
ENERGY EFFICIENCY RESEARCH OFFICE

Laurie ten Hope
Deputy Director
ENERGY RESEARCH AND DEVELOPMENT DIVISION

Drew Bohan
Executive Director

                                                DISCLAIMER
   This report was prepared as the result of work sponsored by the California Energy Commission. It does
   not necessarily represent the views of the Energy Commission, its employees or the State of California.
   The Energy Commission, the State of California, its employees, contractors and subcontractors make no
   warranty, express or implied, and assume no legal liability for the information in this report; nor does any
   party represent that the uses of this information will not infringe upon privately owned rights. This report
   has not been approved or disapproved by the California Energy Commission nor has the California Energy
   Commission passed upon the accuracy or adequacy of the information in this report.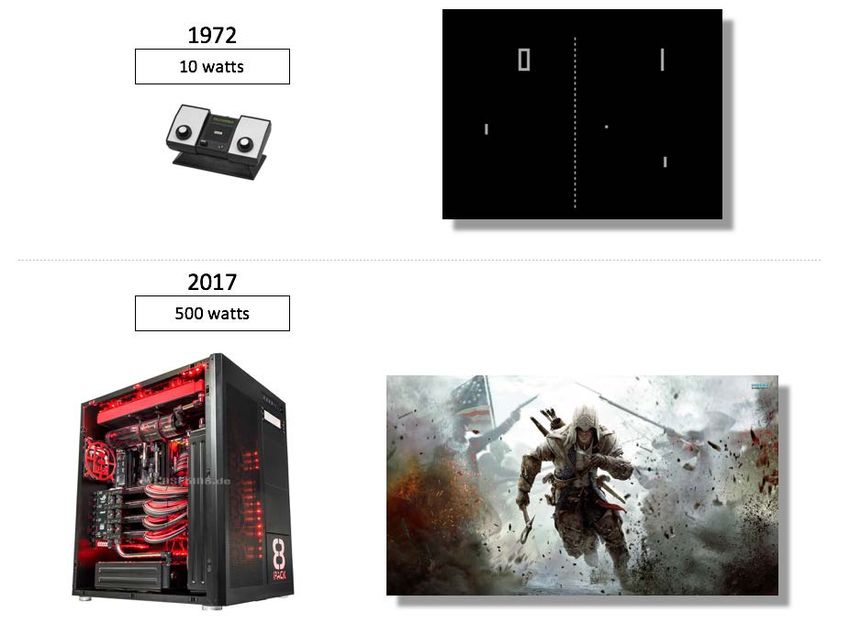
ACKNOWLEDGEMENTS
This project benefitted enormously from engagement with experts from the gaming industry,
other energy researchers, and real gamers. A number of individuals made themselves available
to serve on the Technical Advisory Committee and to provide interviews for the project
newsletter, Green Gaming News. AMD (Donna Sadowy,* Claudio Capobianco,* Scott Wasson,*
and Justin Murrill) and Nvidia (Tom Peterson,* Phil Eisler, Sean Pelletier, Anjul Patney, Nick
Stam, John Spitzer, Luc Bisson, and Sean Cleveland) provided valuable technical input along the
way. Representatives of the console industry, including the Entertainment Software Association
(Michael Warnecke*) and representatives from Sony Interactive Entertainment America,
Nintendo of America, and Microsoft Corp. participated in a project workshop or other
information exchanges. Game developers Nicole Lazzaro* and Bob King, shared insights into
how the coding of games may impact energy use and Tom Bui* (Steam) also provided advice
from a game-distribution vantage point. Consumer-oriented product review experts from Tom’s
Hardware (Fritz Nelson, Joe Pishgar, and Chris Angelini), PC Perspective (Ryan Shrout*), and
eXtreme Outer Vision (Slava Maksymyuk) provided invaluable discussions about energy-per-
performance assessment and consumer decision-making more broadly. The underlying market
research performed by Jon Peddie Research (Ted Pollak) laid important groundwork for the
characterization of the gaming marketplace. Other valuable market information was provided
by Iowa State University (Douglas Gentile), Fraunhofer USA (Kurt Roth), and Statistica (Liisa
Jaaskelainen). Research colleagues at other institutions provided in-depth exchanges about
benchmarking and other technical and market issues, including Jonathan Koomey (Stanford
University), Pierre Delforge* (NRDC), Peter May-Ostendorp (Xergy), Douglas Alexander
(Component Engineering), and Vojin Zivojnovik and Davorin Mista (Aggios). The authors
appreciate interactions with the United States Environmental Protection Agency’s ENERGY
STAR® program early in the project (Verena Radulovic and IFC contractors Matt Malinowski,
Ben Hill, and John Clinger).* Two dozen Lawrence Berkeley National Laboratory employees
volunteered their time to intensively test an array of gaming rigs under various operating
conditions to enable the researchers to measure energy use, performance, and user experience
under real-world conditions. Ian Vaino of Lawrence Berkeley National Laboratory’s Workstation
Support Group generously provided space and support for the green-gaming lab, system
procurement and assembly, and the extensive testing process. Sarah Morgan served as Program
Manager for the project at Lawrence Berkeley National Laboratory. Pierre Delforge, Jonathan
Koomey, Donna Sadowy, Iain Walker, and Michael Warnecke reviewed a draft of this report. The
authors extend special appreciation to Felix Villanueva, the contract manager at the California
Energy Commission, who has been highly supportive of the research process.

* Engaged Technical Advisory Committee members

                                               i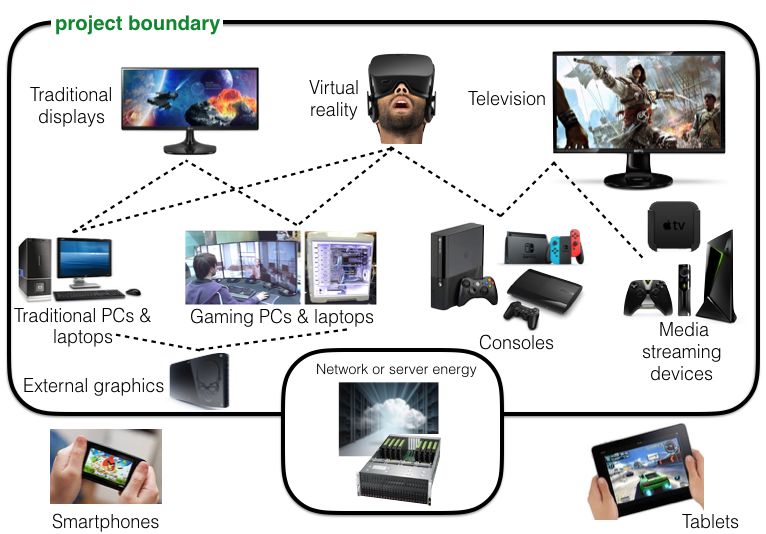
PREFACE
The California Energy Commission’s Energy Research and Development Division supports
energy research and development programs to spur innovation in energy efficiency, renewable
energy and advanced clean generation, energy-related environmental protection, energy
transmission and distribution, and transportation.

In 2012, the Electric Program Investment Charge (EPIC) was established by the California Public
Utilities Commission to fund public investments in research to create and advance new energy
solution, foster regional innovation and bring ideas from the lab to the marketplace. The
California Energy Commission and the state’s three largest investor-owned utilities – Pacific Gas
and Electric Company, San Diego Gas & Electric Company and Southern California Edison
Company – were selected to administer the EPIC funds and advance novel technologies, tools,
and strategies that provide benefits to their electric ratepayers.

The Energy Commission is committed to ensuring public participation in its research and
development programs that promote greater reliability, lower costs, and increase safety for the
California electric ratepayer and include:

   •   Providing societal benefits.

   •   Reducing greenhouse gas emission in the electricity sector at the lowest possible cost.

   •   Supporting California’s loading order to meet energy needs first with energy efficiency
       and demand response, next with renewable energy (distributed generation and utility
       scale), and finally with clean, conventional electricity supply.

   •   Supporting low-emission vehicles and transportation.

   •   Providing economic development.

   •   Using ratepayer funds efficiently.
A Plug-Loads Game Changer: Computer Gaming System Energy Efficiency without Performance
Compromise is the final report for the project by the same name (Contract Number EPC-15-023)
conducted by the Lawrence Berkeley National Laboratory. The information from this project
contributes to the Energy Research and Development Division’s EPIC Program.

For more information about the Energy Research and Development Division, please visit the
Energy Commission’s website at www.energy.ca.gov/research/ or contact the Energy
Commission at 916-327-1551.

                                                  ii
ABSTRACT
Two-thirds of Americans play computer games. Although among the most complex and energy-
intensive plug loads, gaming has been largely overlooked in energy research and development
and policy. Systems used for computer gaming in California consumed 4.1 terawatt-hours/year
in 2016 or $700 million in energy bills, with emissions of 1.5 million tons carbon dioxide-
equivalent allocated 66 percent to consoles, 31 percent to desktop personal computers, 3
percent to laptops, and less than 1 percent to emerging media streaming devices. Key findings
include:

   •   Aggregate energy demand places gaming among the top plug loads in California, with
       gaming representing one-fifth of the state’s total miscellaneous residential energy use.

   •   Market structure changes could substantially affect statewide energy use; energy
       demand could rise by 114 percent by 2021 under intensified desktop gaming, or fall by
       24 percent given a major shift towards consoles coupled with energy efficiency gains.

   •   Unit energy consumption is remarkably varied across gaming platform types: across 26
       systems tested, client-side electricity use ranged from 5 to more than 1,200 kWh per
       year, reflecting equipment choice and usage patterns.

   •   Some emerging technologies and activities are driving energy demand higher, including
       processor overclocking, cloud-based gaming, higher-resolution connected displays, and
       virtual reality gaming.

   •   User behavior influences gaming energy use more than technology choice; duty cycle
       and game choice are particularly strong drivers of demand.

   •   Energy efficiency opportunities are substantial, about 50 percent on a per-system basis
       for personal computers and 40 percent for consoles if past rates of improvement
       continue.

While simultaneously quantifying efficiency and gaming performance is problematic, evidence
suggests that efficiency can be improved while maintaining or improving user experience.
Familiar energy policy strategies can help manage gaming energy demand, although mandatory
system-level standards are not promising (component-level measures may be).

Keywords: energy efficiency, residential, computer gaming, data centers, virtual reality

Please use the following citation for this report:

Mills, Evan, Norman Bourassa, Leo Rainer, Jimmy Mai, Claire Curtin, Ian Vaino, Arman Shehabi,
      Louis-Benoit Desroches, and Nathaniel Mills. University of California, Lawrence Berkeley
      National Laboratory. 2019. A Plug-Loads Game Changer: Computer Gaming System
      Energy Efficiency without Performance Compromise. California Energy Commission.
      Publication Number: CEC-500-2019-042.

                                                     iii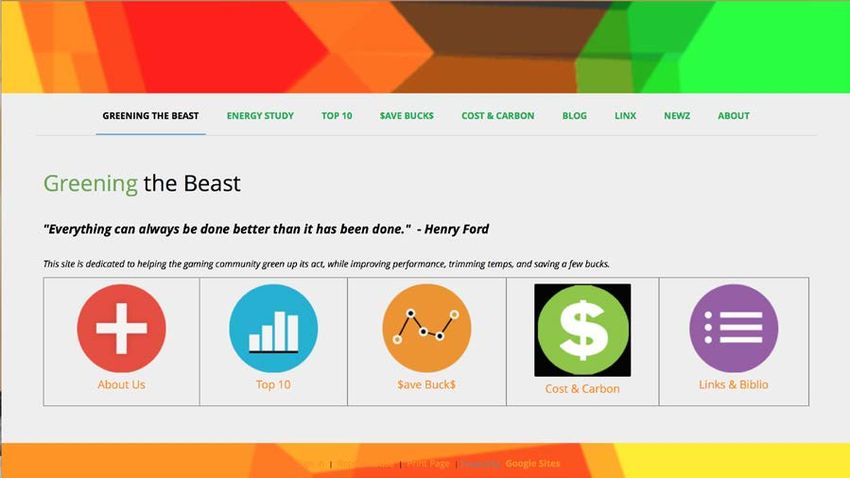
TABLE OF CONTENTS
                                                                                                                                                               Page

ACKNOWLEDGEMENTS ................................................................................................................................... i

PREFACE ............................................................................................................................................................ ii

ABSTRACT ....................................................................................................................................................... iii

TABLE OF CONTENTS .................................................................................................................................. iv

LIST OF FIGURES ............................................................................................................................................ vi

LIST OF TABLES............................................................................................................................................. vii

EXECUTIVE SUMMARY ...................................................................................................................................1

CHAPTER 1: Why This Report Is Important .......................................................................................... 10

   Computer Gaming: A Largely Overlooked Use of Energy .................................................................. 10
   The Most Complicated Plug Load ........................................................................................................... 12
   A Highly Energy-intensive Plug Load ..................................................................................................... 12
CHAPTER 2: Energy Dimensions of the Gaming Marketplace ......................................................... 13

   Market Segmentation and Installed Base .............................................................................................. 13
   User Behavior and Duty Cycle ................................................................................................................. 15
   Online and Cloud-based Gaming ............................................................................................................ 16
   Consumers’ Information Environment .................................................................................................. 17
CHAPTER 3: The Challenges of Measuring and Benchmarking Gaming Energy Use ................ 18

   Measurement ............................................................................................................................................... 18
   Assessing Energy Use in Light of User Experience ............................................................................. 20
CHAPTER 4: Energy Use Across the California Installed Base of Gaming Devices ................... 23

   Power Requirements at the Individual System Level ......................................................................... 23
   The Energy-vs-Frame-Rate Nexus ........................................................................................................... 31
   Unit Energy Consumption ........................................................................................................................ 32
CHAPTER 5: Opportunities for Gaming Energy Savings ................................................................... 40

   Hardware Efficiency Measures for Desktop PCs ................................................................................. 40
   Software, Operational Choices, and Other User Behaviors ............................................................... 41
   Efficiency Opportunities for Consoles .................................................................................................. 46
   Real-time Energy Feedback to Gamers .................................................................................................. 47

                                                                                   iv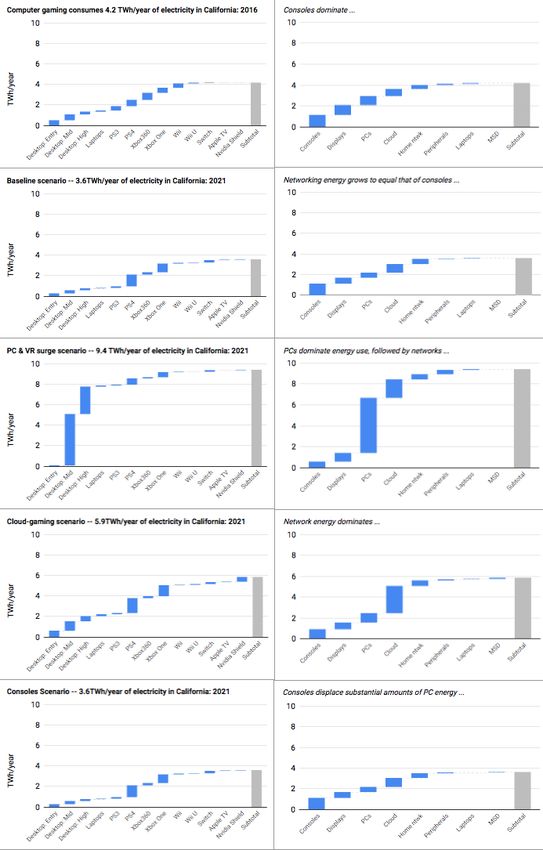
Non-energy factors .................................................................................................................................... 47
CHAPTER 6: Statewide Energy Demand and Projections .................................................................. 50

   Past and Present Structure of Demand ................................................................................................. 52
   Baseline Scenario: 2021 ............................................................................................................................ 54
   Energy Efficiency Opportunities: 2021 .................................................................................................. 54
   Alternate Baseline Scenario 1 – Surge in High-fidelity Desktop Gaming and Virtual Reality:
   2021 .............................................................................................................................................................. 54
   Alternate Baseline Scenario 2 – Strong Shift Towards Cloud-based Gaming: 2021 .................... 54
   Alternate Baseline Scenario 3 – Some PC Gamers Switch to Consoles: 2021................................ 55
   Gaming Energy Futures for California ................................................................................................... 55
   Cost of Ownership, Statewide Energy Expenditures, and Greenhouse-gas Emissions ............... 60
CHAPTER 7: Policy and Planning Pathways for Achieving Greener Gaming .............................. 62

   Market Tracking and Demand Forecasting ........................................................................................... 64
   Consumer Information and Tools .......................................................................................................... 64
   Engagement with The Game-development Industry .......................................................................... 65
   Voluntary Game Ratings ........................................................................................................................... 66
   Voluntary System Ratings ........................................................................................................................ 66
   Voluntary Component Ratings ................................................................................................................ 67
   Mandatory Standards and Ratings ......................................................................................................... 67
   Cloud-based Gaming ................................................................................................................................. 68
   Broader Applications of Gaming-grade Computers and Componentry ......................................... 69
CHAPTER 8: Technology Transfer: From the Lab to the Marketplace........................................... 70

CHAPTER 9: Emerging Research Questions .......................................................................................... 74

   Market Issues .............................................................................................................................................. 74
   Technology Issues ...................................................................................................................................... 75
CHAPTER 10: Conclusions ......................................................................................................................... 76

GLOSSARY ...................................................................................................................................................... 78

REFERENCES ................................................................................................................................................... 80

APPENDIX A: Gaming Systems Evaluated in this Study .................................................................. A-1

                                                                                    v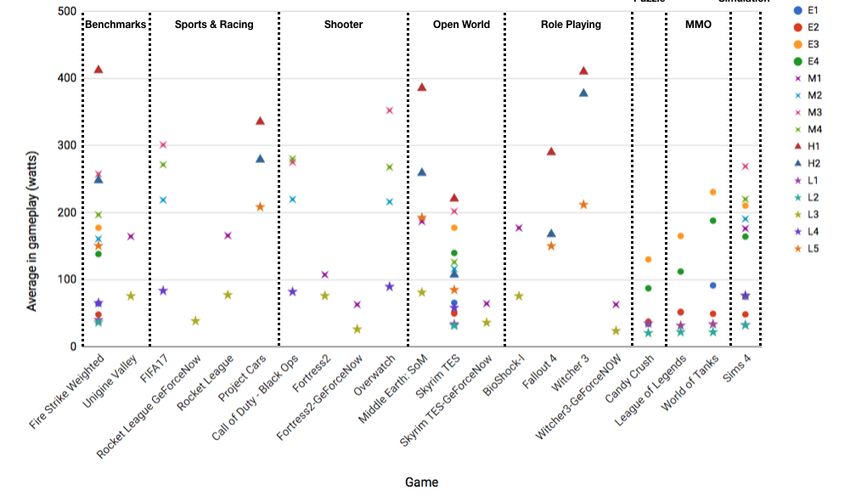
LIST OF FIGURES
Figure ES-1: Evolution of Gaming Equipment, User Experience, and Power Requirements..............1
Figure ES-2: Boundary Conditions for Technology Included in This Study .........................................3
Figure ES-3: Baseline Systems: Desktops, Laptops, Consoles, and Media Streaming Devices..........4
Figure 1: Computer Gaming Consumes More Electricity in California Than Many Familiar
Residential Uses...................................................................................................................................... 11
Figure 2: Installed Base by User Type for All Platform Types (2016) ................................................. 14
Figure 3: Duty Cycle by User Type: Personal Computers, Consoles, Media Streaming Devices,
Displays: 2016 ......................................................................................................................................... 15
Figure 4: Rapidly Escalating Global Online Gaming Throughput ........................................................ 16
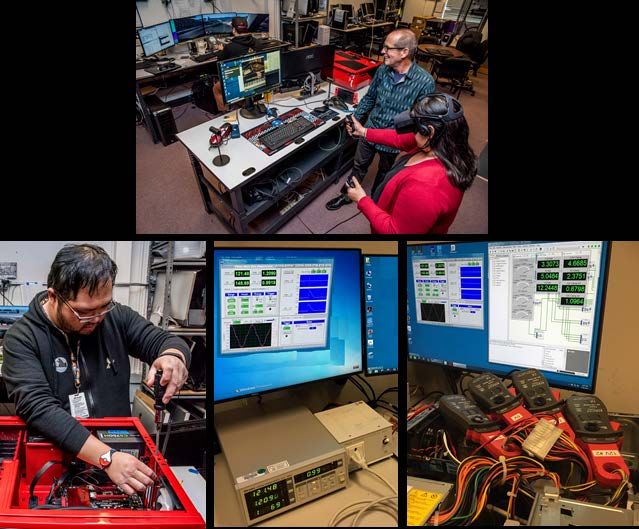
Figure 5: Green Gaming Laboratory and Test Equipment ..................................................................... 18
Figure 6: Factors Affecting Gaming Performance and User Experience ............................................ 22
Figure 7: Average System Power During Gaming and Non-gaming Modes: 2016 ............................ 24
Figure 8: Measured Taming Desktop Component Loads: The Role of Components Varies
Significantly Depending on Duty Cycle and Product Tier ............................................................. 25
Figure 9: Personal Computer Power in Gameplay Does Not Vary by Genre: 19 Popular Personal
Computer Games .................................................................................................................................... 27
Figure 10: Console and Media Streaming Device Power in Gameplay Does not Vary by Game
Genre: 21 Popular Console Games ..................................................................................................... 29
Figure 11: Gaming power for Skyrim TES Varies 21-fold (from 11-221 watts) ................................ 29
Figure 12: Frame rate Does Not Correlate with PC Power: Laptop and Desktops ........................... 32
Figure 13: Baseline Unit Energy Consumption for Desktops by User Type and Duty Cycle ......... 33
Figure 14: Baseline Unit Energy Consumption for Laptops by User Type and Duty Cycle ........... 34
Figure 15: Baseline Unit Energy Consumption for Consoles by User Type and Duty Cycle.......... 35
Figure 16: Gaming is One of the Highest Energy-using Plug Loads .................................................... 36
Figure 17: Network and Cloud-gaming Energy is Often More Than Half of Total Electricity Use:
2016 Conditions ..................................................................................................................................... 39
Figure 18: Dual-Graphics Processing Unit System Draws Substantially More Gaming Power and
with Lower Frame Rates than Single-Graphics Processing Unit System, and More Still in 4k
.................................................................................................................................................................... 41
Figure 19: Virtual Reality Foveated Rendering Gradient Lowers Gaming Power >30 percent ...... 42
Figure 20: Test Results for Specific Energy Efficiency Measures ........................................................ 43
vi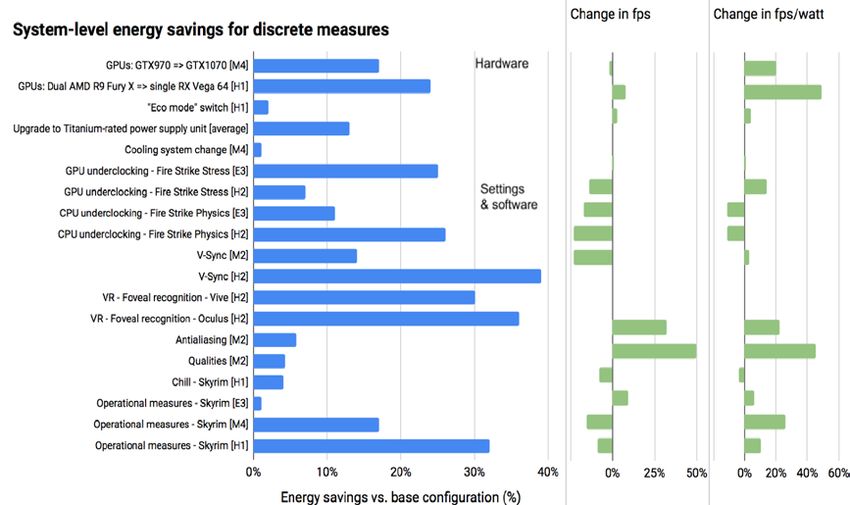
Figure 21: Efficiency Improvements for Three Tiers of Desktop Systems ........................................ 45

Figure 22: Enormous Potential Variations in California Computer Gaming Energy Demand
    Driven by Market Structure, User Behavior, and Energy Efficiency: 2011-2021 ....................... 50

Figure 23: Structure of California Gaming Energy Use: 2016 .............................................................. 53

Figure 24: Consoles or PCs Dominate Energy Demand, Depending on Scenario............................. 56

Figure 25: The “Intensive” User Type is the Dominant in Most Cases and Scenarios .................... 57

Figure 26: California 2021 Scenarios: Systems (left) and Categories (right) ..................................... 59

Figure 27: Green Gaming Website for Technical Audiences ................................................................. 70

Figure 28: Greening the Beast Website for Consumers ......................................................................... 71

                                                            LIST OF TABLES
Table 1: Annual California Energy Consumption, Expenditures, and Emissions for Computer
    Gaming...................................................................................................................................................... 61

                                                                                 vii
EXECUTIVE SUMMARY
Introduction
California has a long history of commitment to a wide variety of energy mandates, policies,
programs, and actions to make new and existing buildings more energy efficient. Increased
energy efficiency benefits the state’s citizens by reducing energy use and costs, lowering
greenhouse gas emissions, and avoiding the need for new power plants to meet California’s
energy demand.
Plug loads – items plugged into electrical outlets by the user – are one of the fastest growing
sources of energy demand in residential and commercial buildings. Depending on how plug
loads are defined, they can represent almost a third of household energy use in California
today, making them a key element in the state’s actions to increase building energy efficiency.
A relatively new contributor to plug loads is computer gaming, defined in this report as gaming
on computers, video game consoles, or media streaming devices. While Pong and other simple
games in the 1970s ran on machines drawing about 10 watts of electricity, today’s high-
performance gaming computers are among the most energy-intensive residential plug loads in
use and can draw many hundreds of watts (Figure ES-1)
Figure ES-1: Evolution of Gaming Equipment, User Experience, and Power Requirements
Source: Lawrence Berkeley National Laboratory
California is arguably the epicenter of computer gaming, with deep roots in gaming technology,
software innovations that enable the development of increasingly powerful games, and
networks that carry vast amounts of data used for cloud-based games. The state is on the
cutting edge as the home of leading component manufacturers in central processing units (Intel
and AMD), graphics processing units (NVIDIA and AMD), power supplies (Corsair), virtual reality
1headsets (Oculus/Facebook), and gaming personal computer assemblers and system integrators
(Digital Storm). The two top game development studios (Activision Blizzard and Electronic Arts)
are also located in California. Californians are particularly avid gamers, and have somewhat
higher rates of gaming system ownership than most other parts of the country.
The rise in gaming energy use drives demand for electricity throughout the state, which in turn
boosts consumer energy bills as well as the indirect costs of energy embodied in local air
quality and climate change impacts. While the efficiency of gaming components is improving,
overall energy use remains constant or increases as the result of growing numbers of gamers,
time spent in gameplay, and demand for an increasingly (and energy intensive) vivid and
immersive user experience. However, despite its significant energy use and the potential for
energy efficiency improvements, gaming has been almost entirely overlooked in energy
research and development, policy, and planning.
The full extent of energy use by computer gaming has been largely a mystery, reinforced by its
being statistically rolled in with undefined “other” uses of energy. Private industry has made
strides in raising energy efficiency for particular products, but has not provided a
comprehensive view of the scale of energy demand from gaming products or how it might
evolve in the future. In addition, the existing literature on gaming energy use focuses almost
exclusively on game consoles. Only one formal study (now dated) has looked in depth at
gaming on desktop computers, and no work had been published regarding gaming on laptops
or with emerging television-linked media-streaming devices such as Apple TV or Android TV,
which are also used for gaming. Neither has the energy used in associated networks and data
centers for cloud-based gaming been quantified. There is also no analysis of the energy use of
many specific supplementary components, such as virtual reality equipment, high-end displays,
and external graphics processing unit docks. The effect of another key driver on energy use—
game choice—has only been examined for one brand of consoles. The duty cycle (the
proportion of time during which a device is operated) unique to gamers has also not been well-
characterized, and the open literature does not describe the sensitivity of gaming energy use to
user behavior (for example, hours spent gaming).
Additional data is needed to enable the California Energy Commission and others to better
understand gaming as a driver of energy demand and to improve energy efficiency in computer
gaming as part of well-established broader strategies for managing that demand.
Project Purpose
This project meets the need for additional data by characterizing the California gaming
marketplace (technology and user behavior), defining baseline energy use and savings
opportunities in light of emerging technologies, and identifying policy strategies and
recommended actions for energy planners.
Using existing data and new measurements and drawing together the lines of data, the
researchers developed a comprehensive set of energy use estimates at the individual system
level and in the aggregate for California. These estimates provide insight into the drivers of
demand and will be useful for industry, policymakers, utilities, and consumers.
2By filling the voids in the existing knowledge base, this project provides a novel energy-relevant
assessment for California. A key overarching premise is to identify energy efficiency
opportunities that further the state’s energy and environment goals without compromising the
gaming experience in ways that would impede adoption of improved equipment and practices.
Project Approach
The researchers’ focus in this project was on a complex energy-using activity rather than a
single energy-using device. Gaming systems are multi-function devices that perform gaming as
well as other tasks for their owners. The researchers considered all grid-connected devices used
for gaming and their displays, but did not address gaming on primarily mobile devices (Figure
ES-2). The project team also considered energy use within data centers hosting gaming
workload (cloud-based gaming) together with the networks connecting them to gamers.
Figure ES-2: Boundary Conditions for Technology Included in This Study
Source: Lawrence Berkeley National Laboratory
The researchers drew from Lawrence Berkeley National Laboratory staff expertise across several
groups, departments, divisions, and major research areas. The project team also retained
leading gaming market researchers (Jon Peddie Research), and assembled a Technical Advisory
Committee representing industry (AMD, NVIDIA, the Entertainment Software Association),
national policymakers (United States Environmental Protection Agency/ENERGY STAR®), and
other stakeholders.
The researchers consulted with industry actors such as game developers and consumer product
evaluators (PC Perspective, Hardware Canucks, Tom’s Hardware, eXtreme Outer Vision, and Bob
3King), other researchers and institutes (Fraunhofer USA, Stanford University, Xergy), and non-
governmental organizations (Natural Resources Defense Council). During project start-up the
team held a workshop with leaders in the console industry (Microsoft, Nintendo, and Sony) to
introduce the research plan and solicit feedback. Researchers consulted the Technical Advisory
Committee, offered review drafts of key documents, and considered feedback in preparing
work products.
Early in the project, the researchers developed a detailed description of the California gaming
marketplace including hardware, software, types of users, and other drivers of the duty cycle.
The researchers developed test procedures and established a Green Gaming Systems Test Lab
at LBNL for analyzing the representative gaming devices and associated settings and software
variables, and created a data-acquisition system to aggregate and analyze the large volumes of
information collected.
The research team evaluated 26 gaming systems (10 personal computers, 5 laptops, 9 consoles,
and 2 media streaming devices) representing the range of systems found in the installed base
and on the market circa 2016 (Figure ES-3). The research incorporated componentry
representing a cross-section of major manufacturers. Bench testing included various
combinations of systems, and 37 popular games.
Figure ES-3: Baseline Systems: Desktops, Laptops, Consoles, and Media Streaming Devices
System ID codes (C1, L1, and so on) can be cross-referenced to more technical information in Appendix A.
Source: Lawrence Berkeley National Laboratory
The researchers extensively reviewed emerging technologies that may shape energy demand in
the future, as well as commercially available technologies and techniques for potentially
improving energy efficiency, including high-resolution 2D displays, virtual reality headsets,
external graphics card “docks” fitted to laptops, and a range of software. Promising strategies
currently available in the market were implemented on selected base systems and retested to
determine savings. The team did not estimate the potential of future technologies yet to be
commercialized.
4The key barriers encountered during the project included the lack of an existing testing
protocol and the enormous variety of equipment, software, and user types that comprise the
market. Drawing on the team’s expertise, researchers captured a “snapshot in time” to
characterize the market landscape. While the tests conducted represent only a sampling of the
large combination of variables that influence gaming energy use, they do bracket the many
factors that shape energy use in this complex and rapidly changing marketplace.
Project Results
At a high level, the researchers found an enormous range in energy use among various
platforms driven as much by technology “family” (consoles versus desktops) as by gaming
behavior (hours in gameplay). While there are far fewer desktop and laptop gaming systems
than consoles in the installed base, their higher per-unit consumption makes them a significant
portion of overall statewide energy consumption, particularly under certain future market
scenarios. These variations are amplified by the role played by game choice.
Researchers were surprised by some project findings, including the dominance of consoles in
overall energy use, the impact of user behavior on outcomes, the large energy requirements of
cloud-based gaming, the significant energy efficiency gains made through the industry’s own
initiative (many through software rather than hardware), and the problematic obstacles to
applying standards as an energy savings policy strategy.
Other notable findings from the research include:
• Gaming is among the top plug loads in California. In 2016, California computer gaming
used 4.1 terawatt-hours per year of electricity, representing $700 million of annual
energy costs and 1.5 million tons carbon dioxide-equivalent emissions, or one-fifth of all
residential “miscellaneous” electricity use. Of the total energy consumed in 2016 by
computer gaming equipment, 66 percent was for consoles, 31 percent for desktop
computers, 3 percent for laptops, and less than 1 percent for emerging media streaming
devices. Electricity use equated to 5 percent of overall statewide residential
consumption among the investor-owned utilities, or the equivalent of about 10 million
new refrigerators that use 400 kilowatt-hours per year. Gaming mode is responsible for
41 percent of statewide client-side energy use for consoles, 32 percent for desktop PCs,
29 percent for laptops, and 7 percent for media streaming devices based on time used.
• Changes in market structure can have huge impacts on statewide energy use. Despite
the increase in gaming devices, customer energy demand was roughly constant between
2011 and 2016 as customers shifted from desktops to less energy-intensive consoles.
Alternate scenarios of market share and gamer activity projected to 2021 suggest
baseline energy consumption could increase 114 percent or decrease by 24 percent
compared to 2016 demand based on certain drivers and consumer choices. In future
scenarios, as much as 27 percent of total gaming energy used shifts to the Internet and
data centers.
• Energy consumption per unit varies widely across gaming platform types and by
game choice. Across individual systems and game titles, average power during
5gameplay varied from 34 watts to 410 watts for desktop computers, 21 watts to 212
watts for laptops, and 11 watts to 158 watts for consoles. The two media streaming
devices used similar amounts of power, under 2016 conditions
• Non-gaming power requirements for PCs and consoles are within the same order of
magnitude, with a good degree of overlap although consoles use less power in this
mode on average than desktop PCs, but more in most cases than laptop PCs.
• Energy use while gaming on a given gaming platform varies considerably depending on
game choice: by up to 3.5-fold among various games on PCs and by up to 1.6-fold on
consoles (with no apparent correlation between game genre and energy use).
• Energy use while gaming for a given game varies by 8-fold and 21-fold of the two games
playable on the widest range of platforms in the sample.
• Unexpected spikes in PC power during idle mode 1 corresponded to an average of 9
percent of total energy use above that of the expected idle state across all systems (up
to 55 percent on one system). This suggests a need for more realistic test procedures.
The research team did not observe similar patterns for consoles.
• Energy used by the GPU ranges from 45 to 77 percent of the total in gaming mode, and
is surprisingly significant in idle mode as well (12 to 33 percent of the total).
Some emerging technologies and activities are driving energy demand higher.
• Cloud-based gaming (with graphics processing in data centers) has more energy
“overhead” than local gaming, adding about 300 watts atop local power requirements
for console-gaming and 520 watts for PC and media-streaming-device gaming.
• Cloud gaming adds approximately 40 to 60 percent to the otherwise total local annual
electricity use for desktops, 120 to 300 percent for laptops, 30 to 200 percent for
consoles, and 130 to 260 percent for media streaming devices.
• Virtual reality can be a very energy-intensive emerging technology, with 38 percent
higher system energy use in some cases and 15 percent less in others. When left on
continuously, the peripheral virtual reality sensors appreciably contribute to overall
energy use.
• 4k displays result in significant increases in energy (25 to 64 percent) used by PCs while
gaming, with reductions in frame rate, resulting in reduced energy efficiency. Consoles
have also shown to exhibit significant power increases across the duty cycle.
User behavior has a stronger influence on gaming energy use than technology choice.
• Duty cycle and game choice are strong drivers of demand.
• While the lightest gamers considered in the study game only about 10 minutes per day,
others game 7 hours per day.
1
All idle measurements made in using the “short-idle” test procedure.
6Energy efficiency opportunities are substantial.
• Packages of commercially available efficiency improvements (hardware, BIOS, and
software) offer a ~50 percent energy savings in PCs (in both gaming and non-gaming
modes of operation). For example, improved graphics cards reduce the amount of power
required to render games and improved power management reduces loads when not
gaming). If maintained, the observed historic rate of improvement in consoles would
reduce per-system consumption by about 40 percent between 2016 and 2021.
• Strategies for improving virtual reality efficiency can lower energy use by ~30 percent.
• Power management is quite poor on most PC gaming systems, including idle mode, and
the componentry is not yet supportive of energy reporting as a means of user feedback.
• While simultaneously evaluating efficiency and performance is a highly problematic
undertaking, the evidence suggests that energy efficiency can be improved without
apparent reduction in user experience, although user experience is highly subjective and
resistant to quantification.
• User behavior (for example hours in gameplay, overclocking, game choice, in-game
settings) has a stronger influence on gaming energy use than technology choice.
• Frame rates don’t correlate with power; high performance doesn’t require high power.
• Significant non-energy benefits accrue from many energy efficiency strategies.
The gaming marketplace is in constant flux, including powerful technology developments
shaping the installed base of equipment and the preferences and behaviors of gamers in a state
of perpetual change. These factors directly influence the energy intensity of individual systems
as well as in the aggregate.
Between 2011 and 2016, a shift to a less energy-intensive mix of gaming products in the
marketplace and improvements in display efficiency offset the growth in electricity demand
that would have occurred due to increasing numbers of systems in the installed base. However,
actual gaming electricity demand fell considerably as a result of significant reductions in the
electricity intensity of internet infrastructure which lowered energy use for video streaming.
Energy savings opportunities can be captured through a combination of initiative from within
the industry, consumer choices, and the energy policy and R&D community.
Technology/Knowledge Transfer/Market Adoption
Technology transfer was integral to the project approach. Key audiences included utilities,
researchers, policymakers, gaming industry representatives, and consumers. Defined in terms
of current energy use by 15 million gaming systems in California, two thirds of the current
market is comprised by console users with the remaining being PC users.
7The approaches included formal publications, newsletters, websites, convening stakeholders,
engagement in industry activities, and media outreach (Mills 2018). All project activities have
been described on one public-facing website for technical audiences
(http://greengaming.lbl.gov) and another for consumers (http://greeningthebeast.org).
LBNL’s work in this area received considerable mainstream and trade media coverage prior to
and during the EPIC project period. 2 Coverage included Forbes, Grist, Newsweek, R&D Magazine,
Science Daily, Slate, and Wired. LBNL produced news releases at the project outset and
conclusion, and a 15-minute interview was broadcast on BBC radio near project completion.
Results were disseminated through the TAC and one-on-one contacts with industry and other
stakeholders at trade meetings and other venues. One consumer information provider included
the research team’s analyses in their web-based decision tool aimed at consumers. The
Consumer Electronics Association, through reports prepared for them by Fraunhofer USA,
expanded their market survey work to incorporate PC gaming.
The technology transfer process was used to disseminate the testing protocol development. As
part of this strategy, researchers engaged with energy policy agents such as ENERGYSTAR® for
whom standardized energy-efficiency measurement techniques are essential. That said, because
most aspects of the user experience and “energy services” provided by gaming systems are not
directly measurable, and thus simple quantitative energy-per-performance metrics cannot be
articulated beyond frame rates per unit power, which is too crude for standards-setting.
Broad-based uptake of “energy thinking” in the gaming marketplace, and among gamers
themselves, is a long-term challenge that cannot be addressed by a single project or report. The
team made concerted attempts to convene sessions at two of the industry’s annual Game
Developers Conferences (GDC) without success. Attempts to collaborate with third-party
information providers that help gamers specify and build do-it-yourself systems were also
largely unsuccessful. Energy efficiency is not a high priority in the minds of most gamers and
there is no unified initiative within the industry (although there are many individual efforts).
Early experiences with disseminating energy information directly to gamers were met with a
degree of skepticism and disinterest. If gaming energy issues become more widely known and
appreciated, the marketplace should grow more receptive to the information.
The researchers explored whether the providers of the underlying software used to develop
games would be receptive to various forms of collaboration, such as integrating consideration
of energy-oriented metrics into the game-design process. Interest in this group is nascent.
Benefits to California
The introduction of a gaming device into a home can significantly increase energy costs. For the
most avid gamers, the associated energy bills can amount to hundreds of dollars each year,
particularly at a household level where multiple users and systems are in use. At the marginal
electricity prices actually paid by households, the high-end tier of desktop PCs cost light
gamers about $550 and extreme gamers $1,700/year to operate over the product’s life. This is
2
http://greengaming.lbl.gov/media.
8in some cases more than the initial purchase cost of the gaming system. Best practices can
reduce these values by half. Conversely, significant traditional efforts to reduce a home’s
energy use (for example, improved appliances) can easily be offset or otherwise thwarted by
unaddressed computer-gaming energy.
The study identifies many readily available technologies and practices that can be adopted by
consumers, and the implications of user choices among gaming platform families as well as
discretionary in-game and system-level settings. Many of the results point the way to promising
longer-term avenues for future R&D (in partnership with industry) and more accurate
approaches to energy demand forecasting.
Computer gaming in California consumed 4.1 TWh/year in 2016 at an energy cost of $700
million, with emissions of 1.5 million tons CO2-equivalent. These amounts could more than
double under a near-term evolution of market structure. Conversely, the energy savings
opportunity for the measures considered is on the order of 50 percent for the desktop systems
and 40 percent for consoles. Overall savings will also depend heavily on efficiency
improvements in displays, networks, data centers, and energy efficient design principals in the
development of games themselves, and well as user behavioral choices.
Although many methods of achieving energy savings are accessible in today’s marketplace,
realizing the energy savings opportunities identified in this report is an enormous challenge,
particularly given the complexity of the computer-gaming energy end use. While remarkable
technological progress is being made within the gaming industry, the continual rise in
consumer expectations regarding user experience tends to offset these gains, particularly for
desktop and laptop PCs. The shift of energy to networks and data centers promises to further
obscure the energy cost of gaming. Consumer awareness of energy considerations is minimal,
and there is often resistance to the subject, based in part on misperceptions that high efficiency
and high performance are mutually exclusive. Thus, new efforts to improve awareness and
provide decision-support tools to gamers are an essential complement to R&D.
9CHAPTER 1:
Why This Report Is Important
Household electric plug loads are loosely defined as the residual segment of energy use that
remains aside from core uses such as space conditioning, water heating, cooking, laundry, and
lighting. Depending on the definition, miscellaneous plug loads 3 represent almost a third of
household energy use in California today, and a far larger proportion of energy use in otherwise
highly energy efficient homes.
Computer gaming, 4 a little-discussed plug load, is a major social and technological
phenomenon, engaged in by a third of humanity. California is a major global hub for the
computer gaming industry. The associated energy use is among the most significant of all plug
loads. The issue has been understudied, and it has been passed over in most energy R&D,
policy, and planning initiatives.
Computer Gaming: A Largely Overlooked Use of Energy
Energy researchers have long recognized the importance of miscellaneous uses of electricity,
often referred to as “plug loads” (Meier et al., 1992). Consumer electronics have emerged as a
particularly important type of plug load (Rosen and Meier 2000). Lacking good accounting,
energy used by plug loads can remain uncounted for altogether or incorrectly attributed to
other end-uses. Quantifying the energy use of plug loads is an elusive challenge, by simple
virtue of their number, dynamism in the markets that drive them, and the particularly heavy
role of user behavior in determining the associated energy use.
Computer gaming, is perhaps the most extraordinary instance of this challenge, as it comprises
a myriad of platforms and use cases, in turn tempered by the consumer’s time spent gaming,
choice of software, as well as settings within the application during gameplay. Game consoles
have received some attention, but desktop and laptop computers used for gaming have only
recently come into focus (Mills and Mills 2015). The implications of a new wave of media
streaming devices that deliver gaming content based on workloads shifted to networks and
data centers have not been quantified at all. The misperception that computer gaming is
conducted only at the “fringe” of society has dampened curiosity about their role in energy use.
In this study, the researchers estimate that the entire category of computer gaming (all devices,
displays, associated network, energy, and so on) represent about a fifth of miscellaneous
3
Statewide residential electricity energy use among investor-owned utilities was 77.4 TWh in 2015 – see
http://www.energy.ca.gov/contracts/GFO-15-310/12-Attachment-12-Energy-Efficiency-Data_2015-11-10.xlsx.
4
The researchers adopted the term “computer gaming” to describe gaming on computers, video game consoles, or
media streaming devices used for gaming. The terminology is inconsistently used in this industry. In some documents,
“computer” gaming refers only to PCs, while “video” gaming refers only to gaming on consoles, but in many cases the
terms are used interchangeably. The team adds references to specific platform types where a distinction is being made
in the data or discussion. Note that our analysis does not include mobile gaming on predominantly or exclusively
battery-powered devices such as tablets and smartphones.
10electricity use in California households (Figure 1). The “Computer Gaming” category includes
multiple device types including desktop and laptop computers, consoles, and media streaming
devices and associated displays, local network equipment, and speakers, as well as associated
network and data-center energy. Values shown for Color TV are net of the estimates for their
use while operating the gaming devices, and the Miscellaneous total is net of Computer Gaming.
Gaming estimate for 2016; other end uses are estimates for 2015. See
http://www.energy.ca.gov/contracts/GFO-15-310/12-Attachment-12-Energy-Efficiency-
Data_2015-11-10.xlsx.
Figure 1: Computer Gaming Consumes More Electricity in California Than Many Familiar
Residential Uses
Source: Lawrence Berkeley National Lab
As is the case for plug loads more broadly, little attention has been paid to developing policies
and programs to achieve more energy efficient computer gaming. The two exceptions in the
United States are the highly successful 80 Plus program for voluntarily labeling power supply
unit energy efficiency and the ENERGY STAR® voluntary labeling program for computer
displays. Neither of these are particularly targeted at gaming or address the most energy
intensive components within video-gaming systems or the systems as a whole, or the enormous
vacuum in useful consumer information. Meanwhile, energy planners have largely overlooked
this particular plug load in energy forecasting.
11The Most Complicated Plug Load
Given that proper characterization of an energy end use requires a coordinated characterization
of technology, market shares, and user behavior, computer gaming could prove to be the most
complicated plug load. A supreme challenge is that the gaming marketplace is changing faster
than data can readily be gathered and policy developed.
This report answers a wide array of critical questions not addressed in the existing public-
domain literature. These include quantifying the characteristics and relative energy use of
different families of gaming devices (desktops, laptops, consoles, and media-streaming
devices), the role of duty cycle, energy use of emerging technologies such as virtual reality
headsets, the effect of game choice and in-game settings on energy use, and energy-savings
opportunities for modifiable desktop systems through hardware as well as BIOS and software
settings. The research team isolated the influences of behavior and technology, shedding light
on the roles of each independently and in combination.
A Highly Energy-intensive Plug Load
Per-unit energy use in desktop and laptop gaming equipment has been generally rising, while
the installed base has expanded both in absolute terms and towards more energy-intensive,
higher-end platforms. While one example of gaming computer performance) has improved in
many cases—suggesting improved efficiencies—this can occur even as power requirements rise.
Consoles have exhibited fundamentally different behavior, with energy use declining even as
user experience is improved. Media streaming devices are among the newer gaming
technologies and have comparatively low energy use at the device level, but high energy
intensity in their connected networks and data centers. More recently, even ordinary PCs as well
as consoles can be used for cloud-based gaming. As described below, gaming systems are
among the most energy-intensive miscellaneous plug loads in California homes.
12CHAPTER 2:
Energy Dimensions of the Gaming
Marketplace
Computer gaming traces its roots to an exhibit created for the World’s Fair in 1940. 5 Today,
three-quarters of a century later, a third of humanity engages in the pastime (NewZoo 2016),
through a myriad of types of electronic devices, including even smart watches. 6 In the United
States, 66 percent of people over the age of 13 engaged in gaming in 2018, up from 58 percent
just five years earlier (Nielsen 2018). The average gamer is 35 years old, and 41 percent of
gamers are women (ESA 2016).
Surveys indicate steadily increasing numbers of gamers, amounts of time spent in gameplay,
and consumer demand for progressively more vivid and immersive user experiences seems to
have no bounds. Without offsetting efficiency gains, these driving forces stand to push energy
demand for gaming far higher.
Researchers gathered and reviewed available energy-relevant information on the computer
gaming market, including associated technology trends and gaps in the consumer information
environment. The team developed a profile of the California marketplace for the purposes of
performing energy analysis at the equipment level as well as the macro level.
The resulting analytical platform is based on best-available data and industry expert
assessments. Constituent data include an array of specific gaming systems, operated by four
user types across multi-step duty cycles, and running a representative assortment of popular
game titles. This market segmentation spans the spectrum of gaming experience, system
performance, and power requirements, leveraged to develop a characterization of the installed
base of gaming equipment and its use in California.
Market Segmentation and Installed Base
Based on an extensive review of existing market research and on original analyses developed
for this project by Jon Peddie Research (Mills et al., 2017) together with subsequent survey data
from Urban et al. (2017), the researchers developed a profile of the California marketplace for
the purposes of performing energy analysis and specified a range of 26 pre-built and custom-
built gaming systems that encompasses the range of price, functionality, and user requirements
sought in marketplace circa 2016, the base year for the projections to the future. These include
PCs, consoles, and media streaming devices. The desktop and laptop computers include those
with discrete graphical processor cards (GPUs) purpose-built for gaming as well as
“mainstream” systems with integrated graphics used for gaming. The researchers further group
gaming computers into Entry-level, Mid-range, and High-end categories, based on price and
5
See https://en.wikipedia.org/wiki/Video_game_industry.
6
See http://time.com/4617407/pokemon-go-apple-watch-release-date-2016/.
13You can also read