KAPSARC Oil Market Outlook - Q4, 2021
←
→
Page content transcription
If your browser does not render page correctly, please read the page content below

KAPSARC Oil Market Outlook              1

KAPSARC
Oil Market Outlook
(KOMO)                       Q4, 2021

2     www.kapsarc.org             Demand               Supply               Risk             Balances              Prices                 KAPSARC Oil Market Outlook

Summary

 This quarter’s highlights:

 The drivers of this quarter’s global demand outlook stem from multiple factors (i.e., a slower roll-out of vaccinations in developing countries, multiple continued lockdowns
 in several countries, rising inflation, including shipping costs, lagging delivery times, the usual seasonal behavior of declining road transportation following the peak
 summer season, etc.). Hence, the post COVID-19 recovery is expected to slow oil demand growth with an overall quarter-on-quarter (QoQ) stagnation in Q4 2021 of an
 estimated 10 thousand barrels per day (Kb/d).

 With OECD countries seeing a faster economic recovery than most developing countries, we expect most OECD members to witness oil demand growth this quarter,
 apart from several members of OECD Europe and Japan. On the other hand, several non-OECD countries are expected to experience declines, particularly Eurasia and
 the Middle East, where Saudi Arabia is expected to see the strongest QoQ decline of around 570 Kb/d, in line with its usual seasonal winter behavior. However, emerging
 economies such as China and India will limit the declines with healthy recoveries of 300 Kb/d and 340 Kb/d, respectively.

 On the supply side, no real changes are expected this quarter since the OPEC+ July statements and subsequent meetings. It is estimated that there will be a QoQ growth
 of 2.1 MMb/d. Almost all the growth will come from OPEC+ members as they ease into their scheduled cuts. If there is anything to highlight for supply this quarter, it would
 be the temporary nature of the energy crunch, and how best to manage it.

 Furthermore, the current tightened market, the fact that volatility will be increased by sporadic episodes of supply chain issues and bottlenecks, and the current high oil
 prices are expected to encourage non-OPEC+ producers to produce more, which this report highlights.

 Given the current changes in this year’s historical production revisions, the KOMO team is more optimistic for an overall supply deficit for this year of around 550 Kb/d,
 despite the expectation of a surplus this quarter and moving forward. In contrast, the KOMO team assumes that as we enter 2022, a surplus will develop, resulting in
 OPEC+ members slowing their production growth throughout the year.

Total global oil demand is expected to increase year-on-year (YoY) by 4.44 million barrels per day (MMb/d) in 2021 to 96.5 MMb/d. It is expected to grow by
3.47 MMb/d in 2022, returning to 2019 levels by Q3 2022. Compared with our last forecast, we expect global demand growth to be 200 Kb/d higher than our
KOMO Q3 2021 report and 100 Kb/d higher than our previous expectations for 2022.
Demand            Supply              Risk            Balances            Prices
KAPSARC Oil Market Outlook                                                                                                                 www.kapsarc.org      3

Summary continued...
The International Monetary Fund (IMF) predicts global economic growth of around 6% in 2021 and 4.9% in 2022, compared with a decline in real gross domestic
product (GDP) of -3.3% in 2020. The OECD in its September outlook, “Keeping the recovery on track,” revised its decline in GDP to -3.4% for 2020 and also
revised its forecast for 2021 growth upward to 5.7% (0.1% less than its May outlook). It expects 2022 to witness growth of 4.5%. The upward revisions to the IMF’s
and OECD’s global forecasts reflect several new factors, including fiscal stimulus in a few major economies and the positive adaptation of economic activity to
lockdowns. Changes to the 2021 forecast include an upward revision to the forecast for advanced economies, while the prospects for emerging economies have
been marked down.

The KOMO team hinges its forecast on the fact that the ongoing COVID-19 shock (and related supply chain impacts, etc.) are a drag on the global economy.
Thus, our view moving forward is that the economy will rely on continued stimulus packages and adjusted debt payments for developing countries. This will help
countries focus on addressing the pandemic and creating a strong, yet even, economic recovery for 2022 and 2023. Furthermore, we also base our forecast on
the possibility of new COVID-19 variants popping up, but we assume that the global community will find ways to adapt to the situation in a manner that does not
impede an economic recovery.

We have revised some of the countries’ historical demand upward and have revised some production growth levels downward, particularly Iran and Nigeria.
Although the supply forecast for this quarter has been straightforward, estimating demand is considerably more complex. An uneven recovery from COVID-19,
declining inventories in the face of an economic recovery and lagged shipments have become more evident since the second half of this year. Supply chain
disruptions and inflation are expected to rise this quarter, and the disruptions will not be limited to oil only. At the same time, the case of Evergrande becoming a
new ‘Lehman moment’ is picking up, and people are questioning if the global economy is at risk of a financial crash such as that of 2008.

By considering all these factors, we can only forecast conservatively and hope that all these concerns will subside by the end of this year. Nevertheless, the
global community should be encouraged by the remarkable recovery that has taken place this year. Our gaze must shift slowly to the aftermath of COVID-19, and
we must focus on the world recovering sustainably. This entails continued economic cooperation, but most importantly, continued financial support nationally
and internationally.

We emphasize the importance of economic and financial cooperation because the future course of government policy is uncertain and highly fragmented.
There is some concern that a reduction in government spending and quantitative easing happening too soon after the COVID-19 crisis might trigger economic
slowdowns like those that followed the 2008 financial crisis. The United States (U.S.) has recently stopped expanded unemployment benefits for those affected
by COVID-19, the U.S. dollar has been relatively low for a prolonged period, and the U.S. Federal Reserve has been signaling a taper of bond purchases as well
as an interest rate hike to limit inflation and return rates to more ‘normal’ levels. Bond markets in the U.S. and the United Kingdom (U.K.) are on track to realize
4    www.kapsarc.org            Demand            Supply              Risk            Balances            Prices                KAPSARC Oil Market Outlook

Summary continued...

their worst month since January, sending yields higher in the U.S., the U.K. and Europe. Higher interest rates could help lower inflation risks, but this would
also slow economic activity and mean a risk of divestment in several developing countries in favor of higher returns elsewhere. Most countries will adjust their
interest rates to stabilize their economies, and some will seek to increase revenues by raising taxes, which will raise commodity prices. As the global community
scrambles to adjust to a post-COVID-19 world that is also more climate conscious, we remain cautious that these fragmented actions might hinder future growth
projections, with knock-on effects on oil demand as well. As little as three months ago, there was a consensus in favor of shutting the fossil fuel industry to reach
net-zero emissions. As inventories tighten, we now find experts and other authorities pleading for increased production.

Hence, our base-case projections are contingent on the success of containment measures against the new COVID-19 variants and the continuation of economic
stimulus packages. We assume that the pandemic (including any new COVID-19 variants) will largely be brought under local/regional control by the end of
this year. We also considered the results of our biannual survey where participants assumed that over 50% of the global community would be vaccinated by
the second half of 2022. Yet, surprisingly, approximately 46.9 % of the global population has now been vaccinated (one dose). Furthermore, the World Trade
Organization (WTO) expects global merchandise trade to grow at levels as high as 10.8% this year, a considerable increase over the 8% expected in March. As a
result, these numbers underpin our relatively optimistic demand outlook.

The total global oil supply is expected to grow by about 1.8 MMb/d in 2021, (about 300 Kb/d less than our Q3 2021 forecast) and by 6.1 MMb/d in 2022 (about 1
MMb/d higher than our Q3 2021 forecast). The downward revision in 2021 is due to supply disruptions such as Hurricane Ida. Current high prices predict a supply
surge in 2022 from many players, including U.S. shale, in addition to OPEC+ increases.

While the current OPEC+ plans are for a steady release of 400 Kb/d per month (a plan endorsed at the most recent meeting on October 4), some in the market
are calling for an accelerated schedule, with a larger intervention. Considering the drivers for this short-term crisis lay mostly outside the oil market, in soaring
natural gas and coal prices, Brexit, supply chain bottlenecks and other temporary issues, whatever adjustments are made in the near term may need to be
reversible as we see a supply surplus for next year based on the current OPEC+ plans. The surplus has the potential to begin as early as Q4 as winter demand
may not meet expectations.

As we discussed last quarter, following the OPEC+ plan as stated would involve a steady release schedule while the group monitors the market. The KOMO
team expects that there may need to be a pause or slowdown to production increases in Q1 2022 to prevent significant oversupply. OPEC+ members that gained
a baseline adjustment, which will be implemented in May 2022, will gain a small increase, but otherwise production is expected to be mostly flat to manage
inventory levels.
Demand            Supply             Risk            Balances             Prices
KAPSARC Oil Market Outlook                                                                                                                   www.kapsarc.org            5

Summary continued...

U.S. shale is a key wildcard for the near future, as high prices should drive significant growth in drilling. So far, larger public firms have maintained their
discipline, while smaller private firms are expanding quickly. Going forward, we believe a modest increase in drilling will be considered amid ongoing shareholder
pressure. Recent supply growth has shale essentially flat on average for 2021, with a potential upside of 840 Kb/d in 2022 due to current prices driving
production.

These base-case supply/demand trends suggest that the supply deficits seen so far this year will end in Q4 of 2021 and carry through 2022, with a surplus
ranging between 0.6-2.6 MMb/d quarterly and averaging 2.1 MMb/d in 2022. This forecast is contingent upon an improved picture for the pandemic, with more
vaccinations and control of the spread of new variants allowing for more economic growth, while OPEC+ manages supply conservatively.

As stated in our last outlook, we assume OPEC+ may face some challenges in 2022. Winter 2021/2022 risks an oil surplus due to seasonal demand declines and
the beginnings of a non-OPEC+ supply recovery. In the first half of 2022, OPEC+ may be required to reintervene with modest temporary cuts if inventories build
faster than desired.

While the fundamentals may change between now and spring 2022, OPEC+ must stay vigilant and only increase production as the market needs. The longer-term
picture in our model is more optimistic, with a reduction of imbalances that would allow for crude draws in the second half of 2023. As always, we point out that
group cohesion will be important in either high- or low-price scenarios to facilitate a balanced market.

Under these assumptions, target inventory levels for the OECD are expected to rise by 36 MMb to 4,569 MMb in 2021 and increase by 36 MMb in 2022. Actual
inventory levels are expected to overshoot the desired targets, reaching 4,627 MMb in 2021 and increasing by 259 MMb in 2022. Real inventory levels rising
sharply above the desired capacity are expected to create the conditions for a more bearish price regime. We estimate prices to decline unless OPEC+ takes
new actions.

                       2019             2020            Growth            2021             Growth          2022            Growth            2023            Growth
    Demand             99.7             92.1             (7.6)            96.5              4.4            100.0             3.5             102.0                2.0
     Supply            100.6            94.2             (6.4)            96.0              1.8            102.1             6.1             102.6                0.5
       Δ                0.9              2.1                              (0.6)                             2.1                               0.6
6 www.kapsarc.org Demand Supply Risk Balances Prices KAPSARC Oil Market Outlook
Summary (prices)
Brent crude oil price and 68% confidence intervals US$/b
140
The confidence interval is derived from
options market prices and the futures curve, 120
which represent the views of a wide array
of market participants, such as producers,
100
refiners, airlines, speculators, and others.
80
60
40
20
0
Jan-00 Jan-02 Jan-04 Jan-06 Jan-08 Jan-10 Jan-12 Jan-14 Jan-16 Jan-18 Jan-20 Jan-22
Brent futures price FOB (US$/b) Lower/upper confidence interval (68%)
Brent spot price FOB (US$/b)
Source: KAPSARC calculations based on NYMEX data, CME Group, FINCAD, October 2021.
US$/b Q4 2021 Q1 2022 Q2 2022 Q3 2022 Q4 2022 Q1 2023 Q2 2023
Futures $78.31 $76.78 $74.85 $73.75 $71.31 $68.88 $66.18
50% CI $73 - $83 $68 - $86 $63 - $88 $60 - $90 $55 - $91 $50 - $93 $47 - $93
68% CI $71 - $86 $64 - $90 $58 - $96 $54 - $99 $49 - $103 $44 - $107 $40 - $109
95% CI $64 - $94 $55 - $107 $45 - $123 $41- $131 $34 - $148 $28 - $166 $25 - $177
Note: CI = confidence intervalDemand Supply Risk Balances Prices
KAPSARC Oil Market Outlook www.kapsarc.org 7
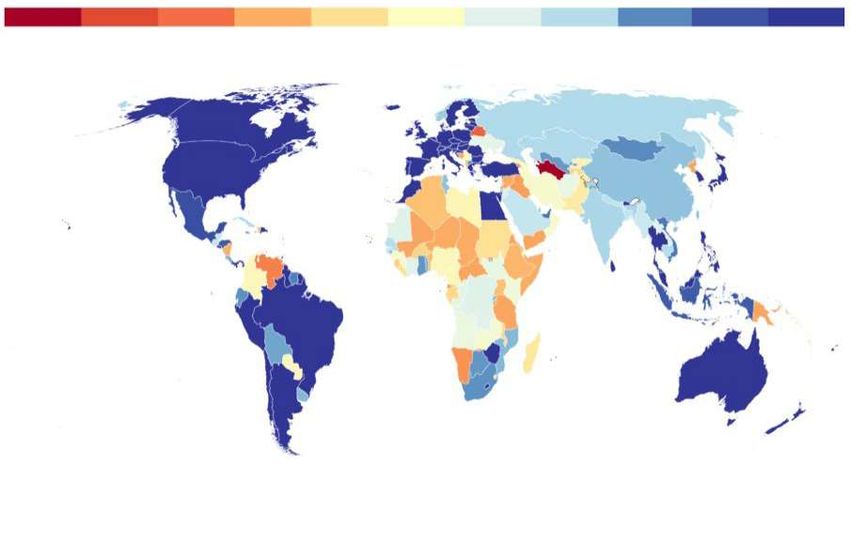
Key issues for the oil market in 2021 and 2022
To better understand what to expect for 2021 and
IMF-WHO Vaccine Supply Tracker, 21 September 2021 2022, KOMO requested the IMF’s permission to
publish the following map taken on September 21,
SECURED VACCINES AND/OR EXPECTED VACCINE SUPPLY 2021, from the IMF-WHO COVID-19 Vaccine Supply
(% OF TOTAL POPOLUTION)
Tracker, which portrays secured vaccines and/or
expected vaccine supplies. There is no doubt that
0 10 20 30 40 50 60 70 80 90 100+ there is a strong correlation between income levels
and total vaccine supply, as well as a weaker but
significant relationship between income levels and
the proportions of vaccinated citizens. It is also
evident that, along with disparities in vaccination rates
between countries, there is an economic recovery
disconnect between OECD and non-OECD countries,
which will also seep into their oil demand projections.
The fundamentals of oil recovery in 2021-22 remain
contingent on the roll-out of vaccinations followed by
continued stimulus package support. Vaccines will
help expedite herd immunity and protect healthcare
institutions from being overwhelmed, allowing
governments to focus on economic recovery. Stimulus
packages and unemployment benefits will act as a
safety net and a catalyst for economic revitalization
until the adverse impacts of the pandemic (including
supply chain disruptions) ease. This year has
seen significant inflation in commodities and food
prices on the back of elevated shipping costs and
prolonged delivery times causing supply distortions.
Other structural factors in 2021 include shortages in
OFFICIAL BOUNDARIES SOURCE semiconductors, economic protectionism, and rising
global tensions. Further supply chain disruptions
associated with climate change and the great energy8 www.kapsarc.org Demand Supply Risk Balances Prices KAPSARC Oil Market Outlook
Key issues for the oil market in 2021 and 2022...
transition may result in prolonged inflation. However, However, at the time of writing this report, the world is editorial at the end of this report for more details.
as the global economy recovers, it is expected that facing new variants of the COVID-19 virus as well as
supply will meet demand and inflation will ease. The prolonged lockdown measures. COVID-19 will become The challenge on the supply side is how best to
same dynamic is expected in oil demand. endemic and our ‘new flu,’ with regular vaccinations steward a market that is trying to handle several
required for the foreseeable future. The global indirectly related crises. The impact of Hurricane Ida
This quarterly report assumes that COVID-related economy is restarting, and we can only hope that on supply (and refining) has largely been overcome,
stimulus packages will continue throughout the these disruptions will fade away in the coming months but the production losses have been material. The
forecast period but will decline. Support packages as we adapt to the new normal. petrol shortages in the U.K. that are attributed to Brexit
are already being reduced in many developed have yet to be resolved, and energy shortages in the
and developing countries, and this seems to be As a result, we anticipate oil demand growth in 2021 to European and Asian gas markets continue to have a
accelerating. For example, the U.S. ended its average 4.44 MMb/d, with OECD countries unusually knock-on effect on oil supply. However, there is some
pandemic-driven supplemental unemployment benefits leading the increase, representing 2.27 MMb/d. doubt that there is as much fuel-switching capacity as
on Labor Day (September 5). The issue of debt Non-OECD demand growth is expected to average some international bodies are making out, especially
restructuring also remains contentious for developing 2.17 MMb/d in 2021. Next year is also expected to in Europe. Finally, Chinese power generation from
countries. In fact, when KAPSARC chaired the T20 in see meaningful global growth of around 3.47 MMb/d, coal continues to suffer from a reduction in Australian
2020, this topic was one of the most prominent issues returning to pre-pandemic levels by Q3. Yet, despite imports that have apparently dropped off for political
discussed. Will developing countries continue to have these promising projections, demand growth in Q4 will reasons, adding to the potential upside for oil
support for debt easing measures over the next two lag for all the reasons stated earlier, along with the demand from generators. In short, the oil market is
years? normal seasonal cycle of demand falling during winter. experiencing turbulence on all sides.
The Kingdom of Saudi Arabia is expected to lead this
As the global community (hopefully) moves beyond quarterly slowdown with a seasonal QoQ decline of OPEC+ is following through with its original plan
the COVID-19 disruptions toward its natural economic 570 Kb/d. (as endorsed at the group’s October 4 meeting)
activity, a premature disruption of pandemic-related and weathering these short-term problems instead
stimulus measures and rising interest rates have Global natural gas market dynamics also need to be of massively increasing production. The probability
the potential to impede this transition. Developing considered. As gas prices rise and the global LNG of an overshoot in supply is high and would make
countries, in particular, represent the larger part of oil market tightens, the need for heating fuels (and the balancing the market next year difficult if demand
demand growth and are at risk of growing at a slower substitution of oil for gas in power generation) will languishes. Compliance with OPEC+ production
pace than anticipated. Nevertheless, countries such persist well into winter, which may lead to higher quotas has remained high so far, and, with some
as China, India and the U.S. have the potential for an consumption of liquified petroleum gas (LPG) and concessions on baseline figures, the group looks
upward revision in oil demand, counteracting the risks gas/diesel liquids. Indeed, a longer, colder, or earlier committed to cooperation going forward. While high
of low demand growth in other countries. winter could increase demand. See the accompanying prices may tempt some members to break away andDemand Supply Risk Balances Prices
KAPSARC Oil Market Outlook www.kapsarc.org 9
Key issues for the oil market in 2021 and 2022...
increase production, the benefits of compliance have uncertainty for 2022. Providing shareholder value in mitigate any short-term ‘negative’ supply shocks.
outweighed the benefits of non-compliance until now, the form of dividends and buy-backs is important, but Prices could see additional downward pressure if
with prices around $80 a barrel. that must be supported by oil production. It may not be efforts to limit the spread of the new variants fail
long before we return to substantial increases in shale or if OPEC+ members further relax their cuts (or if
Global supply growth for 2021 is estimated at 1.8 production if the price stays high. discipline erodes). Based on our forecast balances,
MMb/d, with the majority coming from existing sources this downside risk will be especially pronounced in
like OPEC+. Next year could see 6.1 MMb/d of supply Canadian oilsands saw the opening of the Enbridge 2022.
come online, with about half of this coming from Line 3 pipeline, providing an additional 760 Kb/d of
OPEC+ and the remainder from the U.S., Canada, export capacity into the U.S. pipeline network. This KOMO’s supply/demand forecast is an average
Brazil, and Norway. QoQ, Q4 2021 should see a should ease some difficulties for local producers. Still, for each quarter and does not consider short-term
bumper increase of 2.1 MMb/d, with the planned operationally they may face some challenges with volatility. Actual changes to supply and demand will,
increases from OPEC+ driving most of this growth. several major insurance firms exiting the market for of course, remain volatile, reflecting the responses to
the oilsands, dropping coverage of the Trans Mountain and the duration of the COVID-19 pandemic. Other
Negotiations with Iran on a potential nuclear deal are pipeline and driving up costs. challenges may include unexpected oil supply cuts due
still stalled, with sanctions evasion making it difficult to to hurricanes, OPEC+ compliance, and upheavals in
bring them to the table. Iranian oil exports to various Lastly, November brings us the much anticipated developing countries, among others.
locations, including China, Lebanon, and condensate 26th Conference of the Parties (COP26) in Glasgow,
shipments to Venezuela continue. The U.S. has even after having been delayed by a year by the pandemic.
requested that China reduce its purchases of Iranian News coverage and opinion pieces on climate change
crude, but this seems unlikely. are reaching a heightened pitch, detailing the actions
being called for to solve it. As the major source
Shale production in Vaca Muerta, Argentina is of emissions, hydrocarbons will continue to be a
growing fast, though incremental growth volumes large part of the debate. However, it is unclear how
remain small. U.S. drillers appear to be divided individual countries or the group as a whole plan to
on production volumes, with private companies make the transition to clean energy without adversely
drilling at an impressive pace, while international oil affecting the global economy. Development plans may
companies (IOCs) and large independents have so be on hold for many firms while they wait to see the
far not increased drilling significantly. The larger firms, results of the conference.
however, are buying up the acreage of European
firms exiting the market due to shareholder pressure. Adequate inventory and high spare capacity levels
Whether that discipline can be sustained is a key persisting well into 2021 should be sufficient toDemand Supply Risk Balances Prices
10 www.kapsarc.org KAPSARC Oil Market Outlook
Demand forecast
Global oil demand is projected to grow by 4.4 MMb/d in We estimate that the bulk of OECD growth will be Emirates (UAE) and Qatar will drive oil demand
2021 and increase by an additional 3.5 MMb/d in 2022 carried by the U.S., which is expected to account for growth for the region, of 48 Kb/d 27 Kb/d and 14 Kb/d,
YoY. However, global demand is expected to stagnate 82% of OECD Americas’ growth and 53% of total respectively, the remaining non-Gulf Cooperation
QoQ in Q4 2021, only growing by 10 Kb/d, after a OECD growth. Indeed, as the U.S. was the country Council (GCC) countries are expected to witness
record QoQ growth in Q3 2021 of around 3.4 MMb/d. most affected by the 2020 oil demand downturn, it is declines.
The predicted pause comes from the natural seasonal experiencing the strongest rebound in demand this year.
decline in winter accompanied by continued lockdown We estimate demand to grow by around 1.5 MMb/d for We anticipate that all OECD countries except New
measures in some countries/regions, as well as a OECD Americas (100 Kb/d more than our last outlook), Zealand will see oil demand growth in 2022. Oil demand
slower deployment of vaccinations in some developing followed by OECD Europe at 610 Kb/d (200 Kb/d more from OECD Americas is expected to reach 2019 levels
countries. than our last outlook) and OECD Asia-Oceania by by the second half of 2023, with OECD Asia Oceania
190 Kb/d (60 Kb/d less than our last outlook). Asia will reaching these levels by the end of 2022. Although
In our previous reports, we expected OECD countries to represent most of the non-OECD demand growth in we expect OECD Europe to have an overall demand
see similar oil demand growth to non-OECD countries 2021, followed by Latin America and Africa. Non-OECD growth of 920 Kb/d between 2022 and 2023, we do
this year. However, the gap has widened slightly Asia is expected to grow by around 1.9 MMb/d, followed not expect it to return to its 2019 level of demand.
between the two groups, with OECD members taking by Latin America at around 320 Kb/d, and Africa by This forecast reflects structural declines in the region
the lead at 2.27 MMb/d and non-OECD now standing around 45 Kb/d. Growth in Eurasia is anticipated to following a movement to diversify away from fossil fuels
at 2.17 MMb/d. China’s demand is starting to rebound stagnate as significant growth in Russia is subdued by and enhance efficiency standards.
in Q4 after subdued growth in Q2 and Q3, and India’s the declines in the remaining countries of the region.
demand is now expected to recover strongly, with its We estimate that demand growth for non-OECD
harvest season starting September followed by its On the other hand, the Middle East is expected to countries in 2022 will be faster than for OECD countries,
festive period in Q4 (i.e., Diwali, Navaratri, etc.). While witness a reduction in demand of 110 Kb/d in 2021. As at 2.1 MMb/d in 2022 (300 Kb/d more than our last
we expected the spread of COVID-19 in Africa to discussed in previous publications, and following the outlook). This is because demand growth has slowed
limit the continent’s economic growth, it seems to be IMF’s outlook, we expect the hydrocarbon exporting this year due to resumed lockdown measures in a few
rebounding this quarter, canceling the declines of Q3. countries to have weaker recoveries than other regions, countries; hence a stronger comeback is expected next
Nevertheless, the total impact of the economic recovery as their economic growth remains proportional to their year. The underlying (pre-COVID-19) growth trend is
remains stronger in OECD countries. hydrocarbon export revenues. Although we presume also much stronger among non-OECD countries.
that countries such as Saudi Arabia, the United ArabDemand Supply Risk Balances Prices
KAPSARC Oil Market Outlook www.kapsarc.org 11
Demand forecast...
Annual global oil demand growth, MMb/d, 2019-2022
102
99.7 1.7 100.0
100
0.3 0.2
0.4
98 0.5
0.3
1.2 96.5
96 0.1
0.3
1.1
0.6
94
1.2
92.1
92
90
21
19
20
es
e
na
a
C
ld
es
pe
na
a
C
ld
22
p
di
di
C
C
or
or
20
at
at
20
20
ro
hi
ro
hi
20
In
In
G
G
w
w
St
C
St
C
Eu
Eu
O
O
d
d
R
R
D
D
te
te
EC
EC
ni
ni
U
U
O
Source: KAPSARC, September 2021. O
Note that the largest YoY oil demand growth ever recorded was 4.1 MMb/d in 1973, according to the BP Statistical Review of World Energy.
We project growth for 2021 to be 4.4 MMb/d. However, global oil demand levels will remain below those of 2019.Demand Supply Risk Balances Prices
12 www.kapsarc.org KAPSARC Oil Market Outlook
Demand levels, MMb/d Non-OECD countries are expected to retain a 53% share of global oil demand in 2021 and 2022. They will also
account for 49% of demand growth in 2021. In 2022, these countries are expected to represent 61% of global
demand growth since they will be facing a slower recovery this year, but their demand growth should pick up in 2022.
2020 Q1 Q2 Q3 Q4 2020
OECD 46.3 40.2 42.6 42.7 42.9 The largest seasonal changes this quarter are expected to come from the Middle East. As stated earlier, Saudi Arabia
Non-OECD 48.6 46.0 49.6 52.5 49.2 may see the largest QoQ decline in demand as part of its normal seasonal downturn. Asia-Oceania is expected to
Global demand 94.9 86.2 92.2 95.2 92.1 experience the largest upward change in demand, with China and India leading the growth, followed by South Korea.
Our current demand assumptions are susceptible to significant changes, depending on the impact of the
new COVID-19 variants, the development of vaccinations and the speed of their distribution, the recovery
2021 Q1 Q2 Q3 Q4 2021
in economic activity and travel, supply chain bottlenecks, rising transportation costs, and future oil price
OECD 43.3 44.3 46.5 46.7 45.2
movements. Further revisions to these assumptions will be needed as we progress through Q4 2021,
Non-OECD 50.2 51.0 52.2 52.0 51.3
particularly for the U.S. and China. The KOMO team remains conservative in its demand estimates when
Global demand 93.5 95.3 98.7 98.7 96.5
compared with other forecasts and highlights that GDP recovery could create further potential for oil
demand growth.
2022 Q1 Q2 Q3 Q4 2022
OECD 46.7 45.8 46.5 47.3 46.6 Regional oil demand growth, MMb/d, Q1 2021-Q3 2023
Non-OECD 52.0 53.4 54.4 53.9 53.4 4.0 104
Global demand 98.7 99.2 100.9 101.2 100.0 3.0 102
2.0 100
98
1.0
MMb/d
2023 Q1 Q2 Q3 96
0.0
94
OECD 47.5 46.8 48.0 -1.0 92
Non-OECD 53.4 54.5 54.8 -2.0 90
Global demand 100.9 101.3 102.7 -3.0 88
Q1 Q2 Q3 Q4 Q1 Q2 Q3 Q4 Q1 Q2 Q3
Eurasia -0.5 0.3 0.6 -0.1 -0.4 0.1 0.5 -0.2 -0.3 0.2 0.5
Africa -0.1 0.0 -0.2 0.2 0.1 0.0 -0.2 0.2 0.1 0.0 -0.2
Middle East -1.4 0.9 0.5 -0.8 -0.3 0.9 0.6 -1.1 -0.4 0.8 0.5
Asia-Oceania -0.3 -0.9 0.3 0.6 1.2 -0.4 0.2 1.4 0.4 -1.0 -0.5
Europe -0.2 0.5 1.0 -0.3 -0.1 0.1 0.3 0.1 -0.1 0.1 0.5
Americas 0.7 1.1 1.3 0.4 -0.5 -0.1 0.3 -0.1 0.0 0.3 0.7
Global demand 93.5 95.3 98.7 98.7 98.7 99.2 100.9 101.2 100.9 101.3 102.7
Source: KAPSARC, September 2021.Demand Supply Risk Balances Prices
KAPSARC Oil Market Outlook www.kapsarc.org 13
United States
MMb/d 2020 Q1 Q2 Q3 Q4 2021 Q1 Q2 Q3 Q4 2022 Q1 Q2 Q3 Q4 2023
United States 19.0 19.3 19.9 20.8 20.9 20.2 20.6 20.5 20.6 20.6 20.6 20.7 20.9 21.3 21.4 21.0
2021-2022
U.S. oil demand is expected to grow by around 1.21
MMb/d in 2021 and continue to grow by 340 Kb/d in
2022, yet remain below 2019 levels.
United States, MMb/d (L) and 21-23 Growth Kb/d (R)
Just as transportation fuels were hit the hardest in 2020,
22.0 1,400
they have recovered the fastest in 2021. U.S. gasoline
demand in 2021 should see the strongest growth (560 21.5
1,200
Kb/d), followed by gas oil/diesel (240 Kb/d), LPG (150
21.0
Kb/d), and other heavy fuels. However, we expect the
latter to stage only a limited recovery. Our expectations 20.5 1,000
for jet fuel growth remain cautious in 2021 at around
20.0
110 Kb/d, but 2022 looks much more optimistic as 5 yr avg., 20.2 800
international travel increases. 19.5
600
19.0
Q4 2021
We expect the beginning of fall in the U.S. to result 18.5 400
in QoQ demand growth of around 180 Kb/d, with an 18.0
increase in heating fuels. As a result, we estimate both 200
gas/diesel oil and LPG to grow by 300 Kb/d each, while 17.5
other fuels stagnate or even decline, such as gasoline
17.0 0
(with the end of the traditional summer driving season) Q1 Q2 Q3 Q4 Q1 Q2 Q3 Q4 Q1 Q2 Q3 Q4 21-22
and other heavier fuels (200 Kb/d declines each). 2010 2011 2012 2013 2015 2016 2017 2018 2020 2021 2022 2023
Storms in the Gulf of Mexico and natural gas price
increases have led a number of electricity producers to Source: KAPSARC, September 2021.
use fuel oil as feedstock, lending additional support to
the distillate product market.Demand Supply Risk Balances Prices
14 www.kapsarc.org KAPSARC Oil Market Outlook
OECD Europe
MMb/d 2020 Q1 Q2 Q3 Q4 2021 Q1 Q2 Q3 Q4 2022 Q1 Q2 Q3 Q4 2023
OECD Europe 12.5 12.3 12.8 13.8 13.5 13.1 13.4 13.5 13.8 13.8 13.6 13.7 13.9 14.3 14.2 14.0
2021-2022
OECD Europe’s oil demand is expected to grow by 570
Kb/d in 2021 and another 390 Kb/d in 2022. Like the
U.S., OECD Europe is expected to recover much, but
not all, of its lost demand from 2020. However, unlike
the oil demand estimates for other OECD nations, OECD Europe, MMb/d (L) and 21-23 Growth Kb/d (R)
KOMO presumes demand from this region has peaked
15.5 620
and expects a stagnating or declining trend for OECD
Europe post-2023.
15.0 600
We expect a resumption of transportation activities
in 2021 to drive diesel up by 260 Kb/d (45% of total 14.5 580
growth) because much of the European fleet relies on
this fuel. Gasoline demand is expected to rise by 70
14.0 560
Kb/d, followed by aviation and heavier fuels at around
5 yr avg., 14.05
60 Kb/d each.
13.5 540
Q4 2021
OECD European demand is expected to stagnate and, 13.0 520
in some cases, even decline as it usually does in the
fourth quarter. Earlier projections indicated that the 12.5 500
region would decline by 200-400 Kb/d. Still, like the
U.S., we expect OECD Europe to capitalize on heating
12.0 480
fuels given soaring natural gas prices, with gas/diesel Q1 Q3 Q1 Q3 Q1 Q3 Q1 Q3 Q1 Q3 21-22
oil demand growing by 210 Kb/d and LPG by 200 2010 2011 2013 2014 2016 2017 2019 2020 2022 2023
Kb/d. All other fuels will either stagnate or decline, but
gasoline demand is expected to witness the strongest Source: KAPSARC, September 2021.
decline at around 170 Kb/d.Demand Supply Risk Balances Prices
KAPSARC Oil Market Outlook www.kapsarc.org 15
China
MMb/d 2020 Q1 Q2 Q3 Q4 2021 Q1 Q2 Q3 Q4 2022 Q1 Q2 Q3 Q4 2023
China 13.6 14.9 14.5 14.5 14.8 14.7 14.9 15.2 15.0 15.4 15.1 15.3 15.5 15.1 15.3 15.3
2021-2022
China’s oil demand is expected to grow by around 1 demand for all other fuels, particularly heavy fuels, gasoline demand and jet fuel at 90 Kb/d and 80 Kb/d,
MMb/d in 2021 and around 440 Kb/d in 2022. China’s oil which are estimated to decline by 230 Kb/d, followed by respectively.
demand was somewhat stagnant in Q2 and Q3 of this
year due to regional lockdowns, increased oil prices and
national fuel prices, and lower than usual investments in China, MMb/d (L) and 21-23 Growth Kb/d (R)
national markets due to the government’s new “Common 17 1,200
Prosperity” campaign. Q4, however, seems to be looking
good and pushing demand slightly higher than our last 16
forecast by 200 Kb/d. 1,000
15
China’s growth for this year is expected to come from
14 800
transportation fuels. We expect diesel growth to reach
280 Kb/d and gasoline around 250 Kb/d. Heavier fuels 13
are also expected to be in demand this year, with an 600
estimated growth of 180 Kb/d. LPG, for now, is expected 12
to grow by 130 Kb/d. However, this number is subject to 5 yr avg., 12.51
11 400
revision depending on the gas market dynamics.
10
Q4 2021 200
9
China’s QoQ demand is expected to grow by 290 Kb/d.
Gas/diesel oil demand is expected to lead this growth 8 0
with an estimated 380 Kb/d increase, followed by LPG Q1 Q3 Q1 Q3 Q1 Q3 Q1 Q3 Q1 Q3 21-22
2010 2011 2013 2014 2016 2017 2019 2020 2022 2023
at 200 Kb/d and naphtha at around 150 Kb/d. These
increments will be limited with seasonal declines in Source: KAPSARC, September 2021.Demand Supply Risk Balances Prices
16 www.kapsarc.org KAPSARC Oil Market Outlook
India
MMb/d 2020 Q1 Q2 Q3 Q4 2021 Q1 Q2 Q3 Q4 2022 Q1 Q2 Q3 Q4 2023
India 4.5 4.9 4.7 4.6 4.9 4.8 5.1 5.1 4.8 5.2 5.1 5.3 5.3 5.0 5.4 5.3
2021-2022
India’s oil demand is expected to grow by around 260
Kb/d in 2021 and 290 Kb/d in 2022, returning to healthy
growth after being below its yearly average growth this
India, MMb/d (L) and 21-23 Growth Kb/d (R)
year. This was expected considering the soaring cases
of COVID-19 in 2021 and the social unrest following the 5.5 300
farm bill proposed by the Indian government earlier this
295
year, among other phenomena. As a result of this, Q2
and Q3 saw declining demand. However, it is expected 290
5.0
to pick up as we enter Q4.
285
We expect diesel demand to grow by 100 Kb/d, followed
by gasoline and LPG at 40 Kb/d each. All other fuels are 280
4.5
expected to grow but at a slower pace.
5 yr avg., 4.71 275
Q4 2021
270
QoQ India is expected to witness demand growth of 340 4.0
265
Kb/d. Indeed, September and October correlate with the
harvest season and early November will bring us Diwali. 260
As a result, we expect growth across all fuels except
3.5
for fuel oil. Diesel demand should lead the growth with 255
an expected increase of 180 K/d, followed by heavier
250
fuels at around 80 Kb/d. The demand for gasoline in
India, although not projected in this report, could well 3.0 245
hit record highs in fiscal 2021 as COVID-19 curbs are Q1 Q3 Q1 Q3 Q1 Q3 Q1 Q3 Q1 Q3 21-22
2010 2011 2013 2014 2016 2017 2019 2020 2022 2023
eased and business and leisure travel accelerate.
Source: KAPSARC, September 2021.Demand Supply Risk Balances Prices
KAPSARC Oil Market Outlook www.kapsarc.org 17
Saudi Arabia
MMb/d 2020 Q1 Q2 Q3 Q4 2021 Q1 Q2 Q3 Q4 2022 Q1 Q2 Q3 Q4 2023
Saudi Arabia 2.8 2.5 3.0 3.3 2.7 2.9 2.5 3.1 3.4 2.8 2.9 2.5 3.1 3.4 2.8 3.0
2021-2022
Saudi Arabia’s oil demand should rebound by 48 Kb/d
in 2021 and continue rising by a further 52 Kb/d in 2022
(10% higher for both years than our previous outlook).
Saudi Arabia, MMb/d (L) and 21-22 Growth Kb/d (R)
Overall, Saudi Arabia will see small demand increments
for 2021 for all fuels, but not exceeding 10 Kb/d per 4.5 54
fuel. Part of this limited demand growth comes from
continued restraint in oil exports, resulting in a slightly
52
slower economic recovery, and the fuel price reforms that
are encouraging efficient use. As we move forward, fuel
switching and energy efficiency policies will become more 50
prominent, resulting in Saudi Arabia’s modest growth in 3.5
oil demand for the foreseeable future.
48
Q4 2021
46
QoQ, Saudi Arabia is expected to witness the strongest
decline in total oil demand of all the countries, with an 2.5
5 yr avg., 3.09
expected decline of 570 Kb/d. Although this number 44
may seem significant, it is in line with the Kingdom’s
seasonal consumption pattern as temperatures 42
(and electricity demand) drop. Hence, all fuels are
expected to witness demand declines, except for LPG
and naphtha. Diesel and heavier fuels will witness 1.5 40
Q1 Q3 Q1 Q3 Q1 Q3 Q1 Q3 Q1 Q3 21-22
the strongest declines at 210 Kb/d and 190 Kb/d, 2010 2011 2013 2014 2016 2017 2019 2020 2022 2023
respectively. They will be followed by fuel oil at 180 Kb/d
then gasoline at 45 Kb/d. Source: KAPSARC, September 2021.Demand Supply Risk Balances Prices
18 www.kapsarc.org KAPSARC Oil Market Outlook
Discussion
Forecasting the oil market is not like forecasting the Where could this call for increased production come for non-OPEC+ countries, U.S. shale could increase
weather. The clouds do not care if you think it will from? The first (and generally cheapest) option is from production at a relatively fast pace from private firms, or
rain. The oil market, however, is filled with people who OPEC+, as some members are still carrying significant even more so from public ones if expanded drilling was
look at forecasts (and the news) and act upon that spare capacity. For immediate increases, the other construed as creating shareholder value.
information, changing the outcome. The current energy major option is to use inventories (including SPRs)
The message this quarter is to not get too excited.
and supply-chain crunch in the markets, particularly in as virtual producers by releasing crude back onto the
The current crunch can be eased if nobody panics.
gas, is alarming, and there are accompanying forecasts market. Beyond this, the other options have slight
However, the coverage from COP26 is unlikely to calm
calling for significantly higher oil prices for the coming delays that may not be useful for the current situation.
energy markets.
year (the trade in options with strikes above $200/b for
Within OPEC+, there are the members exempt
December 2022 has increased). Highlights from this edition are:
from production quotas due to sanctions (Iran and
The problem with overly pessimistic forecasts is not just Venezuela) that have demonstrated they can still find • OPEC+ is still in the driver’s seat
that it increases the problem today with panic-buying buyers and would likely increase those shipments
• Iranian negotiations are still stalled, but its exports
at both the petrol pump and by state-owned energy accordingly if prices kept rising and their discounted
continue to rise
suppliers (e.g., China), but it also sets the market up crude became more attractive. In a tight supply
for a fall. Current inflated prices, along with talk of environment, even the conflicted parties in Libya might • The outlook for shale producers is directly related to
further increases, will push some producers to do as be tempted to seek a resolution, given the potential their exposure to shareholders
asked and increase production (while high prices also for large lost profits. Outside of OPEC+, there are
• Oilsands open a key pipeline, but difficulties loom
slow demand growth). The oil market has an inherent some projects/countries already working on additional
on the horizon
tendency toward boom and bust, and we may be seeing supply, like Brazil, that could possibly accelerate their
some form of that now. production plans. Lastly, and perhaps most importantlyDemand Supply Risk Balances Prices
KAPSARC Oil Market Outlook www.kapsarc.org 19
Supply forecast
Global liquids supply is expected to grow by about 1.8 current imbalance is truly short-lived. Time will tell if this suggests. In 2021, the usual suspects Norway, Brazil,
MMb/d in 2021 to reach an average of 95.9 MMb/d for was the right move. and Canada will all increase production by over 100
the year. We expect 2022 to see a 6.1 MMb/d increase Kb/d, with similar gains in 2022. U.S. shale, in particular,
Outside of OPEC+, companies are responding to
in supply, with an average supply of 102.1 MMb/d for is going to be an interesting segment to watch in
market conditions with improved pricing as a major
the year, reaching pre-pandemic levels of over 100 the coming few quarters, with their commitments to
determinant, but not the only consideration. October
MMb/d before mid-2022. This represents a downward shareholder value, declining inventory of drilled but
hit highs not seen since 2018, above $80/b, but KOMO
revision for 2021 of 500Kb/d and an upward revision uncompleted (DUC) wells, and high prices testing their
forecasts that the backwardation in the forward curve
of 1.1 MMb/d for 2022 due to supply disruptions such loyalties and pushing them toward an expansion of
suggests that this may prove to be a short-lived bump
as Hurricane Ida and increased pricing driving more drilling.
if a large surplus emerges in 2022, as our balance
production.
Almost all the growth this year and about half of the
growth in 2022 comes from OPEC+ members. We
Annual global liquid supply, MMb/d, 2019-2022
have YoY growth increments remaining relatively
stable throughout 2022, not including an assumed
adjustment in May for some OPEC+ members. For 103
1.2 0.1 102.1
102
non-OPEC+ members, improved pricing should drive
101 100.6 0.0 0.3
growth, but they will be competing with spare capacity 4.2 0.1 0.2
100
and, in the case of U.S. shale, potentially wrestling
99
with commitments to shareholders and responsible
98
spending.
97 0.2 0.3
0.0 0.4 96.0
0.3
The most important topic in the oil market currently is 96 1.2 0.0
the short-term supply crunch we are experiencing and 95 94.2
the global energy industry’s ability to solve it. OPEC+ 94
is at the center stage of the oil market, while much of 93
the turmoil is occurring in the gas and coal markets and
19
20
l
l
s
)
s
as
21
he al
l
s
)
s
as
22
na
oi
oi
en
ds
en
ds
nd
ay
nd
ay
tra ion
lg
lg
20
20
20
20
y
y
io
ui
ui
og
og
pl
pl
sa
sa
av
av
nt
na
Ex ent
na
iq
liq
crossing over to impact all energy prices. The forecast
er
er
ds
ds
he
il
ve
l
il
io
io
O
O
(k
er
(k
er
v
ui
ui
on
nt
on
nt
tra
th
th
iq
iq
e
e
surplus in 2022 makes it difficult to justify a massive
ve
ve
al
C
C
al
O
O
tl
tl
Ex
sh
on
sh
on
gh
gh
nc
nc
Ti
Ti
increase in supplies if it worsens the market balance
il
il
O
O
U
U
beyond this winter. The decision of the OPEC+ group to
maintain an orderly return to production is prudent if the Source: KAPSARC, September 2021.Demand Supply Risk Balances Prices
20 www.kapsarc.org KAPSARC Oil Market Outlook
OPEC+
In an anxious market, all eyes are on OPEC+. Recent Other than the assistance coming from Iran, faith in Lastly, Russia’s role in the European gas market
disruptions such as Hurricane Ida, global LNG and coal Venezuela appears to be waning. International players, deserves a minor note, as it is having an impact on the oil
shortages, power cuts in China, and the (somewhat at one point interested in helping restart Venezuela’s market. Some analysts believe the shortage of gas from
unrelated) U.K. supply chain issues – combined with oil industry, have begun to pull back. Some reasons Russia is intentional to pressure European regulators to
large inventory withdrawals – are creating pressure on for this are environmental (Total stated they were more speed up their approval of the controversial Nord Stream
the group to increase their production at a faster rate interested in low-carbon sources), while other investors 2 pipeline. More discussion of the current gas market is
than currently planned. The question is whether the appear to be de-risking their portfolios. The one potential available in the editorials in this report.
problems we have now are temporary or indicate a partner Venezuela could hope for is China, but heavy
larger trend in which the market is sharply tightening. As sour crude has additional taxes and restrictive quotas, In summary, there is spare capacity available from
discussed in our demand section, the current problems which could make setting a price attractive to both parties OPEC+ to calm the markets, but it is unclear how
appear to be short-lived and may give way to more difficult. temporary the current problem is. The planned rate
downward or flattening pressures this winter that risk of relaxation for the cuts was already quite fast, and
causing a surplus relatively quickly. Libya’s problems are ongoing, with a struggle between its we highlighted that demand might falter and lead to
Ministry of Oil and Gas and the National Oil Corporation an overshoot next year. If this is a temporary problem,
The higher the price goes, the more difficult it may (NOC) for control of the industry. There have been OPEC could offer a temporary bump, but it needs to
become to hold the members together in maintaining protests threatening production, and the (attempted) prepare for a re-cut if demand does not materialize.
cuts at a steady release rate. There are also other resignation of Deputy Oil Minister Refaat al-Abbar
complicating factors that could lead to supply signaled deeper tensions between factions in the
uncertainties. government. Despite this, official statements claim the
country will increase its production to around 1.6 MMb/d
Iran’s exports have generally been increasing, with in 2022. However, KOMO sees that most of these gains
refined products (though limited by refining capacity) not have already materialized, with a forward estimate of
subject to sanctions and crude shipments to Asia evading around 1.3 MMb/d while these tensions continue.
sanctions entirely. The U.S. has formally requested that
China stop purchasing Iranian crude so that pressure Among the non-exempt members, there are some minor
can be applied in the nuclear talks effectively. However, tensions but nothing significant. Iraq broke away from
it seems doubtful that the petition will be heeded. In their usual mirroring of Saudi Arabian crude prices to
addition to Asia, shipments to other locations, such as offer a discount and boost sales. Nigeria and others
Lebanon, are on the rise, and condensate is being sent are quietly petitioning for increased baselines like those
to Venezuela to help with blending for their sanctioned agreed in July for other members. Neither of these issues
production. should cause a rift that would endanger the agreement.Demand Supply Risk Balances Prices
KAPSARC Oil Market Outlook www.kapsarc.org 21
OPEC+...
OPEC production (L) and OPEC partners production (R) MMb/d
37 17.5
36
35 17.0
34
16.5
33
32
16.0
31
30
15.5
29
28 15.0
Q1 Q2 Q3 Q4 Q1 Q2 Q3 Q4 Q1 Q2 Q3
2021 2021 2021 2021 2022 2022 2022 2022 2023 2023 2023
OPEC OPEC partners
Source: KAPSARC, September 2021.Demand Supply Risk Balances Prices
22 www.kapsarc.org KAPSARC Oil Market Outlook
OPEC and partners supply changes for 2021 and 2022, Kb/d
2021 2022 Kb/d
Mexico (33.9) (11.9) 50
South Sudan 0.7 3.5 0
Equatorial Guinea (3.5) (16.5)
-50
Brunei 15.5 4.8
-100
Sudan (0.0) 13.7
Bahrain (27.0) (3.8) -400
Oman 23.7 59.2
Gabon (2.6) (3.5)
Congo (13.4) (18.1)
Malaysia (26.3) 38.2
Azerbaijan 21.0 10.4
Kazakhstan (36.3) 79.3
Algeria 1.5 49.2
Nigeria (239.4) 151.8
Kuwait (30.0) 204.7
Iran 482.3 456.1
Venezuela 36.9 150.5
UAE (85.2) 329.4
Saudi Arabia (39.2) 1,194.8
Iraq (9.6) 279.7
Libya 823.4 (5.2)
Russia 338.2 956.3
OPEC 784.4 2,782.2
OPEC partners 275.5 1,149.7
OPEC+ TOTAL 1,059.8 3,931.9
Source: KAPSARC, September 2021.Demand Supply Risk Balances Prices
KAPSARC Oil Market Outlook www.kapsarc.org 23
OPEC+ spare capacity
The current market conditions are causing some oil Our forecast for spare capacity this quarter is largely slowing down of planned releases to match or moderate
analysts to ask uncomfortable questions about how unchanged from our last. We expect the plan for the market. This is in the spirit of OPEC’s commitment
much spare capacity OPEC+ has. The reasoning OPEC+ to continue as stated, with the first significant in the monthly meetings to respond and react to market
behind these questions is that maintenance and care for release to occur in Q4 2021. After this (once the conditions in a fast and direct manner.
offline capacity might not have been conducted, or that markets have calmed), there will likely need to be a
ongoing investment needed to offset decline rates may
not have been made, limiting the ability to bring it online OPEC and partners spare capacity, MMb/d
(quickly, at least). These are fair questions but may be Technical base
somewhat overblown.
Q3 2023 4.8 0.5
There was an increase in the baseline values for five
Q2 2023 4.8 0.5
members (Saudi Arabia, Russia, Kuwait, Iraq, and the
UAE) in July, with the UAE and Iraq originally asking Q1 2023 4.7 0.5
for even larger values. In addition to this, some of the
Q4 2022 4.6 0.5
mid-tier members of OPEC+, such as Nigeria, are OPEC
petitioning for baseline adjustments of their own and Q3 2022 4.4 0.6 OPEC partners
presumably have evidence to support their claims. For
Q2 2022 4.8 0.8
the smallest members, their production is notoriously
difficult to monitor; they have had lower compliance Q1 2022 5.3 1.1
rates on average, and frankly qualify as rounding errors
Q4 2021 5.4 1.3
compared with the largest producers.
Q3 2021 6.2 2.1
As such, we cannot know if there is a significant deficit
in spare capacity until we reach a market balance Q2 2021 7.6 2.0
where the members of OPEC+ are free to produce 2.2
Q1 2021 7.7
close to their maximum capacities. While there may be
one or two members that have difficulties returning to 0 2 4 6 8
their pre-pandemic levels, many members of the group
Source: Rystad; KAPSARC, September 2021.
have plans in place to significantly increase production
Note: This updated definition of spare capacity is based on the technical ability of each member to produce at the current price and
(either ongoing or in the immediate future) that could their stated benchmarks versus their forecast production under the OPEC target cuts, including Saudi Arabia’s stated additional spare
outweigh these limitations. capacity of 1.5 MMb/d.Demand Supply Risk Balances Prices
24 www.kapsarc.org KAPSARC Oil Market Outlook
Non-OPEC+
Non-OPEC production and Brent crude oil prices
2,000 140
1,500 120
1,000 100
QoQ MMb/d
US$/b
500 80
0 60
-500 40
-1,000 20
Q1 Q2 Q3 Q4 Q1 Q2 Q3 Q4 Q1 Q2 Q3 Q4 Q1 Q2 Q3 Q4 Q1 Q2
2002 2003 2004 2005 2007 2008 2009 2010 2012 2013 2014 2015 2017 2018 2019 2020 2022 2023
Non-OPEC production QoQ Brent
Sources: IEA, September 2021; KAPSARC, September 2021.
Non-OPEC+ growth:
• In 2021, the supply of U.S. tight oil is expected to rise by 25 Kb/d, with world unconventional gas liquids declining by 270 Kb/d and oil sands reclaiming 310 Kb/d.
• In 2022, the outlook for U.S. tight oil is a rebound of 840 Kb/d, with world unconventional gas liquids growing by 130 Kb/d, and oil sands picking up an additional 162 Kb/d
of growth.
• A key feature of the non-OPEC+ production story for the next eight quarters is the ongoing anxiety around supply chains, not necessarily supply.Demand Supply Risk Balances Prices
KAPSARC Oil Market Outlook www.kapsarc.org 25
Non-OPEC (tight oil and oil sands)
Vaca Muerta in Argentina is the fastest growing shale This quarter, the KOMO report estimates that U.S. shale As mentioned in many prior editions of the KOMO, there
development on Earth now, showing that there could oil production will climb in 2021 by only 25 Kb/d and is a nervous energy in the industry now. Conflicting
really be a future for shale outside the U.S. The Vaca grow by a robust 840 Kb/d in 2022. The improvement messaging from the White House, evolving regulations,
Muerta development is orderly with support from the for 2021 is partly from edits to historical data, along with public pressure, increased costs of labor and inputs
government and shows what can be accomplished a stronger performance this year. The 2022 increase are making it difficult to plan. Because shale has a
with proper backing. The U.S. shale industry, on is driven by current pricing trends and what should shorter development cycle than conventional oil, shale
the other hand, started with many companies and happen in response, even with our risk factors (especially companies might be more indecisive because they can
individual land rights that allow for almost anyone to drill, investor caution) attempting to tamp them down. always catch up later. For now, those that can drill will,
causing explosive growth. But U.S. shale companies while the bigger players might proceed cautiously until
have recently been consolidating their assets. Shale more clarity is available.
development is starting to look closer to how a mature
industry is run, with more focus on returns and less on Monthly U.S. drilling activity (L) vs. global shale production (MMb/d) (R)
growth.
1,600
The taming of the shale patch has also meant companies 13.0
1,400
have had to be more sensitive to shareholders who
have long tolerated breakneck growth but are now 1,200
12.0
insisting on returns, constraining reinvestment rates and
production growth. Now, higher prices are tempting many 1,000
companies toward their former wildcat ways. The private 11.0
firms (i.e., no shareholders) are driving growth, while the 800
industry overall is starting to run low on its drilled-but-
600 10.0
uncompleted (DUC) leftovers to maintain production.
Pledges to stay conservative may become harder to
400
maintain with continued high prices, and the argument
9.0
“how can we create shareholder value if we don’t drill?” is 200
gaining relevance. American international oil companies
(IOCs) and large independents are buying the acreage of 0 8.0
Jan-17 Aug-17 Mar-18 Oct-18 May-19 Dec-19 Jul-20 Feb-21 Sep-21 Apr-22 Nov-22 Jun-23
their European counterparts as the latter quietly exit the
market. Therefore American IOCs must be optimistic that Wells completed Global shale
shale remains a viable investment.
Source: KAPSARC, September 2021.Demand Supply Risk Balances Prices
26 www.kapsarc.org KAPSARC Oil Market Outlook
Non-OPEC (tight oil and oil sands)
A bright spot for oilsands is the opening of the Enbridge producers. Since this product is not considered crude, it the COVID-19-related price collapse of 2020, and
Line 3 pipeline on October 1, which will allow 760 falls outside any import quotas and evades some import moderate to a slower 150 Kb/d in 2022. Compared with
Kb/d to flow from Alberta into the U.S. pipeline system, taxes. While it is used primarily for producing asphalt, last quarter’s forecast, this is slightly up for 2021, as
replacing and expanding some existing export capacity. there could be a shift toward this option if Chinese Q3 showed a significant improvement over Q2. Going
This is a welcome respite for oilsands producers, who quotas begin to bite. forward, reduced investment and logistics are the real
are constantly worried about transportation problems. limiting factors, so there is little change to the near-term
However, there is still a need for more and better Oil sands output in 2021 is expected to rise by about upside for oilsands growth.
pipelines to offset the use of expensive rail options to 300 Kb/d, helped by a recovery from shut-ins following
the U.S. and the Pacific. The Trans-Mountain Pipeline
Extension to the Pacific would be of great help in
expanding the market for oilsands, but there have been Oil sands, MMb/d
delays and protests, with the most recent blow coming 3.35
in the form of the pipeline extension losing its insurer.
Chubb Insurance exited the oilsands market after public 3.30
pressure, along with many other insurance providers
3.25
over the last year, making running and operating
projects more difficult and/or expensive. 3.20
Environmental concerns around oilsands are nothing 3.15
new, but the upcoming COP26 meeting may prove a
particular challenge for the oilsands industry. There 3.10
is a stark contrast between the industry’s outwardly
3.05
progressive and socially conscious image and the
extremely heavy and carbon-intensive products it
3.00
produces. Therefore, how the Canadian delegation
proceeds will be interesting to watch. Environmentally 2.95
sensitive European IOCs reduced their exposure to
oilsands well before they began to do so with U.S. 2.90
Q1 Q2 Q3 Q4 Q1 Q2 Q3 Q4 Q1 Q2 Q3
shale. 2021 2021 2021 2021 2022 2022 2022 2022 2023 2023 2023
On a final positive note, bitumen exports to China could
Source: KAPSARC, September 2021.
be the beginning of a growing option for CanadianYou can also read