Journal of Public Transportation
←
→
Page content transcription
If your browser does not render page correctly, please read the page content below
Journal of Public Transportation 24 (2022) 100019

                                                           Contents lists available at ScienceDirect

                                                   Journal of Public Transportation
                                    journal homepage: www.journals.elsevier.com/journal-of-public-transportation

People-focused and near-term public transit performance analysis
Alex Karner
                                                                                                                                                     ]]
                                                                                                                                                    ]]]]]]
                                                                                                                                                          ]]

The University of Texas at Austin, United States

A R T I C L E      I N F O                         A B S T R A C T

Keywords:                                          Public transit ridership forecasts have long played a role in understanding the potential success of a policy or
Performance management                             investment, but their limitations have led researchers and practitioners to identify other performance analysis
Accessibility                                      approaches. Accessibility, or the ease of reaching opportunities, has become very popular and widely used for
Revealed behavior                                  this purpose. But commonly used accessibility measures also embody weaknesses that are seldom acknowledged;
Cumulative opportunities
                                                   these limit their utility for truly understanding the benefits of transit investments. In this paper, we identify the
Near-term forecasting
                                                   pros and cons of these competing approaches and offer a third strategy. Specifically, we describe how revealed
                                                   travel behavior data, potentially combined with near-term forecasts, can provide information about how current
                                                   public transit users will be affected by a new project. While acknowledging the limitations of this approach, we
                                                   demonstrate how accessibility can be misleading when applied without an understanding of ridership patterns.

1. Introduction                                                                      traditional cost-benefit measures, that can be used to compare between
                                                                                     possible investment strategies and/or service changes.
    How should practitioners determine whether a particular public                       Accessibility-based approaches, sometimes referred to as freedom
transit capital investment or service change is good? This question is               analyses (Walker, 2018), are also very common in practice. Drawing
omnipresent in public transit, since budgets are usually highly con-                 from the vast academic literature on accessibility (e.g., Geurs and van
strained, needs often outstrip what can feasibly be done, and the public             Wee, 2004; Handy and Niemeier, 1997; Páez et al., 2012), this ap-
holds transit projects to a higher standard than highway investments.                proach identifies the ease of reaching opportunities as the most im-
Because public transit’s subsidies are much easier to track, the public              portant benefit of a transportation system (see also Martens, 2012,
demands a higher level of accountability in their expenditure. A cynic               2016). Typical implementations count the number of available oppor-
would argue that political considerations dominate transit investment                tunities (e.g., jobs, square feet of retail space, number of medical fa-
decisions, and they would not be wrong (e.g., Hamer, 1976; Kain, 1990;               cilities) within a travel time threshold (e.g., 45 min) of every origin
Pickrell, 1992). But demonstrating that a rational basis exists for de-              location where walking to public transit service is viable. With ad-
termining how public transit investments can be prioritized and making               vances in data availability through the General Transit Feed Specifi-
those methods more widely available to the public can diminish the                   cation (GTFS) standard, as well as in open-source and/or widely
influence of rank politics over time.                                                available network routing software such as OpenTripPlanner, travel
    Two approaches to public transit performance analysis are prevalent              times throughout a network can be easily generated (Farber and Fu,
today: (1) ridership forecasting and (2) access to opportunities (com-               2017; Karner, 2018). Accessibility can be assessed for existing condi-
monly referred to as accessibility or freedom) analyses. Ridership fore-             tions (Levinson, 2013; Allen and Farber, 2019) and for proposed system
casting involves combining estimates of demographics, transit levels of              changes (Pereira, 2019). In each case, results can be summarized for
service, land use, and ridership to calibrate statistical models that                population groups to determine their average accessibility levels
match observations in a base year. These models are subsequently ap-                 (Rowangould et al., 2016). In contrast to ridership forecasting, acces-
plied to a future year to generate ridership estimates. Decades of                   sibility analyses do not require information about future demographics
practice have emphasized the importance of forecasting future travel                 and land uses, although such data could be employed if available.
demand and guiding near-term decisions using estimates of long-term                      When evaluating public transit system performance, these two ap-
performance, even though forecasts often turn out to have been in-                   proaches embody multiple shortcomings that will be discussed further
accurate (Voulgaris, 2020a; Flyvbjerg et al., 2005). Nevertheless, ri-               below, but it is important to note that a third approach is available that
dership estimates facilitate the creation of performance estimates, like             has many inherent advantages: current-year analysis. Assessing

    E-mail address: alex.karner@utexas.edu

https://doi.org/10.5038/2375–0901.23.2.1

Available online xxxx
1077-291X/© 2022 The Author(s). Published by Elsevier Inc. CC_BY_NC_ND_4.0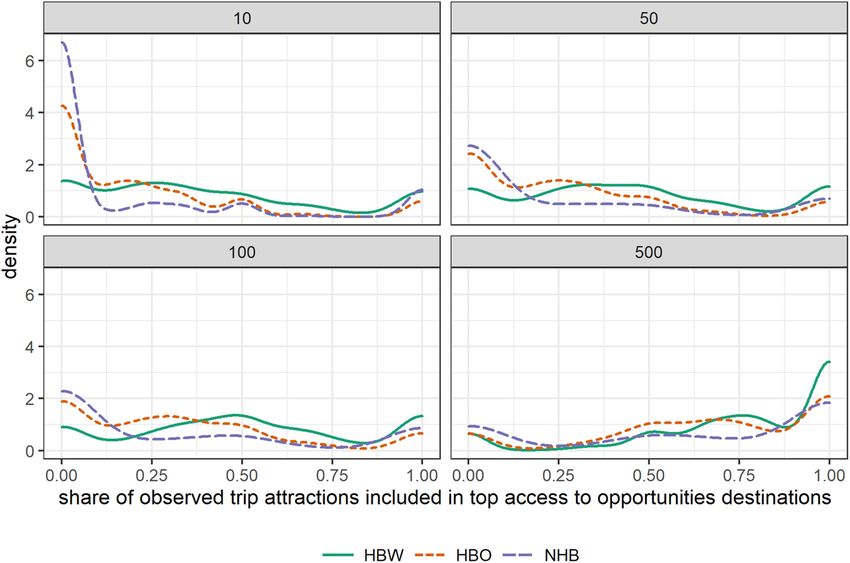
A. Karner                                                                                                        Journal of Public Transportation 24 (2022) 100019

proposed performance in the current year requires a good under-                  • Reliance on complex “black box” models. Travel demand models
standing of who is using public transit in a region for what purpose,              are inherently and increasingly complex. They are difficult for the
usually gleaned from a high-quality (i.e., statistically controlled and            lay public to understand, creating a barrier to public involvement
properly expanded) transit rider survey. The rider survey can be used to           (Handy, 2008; Marcantonio and Karner, 2014). Consultants are
calibrate a ridership model or to examine how a network change will                often relied upon to complete and analyze model runs, taking de-
affect existing travelers by looking at differences in their before/after          cision-making power away from the public agencies tasked with
trip characteristics including travel time, waiting time, number of                transportation decision-making.
transfers, overall utility, and so on. Current-year model estimates can
also be compared to observed behavior data to understand uncertainty             • Expensive   software. The industry has coalesced around several
and inform the interpretation of long-range projections. In analyzing              vendors who provide the base software upon which travel demand
applications to its Capital Investment Grant (CIG) program, the US                 models are run (including Bentley Systems, Caliper Corporation,
Federal Transit Administration requires sponsors to assess project per-            PTV Group, and INRO). The software is objectively expensive to
formance based on current conditions; future-oriented analyses are                 operate and maintain, with annual licenses typically costing thou-
conducted only at the option of the sponsor (FTA, 2016).                           sands of dollars.
    In the interests of contributing to the debate and improving public
transit performance analysis, this paper argues that the prevailing ap-             If these limitations are acknowledged and understood, model-based
proaches embody underappreciated shortcomings. First, those short-              projections can be exceptionally worthwhile, helping stakeholders un-
comings are documented with reference to ridership forecasting and              derstand how decisions made today are likely to affect future outcomes,
typical access to opportunities approaches. An empirical example fol-           at least in terms of their magnitude and direction. It is also possible to
lows. The final section makes the case for near-term analyses focused on        assess a projection’s quality; some are better than others, especially
the decisions that current travelers actually make, while engaging with         when certain criteria are met and addressed (Voulgaris, 2019). The
some of the criticisms this approach has faced from elsewhere in the            Federal Transit Administration (FTA) has led an effort to standardize
field. In the conclusions, some reflections are offered on the future of        public transit ridership forecasting by developing a tool called Simpli-
public transit performance analysis.                                            fied Trips-on-Project Software (STOPS). Through standardization, one
                                                                                of the major limitations of model-based projections can be mitigated,
The trouble with forecasts                                                      specifically the tendency to manipulate input data to obtain desired
                                                                                outcomes.
    In the language of demography, projections are conditional state-               STOPS also serves a regulatory purpose. It represents one approach
ments about the future dependent on the veracity of the input data and          that CIG applicants can use to prepare FTA’s required current-year ri-
the posited relationships between inputs and outputs, whereas forecasts         dership forecast (FTA, 2016). Making near-term instead of longer-term
are a demographer’s best guess as to the future that will come to pass          projections generates multiple benefits. In describing its use of current-
(e.g., Smith et al., 2013). One key difference in whether transportation        year forecasts, FTA states that
professionals are presenting projections or forecasts involves how they            project evaluation based on existing conditions provides the most
perceive their role or how they are expected to comport themselves                 easily understood, most reliable, and most readily available in-
based on the needs and requirements of their organization and/or their             formation for decision-making…Use of current year data increases
superiors (Howe and Kaufman, 1979; Wachs, 2001). While discussions                 the reliability of the projected future performance of the proposed
of ethics have shifted to favor presenting multiple scenarios/projections          project by avoiding reliance on future population, employment, and
and interpreting their tradeoffs for the public, much of practice still            transit service levels that are themselves forecasts (FTA, 2016, 10).
involves presenting a single forecast and defending its accuracy
(Klosterman, 2013; Wachs, 2001; Voulgaris, 2019).
    There are multiple reasons why a single forecast is unlikely to be          Access to opportunities and “freedom” as an alternative
correct. And ample empirical evidence exists documenting that public
transit ridership forecasts are almost always overestimated (Flyvbjerg              The well-known issues with forecasting have generated demand for
et al., 2005). Travel demand models—the workhorse tool within                   different performance assessment methods. If we cannot reliably pre-
transportation planning and the source of most public transit ridership         dict the number of riders on public transit in the future, what should
estimates—embody many well-known limitations. But these limitations             planners and concerned members of the public do? Many have begun to
are seldom acknowledged by practicing transportation planners and               turn to accessibility measures that give a sense of how easily destina-
travel demand modelers when communicating results. These include                tions can be reached before and after a project or system change. These
the following:                                                                  types of analyses need not rely on uncertain future projections and
                                                                                require only information about the proposed changes (and optionally
 • Importance of input data. Projecting travel demand for any mode              demographic data).
   requires information about future land uses, demographics, and                   Accessibility indicators have substantial theoretical appeal as they
   infrastructure. It is these inputs that often drive model outputs re-        are rooted in the notion of travel as a derived demand and reflect
   gardless of paradigm (four-step, activity based, sketch planning,            transportation’s fundamental purpose (Levine et al., 2019). People
   etc.). Because of the importance of input data, models can be easily         travel not for its own sake, but to reach opportunities—accessibility
   made to produce estimates that make projects appear maximally                indicators capture the extent to which these connections are possible.
   (un)attractive and systematic mischaracterizations are common                Well-designed accessibility measures are powerful planning tools; they
   (Flyvbjerg et al., 2005; Wachs, 1989), although the situation may be         recognize that both transportation (e.g., increasing travel time, relia-
   improving in the United States (Voulgaris, 2020b).                           bility, affordability, or comfort) and land use (e.g., increasing density or
                                                                                diversity) interventions affect transportation system performance and
 • Inability to anticipate unexpected events. Related to issues                 travel demand (Handy and Niemeier, 1997). New methods for evalu-
   with input data, broader socioeconomic shifts (e.g., recession/              ating accessibility and a proliferation of data sources are rapidly ex-
   depression, employment by sector, pandemic) and demographic                  panding the frontier of accessibility analysis.
   changes, such as the suburbanization of poverty, are difficult to                Cumulative opportunities measures are by far the most widely applied
   predict with any degree of accuracy, yet they fundamentally drive            accessibility measures in practice and in academic research (e.g., Golub
   future outcomes.                                                             et al., 2013; Golub and Martens, 2014; Owen and Levinson, 2014).

                                                                            2
A. Karner Journal of Public Transportation 24 (2022) 100019
These quantify the opportunities that can be reached from a given as travel time changes can also be calculated and similarly interpreted
origin location, are calculated for a geographic unit (e.g., census tracts (e.g., Manaugh and El-Geneidy, 2012).
or block groups), and most often use constant travel time thresholds Beyond the Dublin example, the popularity of cumulative opportu-
(e.g., number of destinations reachable within a 45-minute door-to- nities accessibility measures can be seen in the sheer number of soft-
door public transit trip) rather than information about how people ware vendors and open-source solutions available for measuring and
travel. assessing accessibility under different circumstances, as well as their
A representative example of the cumulative opportunities–based widespread use. CUBE Access and Remix are both examples of com-
approach is the analysis undertaken by Jarret Walker and Associates for mercially available software for calculating cumulative opportunities
the Dublin bus network redesign (Jarrett Walker + Associates, 2018). accessibility, isochrones, and similar measures. Open-source solutions
Bus network redesigns are becoming increasingly common. They typi- include OpenTripPlanner Analyst and the Python Pandana library.
cally seek to increase the number of high-frequency routes while Examples in practice abound and include the Puget Sound Regional
keeping an agency’s operating budget constant. This change usually Council’s (2018) regional transportation plan (Puget Sound Regional
requires cutting peripheral service and redirecting resources saved into Council, 2018), Virginia Department of Transportation’s SMART SCALE
routes likely to generate additional riders. The Dublin example shows project prioritization process (Virginia Department of Transportation,
how changes in cumulative opportunities can be assessed before and 2020), and the University of Minnesota Accessibility Observatory
after a proposed system change. (Owen and Levinson, 2014).
Chapter 8 of the Dublin redesign’s 2018 Public Consultation Report Despite the widespread popularity and mass appeal of cumulative
is entitled “Network Outcomes.”1 It presents two types of analyses. The opportunities measures and isochrones, they embody two major lim-
first tallies changes in the number of people and jobs located within itations for understanding infrastructure and policy impacts that are
walking distance of frequent public transit. The second calculates scarcely acknowledged in the literature or in practice. These include the
multiple different cumulative opportunities measures, providing esti- following:
mates of changes in the number of jobs accessible within specified
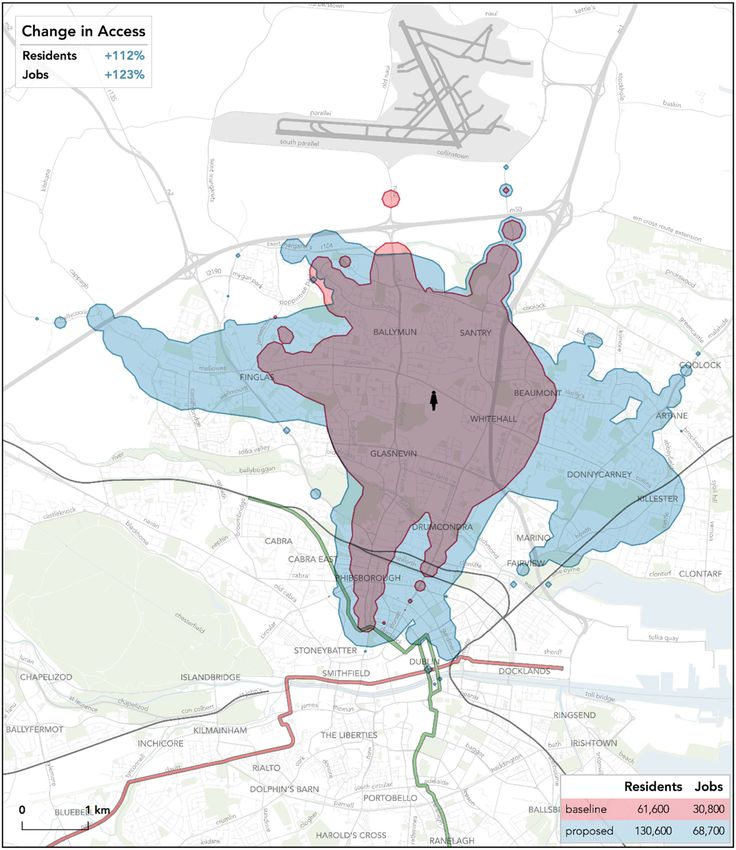
travel time thresholds. Fig. 1 shows a sample of the results, which • Limited utility for assessing regional benefits. As demonstrated
summarizes the change in the number of jobs accessible within 30 min in the Dublin example, isochrone maps can be prepared that show
from origins located near transit stops in Dublin. the number of destinations that can be reached from any origin
Fig. 1 also summarizes the number of jobs accessible from every location in a region. These types of maps can be profoundly useful
origin location, but it does not demonstrate precisely which jobs are for individuals and businesses seeking to understand how a change
accessible. This information is contained in several appendices to the in transit service will affect their ability to reach opportunities or
report that summarize the spatial reach of public transit from one origin customers (e.g., Stewart, 2017). Population-weighted average
using isochrones. An example isochrone map is shown in Fig. 2. The changes in accessibility can also be calculated, but these do not
utility of such a map is clear for area residents who have cause to travel represent user benefits in the traditional sense since changes may or
to or from the origin location shown; they can clearly see how a pro- may not be well aligned with the trips people want or need to make.
posed service change will affect their ability to reach specific places. All
possible isochrones (each appendix contains ~70 pages with one iso- • No integration of public transit market information. The limited
chrone each) can be summarized using a map like Fig. 1. This approach utility of a regional benefit analysis based on access to opportunities
loses directional information but enables one to visualize broader re- arises in part because of the absence of information about the public
gional trends. transit market. It is entirely possible to imagine a scenario where
Fig. 1's results can also be further summarized to generate regional apparent accessibility increases substantially for large numbers of
performance measures. For example, one of the key conclusions for people because of a proposed capital improvement or service change
Dublin is that, “On average, Dubliners would be able to reach 18% more but where the actual/future transit market is quite weak. If such an
jobs in 30 min of travel time than today” (Jarrett Walker + Associates, investment or change is pursued on the grounds that it will increase
2018, 155). Although equations are not presented, this result is de- accessibility, it could ultimately perform worse in terms of helping
scribed as a change in a population-weighted accessibility score. This people reach their destinations by public transit than a comparable
approach is commonly applied in the literature and is a reasonable way change whose apparent access to opportunities benefit is smaller.
to summarize the average accessibility change experienced by a ran-
domly selected resident. It can be calculated for different groups of One immediate way to address these weaknesses is to refocus the
interest (e.g., Golub and Martens, 2014; Rowangould et al., 2016). analysis to consider who is using public transit today, for what purpose,
Despite its ubiquity, population-weighted accessibility is an im- and for what destination. These types of analyses are addressed in the
precise measure of the benefits of a public transit improvement because next section.
it is not linked to the trips that people want or need to make (see also
Karner and Golub, 2015; Farber et al., 2016). In traditional travel be- People-focused near-term analyses as an antidote
havior analysis, differences in the relative attractiveness of trip-mode
combinations before and after a change are assessed and converted to The central tenet of the near-term analysis focused on users pro-
equivalent time or money units, then interpreted as a measure of con- posed here is that, in order to understand public transit system per-
sumer surplus (e.g., Niemeier, 1997; de Jong et al. 2007). These dif- formance, one must have a well-developed understanding of current
ferences can be interpreted as a measure of the “user benefits” of a public transit riders and their travel patterns so that changes in trip
proposed system change (e.g., Chorus and Timmermans, 2009). Con- characteristics, overall utility, or consumer surplus can be calculated.
veniently, they also represent changes in the ease with which oppor- This perspective is surprisingly absent from contemporary transit per-
tunities can be reached—an alternative measure of accessibility (Handy formance analyses, despite the ongoing importance of assessing quan-
and Niemeier, 1997; Geurs and van Wee, 2004). Simpler measures such tities such as changes in travel time and utility/consumer welfare across
planning practice (e.g., Manaugh and El-Geneidy, 2012; Niemeier,
1997; Martens and Di Ciommo, 2017).
1
This document is also referred to as the Revised Network Report June 2018. It This absence can be explained in part by the withering criticism
was revised again in October 2020 to reflect responses to public feedback and leveled at measures derived from revealed or modeled behavior from
changes in network design. The performance measures presented in both the various sources in the literature. Without exception, these sources argue
2018 and 2020 versions are very similar. for access to opportunities approaches without acknowledging their
3
A. Karner                                                                                                         Journal of Public Transportation 24 (2022) 100019

   Fig. 1. Change in number of jobs and students accessible within 30 min due to the Dublin bus network redesign (Jarrett Walker + Associates, 2018, 162).

inherent limitations. For example, Pereira et al. (2017) highlight the           be understood in context. More travel at baseline can be positive or
important role of constraints that exist outside of individual/household         negative. But a proposed system change that reduced commute times
control. These constraints (residential location, income, family struc-          for women more than men given existing travel patterns, or that en-
ture, mandatory activity locations, etc.) interact with preferences to           hanced available travel choices for women at a high rate, would pro-
determine revealed travel behavior outcomes. They argue that revealed            vide valuable information to the public and decision-makers about
behaviors that seem to indicate disadvantage, such as long commute               transportation system benefits. Changes are more straightforward to
distances, can only be considered problematic to the extent that they            interpret than baseline conditions.
arise because of constraints.                                                        Martens and Golub (2018) and Pereira et al. (2017) raise issues
    The notion of constraints versus preferences is important but can be         related to travel patterns shifting over time as locations of family,
thoughtfully addressed. One simply needs to determine the appropriate            friends, and mandatory activity locations also shift. Walker (2018, 125)
criteria that can be used to segment the population and home in on the           makes the point most strongly, asking:
group of interest. For example, it has long been understood that some
                                                                                    When you went shopping at a particular store, does it matter that
public transit users have no other option while others freely choose to
                                                                                    you could have gone shopping somewhere else, or shopped online
ride (Garrett and Taylor, 1999; Taylor and Morris, 2015). Other work
                                                                                    while in bed, or embraced an ascetic spiritual path of buying as little
has differentiated between car-less (constrained) and car-free (choice)
                                                                                    as possible? A study of freedom would be intensely interested in
households using responses to attitudinal questions on a household
                                                                                    that, while conventional planning would merely record what you
activity survey (Brown, 2017). That work has demonstrated both so-
                                                                                    did and use that to predict what you, despite your illusion of
cioeconomic as well as travel behavioral differences between house-
                                                                                    freedom, will continue to do. (emphasis in original).
holds that choose to not have a vehicle and those that wish to but
cannot. Simply grouping all zero-vehicle households or all public transit            This line of argumentation misapprehends the nature of planning-
users together to calculate performance measures is inappropriate, but           related analysis and falls prey to the individualistic nature of the iso-
with care, relatively homogeneous groups can be identified, and their            chrone. When assessing regional transportation plan performance,
characteristics studied.                                                         outcomes for individuals are never of concern. Instead, analysts ag-
    Another similar issue that is sometimes raised is the problem of             gregate results over population groups, places, or the entire region to
comparing baseline conditions between groups. Levine et al. (2019, 9)            determine performance. Even though an individual’s travel patterns
describe a hypothetical situation in which women are found to have               will likely change as circumstances change, including many different
shorter commute times than men. In this case, they state that we should          people and their (revealed) travel within a single performance measure
not conclude that women derive outsize benefits from the existing                ensures that the measures capture these variations in behavior. For the
transportation system. This is correct; differences between groups must          same reason, travel surveys collected on a single day are used to

                                                                             4
A. Karner Journal of Public Transportation 24 (2022) 100019
Fig. 2. Isochrone map showing gained (blue), lost (red), and retained (overlapping blue and red) 30-min cumulative opportunities accessibility from Dublin City
University – Main Campus under the Dublin bus network redesign (Jarrett Walker + Associates, 2018, Appendix A1). (For interpretation of the references to color in
this figure legend, the reader is referred to the web version of this article.)
estimate regional travel demand models. Even though individual travel suppressed (Lovejoy, 2012; Nordbakke and Schwanen, 2015; Pereira
patterns change from day to day, a random sample of individuals drawn et al., 2017). This is also a fair point; given different circumstances,
for a single day will reproduce regional travel patterns in all their individuals facing transportation-related constraints would be likely to
complexity. make different decisions. But this is where high-quality travel models
Another argument against revealed behavior measures is that they can play an important role by supporting near-term analysis (either for
do not consider foregone trips or travel demand that might be the current year or one to five years from the present). The effects of
5A. Karner Journal of Public Transportation 24 (2022) 100019
Fig. 3. Kernel density plots illustrating the share of observed trip attractions (taken from the transit rider survey) found in the top N destinations that compose the
access to opportunities score. Each panel shows results for N values of 10, 50, 100, and 500. HBW = home-based-work, HBO = home-based-other, NHB =
non–home-based.
changes in level of service on various modes or changes in socio- understanding of current inequities, the thinking goes, transport policy
economic conditions can be simulated. What if all low-income house- and infrastructure decision-making cannot be expected to mitigate
holds were suddenly given cars? What if local bus service suddenly them. The second is that near-term analyses mitigate many of the
became more attractive? How would these changes shift travel patterns shortcomings known about long-range forecasting. The difficulty of
and reveal potentially suppressed demand? At the end of the day, in- projecting future land use characteristics and demographics, for ex-
dividuals have to make decisions about where to travel and when. ample, is not at all relevant when conducting near-term analyses since
In addition to these critiques, there are also real challenges asso- those characteristics can reasonably be expected to be similar to those
ciated with collecting revealed behavior data. Cost is a key factor. that prevail today. Further, a near-term forecast can supplement and
Obtaining high-quality, statistically controlled transit rider survey data inform long-range efforts by providing valuable comparative informa-
can be expensive. A completed survey record can cost upwards of $50 tion about model uncertainty.
when costs associated with survey design, data collection, cleaning, and
expansion are considered (Schaller, 2005). Other issues that plague An empirical example
transportation data collection, such as survey fatigue, are less relevant
here since prospective survey respondents can easily be found on transit To demonstrate some of the fundamental differences between re-
vehicles, as well as at stops and stations. Nevertheless, transit rider vealed behavior and access to opportunities measures, we calculated a
survey data collection methods continue to advance, and such data performance measure using multiple data sources representing travel
collection is mandated by FTA for large public transit agencies, as part behavior and public transit level of service within the Metropolitan
of their Title VI program (FTA, 2012). Passively collected data har- Transit Authority of Harris County (colloquially known as Houston
vested from cell phone and global positioning system traces can also be METRO), roughly encompassing Harris County, Texas (USA) and the
used to evaluate various aspects of public transit service and ridership city of Houston. The performance measure assesses the correspondence
(Welch and Widita, 2019), but collected data are not representative of between an origin’s most important destinations (as revealed using a
the general population and demographic information is almost always high-quality transit rider survey) and the destinations contributing most
missing (Chen et al., 2016; Wang et al., 2018). Smartphones also show to an origin’s access to opportunity score. Full details regarding data
some promise for collecting data traditionally gleaned through travel or sources and methods are provided in the Appendix.
activity diaries (Faghih Imani et al. 2020). In concept, the performance measure calculation proceeded as fol-
There are also two major benefits associated with people-focused lows. For each block group in Harris County, a cumulative opportu-
near-term analyses. The first is that public and transportation equity nities measure was calculated. In this case, the measure was the total
advocates appear to be quite interested in how transportation infra- number of jobs accessible using public transit within 45 min, con-
structure investments and policy choices will affect the traveling public sidering average performance across AM peak period, midday, and PM
given their current travel patterns (Marcantonio and Karner, 2014). peak period travel times. For each of these three periods, four randomly
From the perspective of these advocates, inequities already exist within selected departure times were used to estimate total travel time by
the current system. These are reflected in racial and class differences in public transit (including walking to the transit stop, waiting for the
terms of mode share, level of service, exposure to pollution, noise, and vehicle, in-vehicle travel time, any necessary transfers, and walking
other transport-related externalities (Karner et al. 2018). Without an to the destination) to each reachable destination. This step resulted in
6A. Karner Journal of Public Transportation 24 (2022) 100019
12 matrices representing travel time between all regional origins and clear that simply increasing the accuracy, precision, or behavioral fi-
destinations at different times of day. Job totals were associated with delity of a specific measure is not a desired end. Rather, our emphasis is
each destination block group. For each origin, at each time slice, the top on developing performance measures that are meaningful. One key di-
N destinations contributing most to that origin’s accessibility score were mension of meaning, as applied in this paper, is the extent to which a
identified. For the purposes of demonstration, N was set to 10, 50, 100, performance measure is linked to impacts on people and their travel.
and 500. Whereas access to opportunities measures the extent to which people
Each block group with a transit trip production as identified in the can in principle reach opportunities, such measures are substantially
rider survey was associated with its attraction block groups. To be clear, limited in their ability to reveal how—across an entire region—the
while the cumulative opportunities measure identifies a destination as benefits and burdens of a transportation system change are likely to be
reachable if it is possible to travel there within 45 min on public transit, distributed or felt. Near-term analyses should also be preferred in that
the rider survey data only identifies a production-attraction interchange they produce results subject to much less uncertainty than longer term
where a trip was actually made. forecasts.
Once these two lists were assembled—the top N destinations con- No performance measure or analytical approach will ever be com-
tributing to the cumulative opportunities score and all attraction trip pletely accurate or provide absolutely definitive information about
ends visited from a production end—we calculated the share of ob- whether one course of action should be chosen over another.
served trip attractions accounted for in the top access to opportunities Transportation decision-making processes are intensely political ex-
destinations for three trip types: home-based-work, home-based-other, ercises, involve the expenditure of substantial amounts of public funds,
and non–home-based. Fig. 3 summarizes these results using kernel and create winners and losers. There is potentially a role for each of the
density plots for the shares of observed trip attractions found in the top analytical approaches described in this paper during different types of
N destinations contributing to an origin’s accessibility score. Results are planning activities.
shown for four values of N (10, 50, 100, and 500). The area under the One additional limitation of a near-term analysis focused on people
curve between any two points along the x-axis represents the propor- is that any proposed changes to public transit in a region could have
tion of all trip origins that have shares within that range. real impacts on future-year origin destination travel patterns. Clearly,
The results shown in Fig. 3 achieve face validity. As N increases, an analysis focused on current-year travel will not capture these. A
shares tend toward one. This is sensible; as the list of destinations future-year forecast could capture these types of changes, but access to
contributing to an accessibility score grows, the likelihood that actually opportunities proponents would argue that long-range ridership fore-
chosen destinations will be included in the list also grows. In general, casting will always come with high uncertainties and questions about
non–home-based and home-based-other trips see fewer of their attrac- likely accuracy, so their approach is to be preferred (Walker, 2018). But
tion locations represented in the most important cumulative opportu- even access to opportunities approaches build in uncertainty arising
nities destinations. The density curves for these two trip types plot from how precisely zone-to-zone travel times will change, incomplete
higher on the y-axis at zero, indicating that there are relatively higher pedestrian networks, and potential demographic changes.
numbers of block groups whose destinations are not reflected in the While it is indeed true that travel forecasting models have per-
most important contributors to access to opportunities. This too appears formed poorly in the past, this realization is an argument for improving
reasonable, as home-based-work trips will tend toward the major em- travel models so that they are more relevant to the decision-making
ployment destinations that contribute most to accessibility scores. process, not ignoring the insights they provide. If long-range person-
Other trip purposes are more likely to be dispersed and not well re- based analyses are performed, an analyst should also prepare a near-
flected in the aggregate nature of a cumulative accessibility measure. horizon or even current-year analysis, as this may help planners, ana-
These results demonstrate a conceptual mismatch between the lysts, and the public understand the uncertainties associated with long-
places to which people need to travel, and the locations identified as range forecasting, by examining the differences between observed and
most important within a typical accessibility analysis. The purpose of predicted behavior.
this empirical example is not to discredit commonly used accessibility
measures, but rather to highlight the value of an alternative approach
Declaration of Competing Interest
grounded in real-world travel behavior, aligned with trips actually
made.
The authors declare that they have no known competing financial
interests or personal relationships that could have appeared to influ-
Discussion and conclusions
ence the work reported in this paper.
Assessing transportation system performance under both base con-
ditions and alternative scenarios has been of interest to the profession Acknowledgments
for decades. Yet not all performance analysis methods are created
equal. Within public transit performance analysis, the literature and This work was supported by the Federal Transit Administration
practice seem to be converging on the consensus that cumulative op- under cooperative agreement TX-2017-087-00. Note that the opinions
portunities approaches are the preferred method both for commu- expressed herein are those of the author; they are not endorsed by any
nicating information to the public and determining whether certain government agency or third party. Ken Cervenka provided valuable
investments are worth pursuing. However, the downsides of these insights and feedback on early drafts. Three anonymous reviewers
analyses are almost never reported. provided helpful comments that improved the paper. Any remaining
Importantly, the discussion presented in this paper should make errors or omissions are the author's alone.
Appendix
The data used in the empirical example presented in this paper were gleaned from multiple sources, including:
• A production-attraction matrix from the 2017 transit rider survey conducted by the Houston-Galveston Area Council (H-GAC) and Houston
METRO. These data were collected between February and May 2017, two years after Houston’s comprehensive bus network redesign.
• Job location information from the US Census Bureau’s 2017 Longitudinal Employer-Household Dynamics Origin-Destination Employment
Statistics.
7A. Karner Journal of Public Transportation 24 (2022) 100019
• Travel times between all census block group origins and destinations in Harris County, Texas, calculated using OpenTripPlanner. To represent
travel on a typical weekday, we randomly sampled four departure times within 15-minute windows across three one-hour periods to represent the
morning peak (8–9 am), midday (12–1 pm), and the evening peak (5–6 pm). This resulted in 12 separate estimates of travel times that can be
combined to produce representative accessibility estimates.
We employed the cumulative opportunities accessibility measure described in Eqs. (A1)–(A3):
J
Aik = Oj f (cijk )
j=1 (A1)
1 cijk T
f( )=
0 cijk > T (A2)
Ai = med (Aik ) k (A3)
where Aik is the accessibility score for block group i at departure time k; Oj is the number of jobs at each destination block group j; J is the total
number of block groups; cijk is the travel time between block groups i and j at departure time k (considering walk access, waiting, in-vehicle, transfer,
and walk egress times); T is the desired travel time threshold; and med is the median operator. For this application, T is set to 45 min.
This formulation of Ai is widely used in the literature and practice and is readily interpretable as the number of opportunities that can be reached
from each origin location within the travel time threshold. Calculating accessibility first for each departure time, and then subsequently taking the
median to represent an origin’s score, is preferable to first averaging travel times between origins and destinations and then calculating accessibility.
The former approach yields a more reasonable approximation of travel time between origins and destinations; locations with an infrequent but fast
connection may generate only a single travel time within the set of 12 because an upper threshold on calculated travel times is typically set by the
analyst to make the computations tractable (e.g., two hours). If travel times are simply averaged, origins and destinations with infrequent but fast
connections will appear to have a higher level of service than is actually the case.
The final performance measure summarized in the empirical example requires identifying sets of destinations using both the transit rider survey
data and the accessibility dataset. We used a block-group trip table in production-attraction format to mimic how access to opportunities is typically
associated with residential locations. In this format, the location of an attraction (e.g., a person’s workplace) would be associated with two trips from
the person’s production location (i.e., home). For home-based-work and home-based-other trips, this approach ensures identification of the most
important block groups that people visit from their homes. For non–home-based trips, the production location is where the trip originates, and the
attraction location is the trip destination. In all cases, the fully expanded, linked trip weights were used to tally trips, ensuring that the results
represented a typical day of travel on Houston METRO in 2017.
An intermediate step in the accessibility calculation requires identifying all destinations reachable from each origin. Define ExN as the set of N
destinations contributing the most to a block group’s accessibility score. Defining set E in this way is equivalent to sorting the list of destinations for
each origin block group in descending order and taking the top N elements. For each production block group x, define Dx as the set of all attractions
visited. With these definitions, the summary performance measure for evaluating the congruence between the people-focused measures and access to
opportunities measures can be defined using Eq. (A4):
|Di EiN |
Pi =
|Di | (A4)
where Pi is the share of revealed trip attractions that are accounted for in the top N destinations contributing to a block group’s accessibility score.
As N increases, Pi approaches unity.
References Flyvbjerg, B., Skamris Holm, M.K., Buhl, S.L., 2005. How (In)Accurate Are Demand
Forecasts in Public Works Projects?: The Case of Transportation. J. Am. Plan. Assoc.
71 (2), 131–146.
Allen, J., Farber, S., 2019. Sizing up transport poverty: a national scale accounting of low-
FTA (Federal Transit Administration), 2012. Circular FTA C 4702.1B: Title VI
income households suffering from inaccessibility in Canada, and what to do about it.
Requirements and Guidelines for Federal Transit Administration Recipients. US
Transp. Policy 74, 214–223.
Department of Transportation, Washington, DC.
Brown, A.E., 2017. Car-less or car-free? Socioeconomic and mobility differences among
FTA (Federal Transit Administration), 2016. Final Interim Policy Guidance Federal
zero-car households. Transp. Policy 60, 152–159.
Transit Administration Capital Investment Grant Program. US Department of
Chen, C., Ma, J., Susilo, Y., Liu, Y., Wang, M., 2016. The promises of big data and small
Transportation, Washington, DC.
data for travel behavior (aka human mobility) analysis. Transp. Res. Part C Emerg.
Garrett, M., Taylor, B.D., 1999. Reconsidering social equity in public transit. Berkeley
Technol. 68, 285–299.
Plan. J. 13, 6–27.
Chorus, C.G., Timmermans, H.J.P., 2009. Measuring user benefits of changes in the
Geurs, K.T., van Wee, B., 2004. Accessibility evaluation of land-use and transport stra-
transport system when traveler awareness is limited. Transp. Res. Part A Policy Pract.
tegies: review and research directions. J. Transp. Geogr. 12 (2), 127–140.
43 (5), 536–547.
Golub, A., Martens, K., 2014. Using principles of justice to assess the modal equity of
de Jong, G., Daly, A., Pieters, M., van der Hoorn, T., 2007. The logsum as an evaluation
regional transportation plans. J. Transp. Geogr. 41, 10–20.
measure: review of the literature and new results. Transportation Research Part A:
Golub, A., Robinson, G., Nee, B., 2013. Making accessibility analyses accessible: a tool to
Policy and Practice, Selected Papers on Applications of Discrete Choice Models
facilitate the public review of the effects of regional transportation plans on acces-
Presented at the European Regional Science Conference, Amsterdam, August 2005,
sibility. J. Transp. Land Use 6 (3), 17–28.
41(9), pp. 874–889.
Hamer, A.M., 1976. The Selling of Rail Rapid Transit: A Critical Look at Urban
Faghih Imani, A., Harding, C., Srikukenthiran, S., Miller, E.J., Habib, K.N., 2020. Lessons
Transportation Planning. Lexington Books.
from a large-scale experiment on the use of smartphone apps to collect travel diary
Handy, S., 2008. Regional transportation planning in the US: an examination of changes
data: the ‘city logger’ for the greater Golden Horseshoe area. Transp. Res. Rec. 2674
in technical aspects of the planning process in response to changing goals. Transp.
(7), 299–311.
Policy 15 (2), 113–126.
Farber, S., Fu, L., 2017. Dynamic public transit accessibility using travel time cubes:
Handy, S., Niemeier, D., 1997. Measuring accessibility: an exploration of issues and al-
comparing the effects of infrastructure (dis)investments over time. Comput. Environ.
ternatives. Environ. Plan. A 29 (7), 1175–1194.
Urban Syst. 62, 30–40.
Howe, E., Kaufman, J., 1979. The ethics of contemporary american planners. J. Am. Plan.
Farber, S., Ritter, B., Fu, L., 2016. Space–time mismatch between transit service and
Assoc. 45 (3), 243–255.
observed travel patterns in the Wasatch Front, Utah: a social equity perspective.
Jarrett Walker + Associates, 2018. Dublin Area Bus Network Redesign: Public
Travel Behav. Soc. 4, 40–48.
Consultation Report. National Transport Authority, Dublin, Ireland.
8A. Karner Journal of Public Transportation 24 (2022) 100019
Kain, J.F., 1990. Deception in Dallas: strategic misrepresentation in rail transit promotion Pereira, R.H.M., 2019. Future accessibility impacts of transport policy scenarios: equity
and evaluation. J. Am. Plan. Assoc. 56 (2), 184–196. and sensitivity to travel time thresholds for bus rapid transit expansion in Rio de
Karner, A., 2018. Assessing public transit service equity using route-level accessibility Janeiro. J. Transp. Geogr. 74, 321–332.
measures and public data. J. Trans. Geogr. 67, 24–32. Pereira, R.H.M., Schwanen, T., Banister, D., 2017. Distributive justice and equity in
Karner, A., Golub, A., 2015. Comparison of two common approaches to public transit transportation. Transp. Rev. 37 (2), 170–191.
service equity evaluation. Transp. Res. Rec. J. Transp. Res. Board 2531, 170–179. Pickrell, D.H., 1992. A desire named streetcar. J. Am. Plan. Assoc. 58 (2), 158–176.
Karner, A., Golub, A., Martens, K., Robinson, G., 2018. Transportation and environmental Puget Sound Regional Council, 2018. The Regional Transportation Plan. ⟨https://www.
justice: history and emerging practice. In: Holifield, Ryan, Chakraborty, Jayajit, psrc.org/sites/default/files/rtp-may2018.pdf⟩.
Walker, Gordon (Eds.), The Routledge Handbook of Environmental Justice. Rowangould, D., Karner, A., London, J., 2016. Identifying environmental justice com-
Routledge, New York, pp. 400–411. munities for transportation analysis. Transp. Res. Part A Policy Pract. 88, 151–162.
Klosterman, R.E., 2013. Lessons learned about planning. J. Am. Plan. Assoc. 79 (2), 161–169. Schaller, B., 2005. TCRP Synthesis 63: On-Board and Intercept Transit Survey Techniques.
Levine, J., Grengs, J., Merlin, L.A., 2019. From Mobility to Accessibility: Transforming Transit Cooperative Research Program, Washington, DC.
Urban Transportation and Land-Use Planning. Cornell University Press, Ithaca, NY. Smith, S.K., Tayman, J., Swanson, D.A., 2013. A Practitioner’s Guide to State and Local
Levinson, D., 2013. Access Across America. Department of Civil Engineering, University Population Projections. Springer, New York.
of Minnesota, Minneapolis, MN. Stewart, A.F., 2017. Mapping transit accessibility: possibilities for public participation.
Lovejoy, K., 2012. Mobility Fulfillment among Low-Car Households: Implications for Transp. Res. Part A Policy Pract. 104 (Suppl. C), S150–S166.
Reducing Auto Dependence in the United States (Ph.D. dissertation). University of Taylor, B.D., Morris, E.A., 2015. Public transportation objectives and rider demographics:
California, Davis. are transit’s priorities poor public policy? Transportation 42 (2), 347–367.
Manaugh, K., El-Geneidy, A., 2012. Who benefits from new transportation infrastructure? Virginia Department of Transportation, 2020. Smart Scale Technical Guide. ⟨http://
Using accessibility measures to evaluate social equity in public transport provision. www.vasmartscale.org/documents/2020documents/rd4-ss-technical-guide-draft-
In: Geurs, Karst T., Krizek, Kevin K., Reggiani, Aura (Eds.), Accessibility Analysis and final-06012020.pdf⟩.
Transport Planning. Edward Elgar, Cheltenham, UK. Voulgaris, C.T., 2019. Crystal balls and black boxes: what makes a good forecast? J. Plan.
Marcantonio, R., Karner, A., 2014. Disadvantaged communities teach regional planners a Lit. 34 (3), 286–299.
lesson in equitable and sustainable development. Poverty Race 23 (1), 5–12. Voulgaris, C.T., 2020a. What is a forecast for? Motivations for transit ridership forecast
Martens, K., 2012. Justice in transport as justice in accessibility: applying walzer’s accuracy in the federal new starts program. J. Am. Plan. Assoc. 86 (4), 458–469.
‘spheres of justice’ to the transport sector. Transportation 39 (6), 1035–1053. ⟨http:// Voulgaris, C.T., 2020b. Trust in forecasts? Correlates with ridership forecast accuracy for
link.springer.com/journal/volumesAndIssues/11116⟩. fixed-guideway transit projects. Transportation 47, 2439–2477.
Martens, K., 2016. Transport Justice: Designing Fair Transportation Systems. Routledge, Wachs, M., 1989. When planners lie with numbers. J. Am. Plan. Assoc. 55 (4), 476.
New York. Wachs, M., 2001. Forecasting versus envisioning: a new window on the future. J. Am.
Martens, K., Di Ciommo, F., 2017. Travel time savings, accessibility gains and equity Plan. Assoc. 67 (4), 367–372.
effects in cost–benefit analysis. Transp. Rev. 37 (2), 152–169. Walker, J., 2018. To predict with confidence, plan for freedom. J. Public Transp. 21 (1),
Martens, K., Golub, A., 2018. A fair distribution of accessibility: interpreting civil rights 119–127.
regulations for regional transportation plans. J. Plan. Educ. Res., 0739456X1879101. Wang, Z., He, S.Y., Leung, Y., 2018. Applying mobile phone data to travel behaviour
Niemeier, D.A., 1997. Accessibility: an evaluation using consumer welfare. research: a literature review. Travel Behav. Soc. 11, 141–155.
Transportation 24 (4), 377–396. Welch, T.F., Widita, A., 2019. Big data in public transportation: a review of sources and
Nordbakke, S., Schwanen, T., 2015. Transport, unmet activity needs and wellbeing in methods. Transp. Rev. 39 (6), 795–818.
later life: exploring the links. Transportation 42 (6), 1129–1151.
Owen, A., Levinson, D., 2014. Access Across America: Transit 2014. Accessibility Alex Karner is an associate professor in the graduate program in community and regional
Observatory, University of Minnesota, Minneapolis, MN. planning at the University of Texas at Austin. He conducts research on transportation
Páez, A., Scott, D.M., Morency, C., 2012. Measuring accessibility: positive and normative equity and accessibility from multiple disciplinary and methodological perspectives.
implementations of various accessibility indicators. J. Transp. Geogr. 25, 141–153.
9You can also read