Investment Banking and Capital Markets Sector - Financial Services Group SUMMER 2022
←
→
Page content transcription
If your browser does not render page correctly, please read the page content below

Financial Services Group
Investment Banking and Capital Markets Sector
U . S . M A R K E T U P D AT E

SUMMER 2022
Review and Outlook:
U.S. Investment Banking and Capital Markets Sector
            Introduction   Houlihan Lokey’s Financial Services Group welcomes you to the newest edition of its semiannual recap of activity in the
                           U.S. investment banking and capital markets sector. What a difference six months makes! When we published our previous
                           report at the end of 2021, we noted early red flags across the sector amid headlines of record full-year fee pool levels. These
                           red flags have since morphed into a full-scale meltdown in some segments of the market. In ECM origination, for example,
                           all-time highs in early 2021 have become all-time lows. In M&A, an unsustainable 2021 fee pool bonanza has unwound, and
                           while year-over-year declines look dismal, a return to pre-COVID-19 M&A levels is hardly a disastrous outcome.

                           History serves as a useful guide for understanding the impact of bear markets and recessionary periods on IB activity. As
                           outlined in the charts on the following slide, the trajectory being traced today is largely consistent with the 2008 credit crisis,
                           the 2012 Eurozone crisis, the 2016 China-driven commodities collapse, and the 2020 COVID-19 dip. However, none of these
                           crises coincided with an inflationary environment, so we expect some differences in how the current downturn may unfold.

ECM Underwriting           ECM underwriting tends to get hit early and get hit hard, which has certainly been the case in 2022. Issuance from every
                           major segment of the market—biopharma, software, SPACs, Asian cross-border listings, and PE exits—collapsed, resulting
                           in the worst half-year for ECM fees in decades. However, ECM also rebounds sharply in the early stages of recovery, and
                           we’ve heard anecdotally from life sciences bankers that an enormous backlog of biopharma offerings is now waiting for an
                           open window. Unlike large-cap software companies, biopharma startups rely on equity issuance to fund working capital
                           needs and do not have the luxury of waiting for an ideal market. Portions of activity have shifted to best-efforts structures
                           like PIPEs and ATMs, but we expect fully underwritten deals to recover relatively quickly—good news for the independent
                           investment banks that often derive 90%+ of their fees from the sector. Software deals will likely return more gradually, with
                           would-be IPO candidates choosing to remain in the safe haven of late-stage VC funding longer.

                           SPACs are almost definitely heading into hibernation again, with just 15 IPOs launched in Q2 2022 compared to more than
                           300 at the height of the market in Q1 2021. In addition to recent de-SPACs’ poor trading performance, the SEC has taken
                           aim at the structure—proposals include removal of the safe harbor for forward projections and increased liability for
                           underwriters. Shortly after the regulatory proposals were unveiled, Goldman Sachs announced its intentions to wind down
                           SPAC activity; the bank’s well-publicized entry and exit from SPAC banking in 2016 and 2022, respectively, likely bookend
                           the latest boom. It’s worth noting that SPACs have existed since the 1990s and have undergone several vanishing acts,
                           always re-emerging in bull markets with a slate of enhanced investor protections and newly humbled sponsors.

Source: Refinitiv.                                                                                                                                               2
Review and Outlook:
U.S. Investment Banking and Capital Markets Sector (cont.)
Some Long-Term Perspective: Rolling Y/Y Fee Pool Growth Since 2005
Credit Crisis EU Crisis Oil Crash COVID-19 Inflation
2007–2009 2011–2012 2015–2016 2020 2021–???
ECM falls sharply 200%
All ECM
but rebounds 150%
equally quickly 100%
50%
0%
-50%
-100%
Mid-market M&A 200%
M&A >$500M
is substantially 150%
M&AReview and Outlook:
U.S. Investment Banking and Capital Markets Sector (cont.)
Private Markets With companies expected to stay private longer, public capital markets service providers are increasingly looking to add
touchpoints into private companies and their investors. Earlier this year, Mizuho acquired Dallas-based fund placement
advisor Capstone Partners, adding institutional LP distribution capabilities to an already strong leveraged finance business.
Banks are seeking distribution into retail channels, as well, to meet the continually growing mass-affluent demand for high-
end PE strategies. In late June, Bank of America become the latest consortium investor in iCapital, a platform connecting
wealth managers and private capital fund managers and which recently acquired structured note distribution platform
SIMON from Goldman Sachs. Alternatives distribution players are even finding their place in the public markets: Forge, a
tech-enabled private securities marketplace, successfully de-SPAC-ed in an incredibly challenging early 2022 market,
trading well above $10.00 for much of the year.
M&A Advisory In foreboding macro environments like today’s, M&A becomes bifurcated, with large-cap activity significantly
underperforming the middle market. Smaller deals are far less reliant on public debt financing and shareholder support for
transformational acquisitions. At the same time, many entrepreneur-led private companies are coming off record 2021
financial performance but now see storm clouds on the horizon. CEO psychology is driving these private companies to seek
the certainty of a liquidity event while transactions can still be priced off 2021 performance.
For all the negativity around high-growth tech companies, the sector remains an active M&A market, particularly smaller
deals. Systems integration and IT consulting businesses remain in demand, with end markets adopting digital
transformation and remote-working strategies in the aftermath of the pandemic. The $2.0 billion in fees from tech deals
below $500 million in 1H 2022 is roughly equal to the full-year 2019 fee pool.
Even as revenue estimates for publicly traded M&A advisory firms are cut, many private mid-market M&A boutiques are
experiencing record performance and continuing to build their pipelines. These boutiques are also capitalizing on turmoil
upmarket to win talent. If the downturn is prolonged enough, we may see the formation of a new crop of independent M&A
boutiques, much as the 2008 Bear Stearns implosion birthed dozens of new firms.
Debt Issuance Investment-grade debt issuance generally tends to be highly active in the early stages of a bear market, as issuers look to
hoard capital and investors’ “flight to quality” drives corporate borrowing rates down. The market saw this dynamic in March,
when the $131 billion raised was the largest monthly total since the pandemic, but issuance has since settled as secondary
yields rise.
Source: Refinitiv. 4Review and Outlook:
U.S. Investment Banking and Capital Markets Sector (cont.)
Debt Issuance Leveraged finance issuance, on the other hand, declines steeply as risk assets sell off and refinancings and PE buyouts
(cont.) become untenable at prevailing rates. The current environment is notable because credit performance remains very
strong—leveraged loan defaults tied an all-time low in April 2022—even as a number of recent leveraged loans and LBO
bonds priced in the mid-80s to mid-90s. At these OID levels, originating banks likely incurred steep losses. With Bloomberg
reporting that banks’ balance sheets still hold $80 billion of leveraged loan exposure to be sold down, banks will be
extremely cautious about new financing commitments. The combination of strong credit performance, elevated spreads, and
sidelined banks creates a perfect opportunity for direct lenders to seize the spotlight. Years of strong fundraising have
doubled direct lending AUM over the past five years to $1 trillion+, and lenders have been gaining traction upmarket through
talent upgrades and PE relationships. Private lenders have maintained aggressive pricing in 2022, in some cases reportedly
even pricing below a comparable broadly syndicated loan. While upending the traditional syndicated vs. private loan logic
may not be sustainable in the long term, look for direct lenders to gain ground and muscle their way onto multibillion-dollar
financings.
Equities The investment banking doom and gloom of 2022 has been offset by resurgent secondary market volume in both equities,
where volatility has driven volume and widened bid-ask spreads, and in fixed income, where buyside investors are
realigning portfolios for inflation. What’s different about today’s equity trading surge vs. early 2021’s is the lack of lucrative
retail participation. Bloomberg reported that retail traders’ share of overall volume fell to ~10% from a high of more than 20%
last year, and a similar trend is occurring in the options market. Having been burned by crypto and NFTs, and with inflation
eroding disposable income, retail attention is shifting from day-trading meme stocks to holding blue-chip dividend plays.
While perhaps positive for Gen Z’s retirement prospects, it will be a headwind for app-based trading platforms and market-
makers that thrive on executing retail flow. Still, institutional volume growth has been enough to drive strong results at
sellside equities desks, exchanges, and capital markets fintech providers.
Though client-facing brokers and research providers were actively targeted in last year’s consolidation boom, 2022’s activity
has been centered around capital markets pipes and plumbing. Newly minted unicorn Clear Street raised a $165 million
Series B at a $1.7 billion valuation to continue building its API-driven clearing, custody, and settlement suite. Clear Street
reported +510% growth in equities volume since 2021, processing $3 billion+ daily for professional traders, market makers,
and online brokers. In June, crypto exchange giant FTX acquired its white-label equities partner Embed Financial
Technologies in order to enhance its FTX Stocks offering. The crypto collapse will likely push other digital asset players to
integrate a traditional securities offering.
Sources: S&P Global, PitchBook, Bloomberg, Refinitiv. 5Review and Outlook:
U.S. Investment Banking and Capital Markets Sector (cont.)
Consolidation Despite challenges in the broader IB market, many industry- or product-specialized broker-dealers are thriving. Our recent
experience has been that buyers remain open for acquisitions, albeit with heightened scrutiny on valuations and the
sustainability of trailing results. Buyers see challenges mounting in their own business, which inhibit their general risk
tolerance and also leads to skepticism about targets’ growth prospects. To achieve strong transaction outcomes, sellers
must be prepared to prove that growth has come from platform investments, successful product initiatives, and new
coverage lanes—not just rising tides in the market.
We expect consolidation to continue at a measured pace; until animal spirits return to the market, institutional broker-dealer
acquisitions may be led by buyers already active in the capital markets. This playbook was seen in Stifel’s acquisition of
ACXIT in June to enhance European coverage, and Raymond James’ acquisition of SumRidge in March to add electronic
fixed-income trading. That said, commercial banks are still inquiring about fee-based capital markets capabilities despite a
more profitable rate environment. Huntington Bancshares made a major foray into M&A advisory services with its March
2022 acquisition of 175+ professional Capstone Partners. Regions Financial acquired IT-services-focused M&A boutique
Clearsight Advisors, the bank’s first transaction in the space since acquiring BlackArch Partners seven years ago.
Unprecedented commercial bank merger activity in 2021 has created a new cadre of consolidators now large enough to
derive real synergy value from an IB offering.
In a risk-off market, we also expect to see more tie-ups structured as minority stakes or partnerships—which have the
added benefit of enabling investment in MBE/WBE targets. In the past few months, SMBC took a stake in cleantech IB
Marathon, Alantra took a stake in French tech M&A boutique Avolta, and Apollo took a stake in full-service investment bank
Siebert Williams Shank.
We hope this report sheds light on the trends and opportunities emerging from a newly turbulent market, and we look
forward to discussing them with you further in the months ahead. Until then, we wish you all the best for summer!
Warmest Regards,
Our Team Financial Services Group | Investment Banking and Capital Markets Coverage Team
Gagan Sawhney Chris Pedone Matt Capozzi Jeff Nassof
Managing Director Managing Director Senior Vice President Vice President
212.830.6165 212.830.6166 212.830.6193 212.830.6170
GSawhney@HL.com CPedone@HL.com MCapozzi@HL.com JNassof@HL.com
Sources: Company press releases, S&P Global. 6M&A Advisory Market Review:
Large-Cap Lull Has Fee Pool Tracking to Pre-COVID-19 Level
Renewed market volatility and the rising cost of debt financing had a chilling effect on large-scale M&A in 2022, causing further deceleration after the market plateaued in mid-2021.
However, as usual in a dealmaking slowdown, the middle market has been stable, down just 9% year over year, compared to 33% for deals above $5 billion. A shaky economic environment
is leading many private, founder-led companies to seek the certainty of a liquidity event; moreover, middle-market deals are less vulnerable to credit markets and public stock prices.
Despite the Nasdaq plunge and headline negativity in the tech sector, it remains the largest M&A fee pool, with 2022 mega-deals announced both before (Activision Blizzard, Citrix) and
after (Zendesk, VMware) the market slump. Though IPO markets are now hostile, tech consolidators are bolting on capabilities as digital transformation ripples through end markets.
Real estate fees reached record levels, with Blackstone’s four $1 billion acquisitions in 2022 and Prologis’ $26 billion acquisition of Duke, marking the largest REIT acquisition since 2017.
M&A Advisory Fee Pools ($ billions) Rolling Y/Y Fee Pool Growth
100%
$41.7B
75%
$32.2B
$25.4B $27.7B 50%
$21.9B $23.7B
25%
0%
Overall fee pool is down 19%
vs. same time last year
-25%
'17 '18 '19 '20 '21 LTM '19 '20 '21 '22
Sector Breakdown Deal Size Breakdown Growth by Sector Growth by Deal Size
RE and Gaming 45% Below $0.5B -9%
17% Services 16% $0.5B to $2B -24%
29%
Technology -16% $2B to $5B -17%
45% LTM: LTM: 43%
18% Financials -16% Above $5B -33%
$32.2B $32.2B
Cons. and Retail -19%
13%
Industrials -25%
13% 22%
Natural Resources -27%
Media and Telecom -36%
Technology Industrials Below $0.5B $0.5B to $2B Healthcare -36%
Healthcare All Others $2B to $5B Above $5B All Sectors -19% All Deal Sizes -19%
Source: Refinitiv.
Note: Based on announcement date and includes potential fees from pending transactions. 7ECM Underwriting Market Review:
From Record High to Record Low in 18 Months
The TTM reporting below understates the true magnitude of 2022’s ECM shutdown, as it includes the final six months of 2021’s relatively active new issues market. On a standalone
basis, 1H 2022 was the lowest fee pool for a calendar half in at least 20 years, with fees down approximately 90% from record levels seen in 1H 2021.
After more than 600 SPAC IPOs in 2021, there have been 69 in 2022 (and just 15 in Q2). This spring, the SEC proposed new rules around SPACs, which notably would restrict SPACs’ use
of forward projections—a key advantage for growth-oriented targets. In her dissent, SEC Commissioner Hester Peirce suggested the rules were “designed to stop SPACs dead in their tracks.”
SPACs generate the headlines, but biopharma and software always generated larger fees and have been the primary sources of ECM revenue for independent and bulge bracket
investment banks, respectively. Both spaces have been largely dormant in 2022, though some biopharma offerings have shifted to PIPE or ATM structures not captured below.
The anti-inflationary REIT and energy sectors were relative outperformers, benefiting from strong share prices and retail attention rotating from growth to dividend plays.
ECM Underwriting Fee Pools ($ billions) Rolling Y/Y Fee Pool Growth
200%
$20.8B
150%
$17.4B
100%
50%
$8.2B $8.7B $8.5B $9.1B
0%
Overall fee pool is
-50% down 61% vs. same
time last year
-100%
'17 '18 '19 '20 '21 LTM '19 '20 '21 '22
Sector Breakdown Structure Breakdown Growth by Sector Growth by Structure
REIT/MLP -27% IPO $250M -70%
31%
Technology -51% Flw-On $250M -50%
$9.1B $9.1B
26% Healthcare -66% Convertible -61%
3% 33%
13% SPAC -77%
7% 13%
All Sectors -61% All Deal Sizes -61%
Healthcare Technology IPO $250M
SPAC REIT/MLP Flw-On $250M
Funds Other Convertible
Source: Refinitiv.
Note: Deferred fees on SPAC IPOs fully recognized on IPO date. 8Debt Financing Market Review:
Rising Rates Driving a Shift From Bonds to Loans
Compared to other IB lines, debt origination fees have been relatively stable, with the loan and bond markets counterbalancing one another during periods of interest rate movement.
High-yield bonds bore the brunt of the inflationary environment. With yields doubling in the past year and hitting ~8.5%, the refi window closed and new money issuers turned to the loan markets.
Structured credit has been a bright spot within DCM issuance—consumer/business health and credit performance have been resilient through 2022’s macroeconomic turbulence. Nonagency
RMBS issuance has kept pace with 2021’s post-crisis record pace, even as pricing spreads widen to COVID-19-era levels.
The relative underperformance in leveraged and PE-sponsored loan issuance is likely a reflection of the shift from broadly syndicated to private loans. Direct lending funds held a record $169
billion of dry powder as of year-end 2021, and several recent large-cap financings that stalled in the public debt markets partially shifted to private credit (e.g., Nielsen, CDK Global, Carvana).
Bond and Synd. Loan Origination Fee Pools ($ billions) Rolling Y/Y Fee Pool Growth
40%
$28.8B $30.2B
$25.8B 30%
$22.7B $21.0B $22.4B 20%
10%
0%
-10% Overall fee pool is down 11%
vs. same time last year
-20%
'17 '18 '19 '20 '21 LTM '19 '20 '21 '22
Bond Breakdown Loan Breakdown Bonds by Segment Loans by Segment
Inv. Grade Corp. -20% Leveraged 5%
6%
High-Yield Corp. -54% Nonleveraged 30%
23% 31%
Structured Credit 42%
LTM: 46% LTM:
Agency -40% PE-Sponsored 5%
$12.2B $13.6B
Nonsponsored 16%
69%
25%
Acquisition-Related 36%
Refi / Other 0%
Inv. Grade Corp. High-Yield Corp.
Leveraged Nonleveraged
Structured Credit Agency
All Bonds -28% All Synd. Loans 11%
Sources: Refinitiv, S&P Global.
Note: Loan fees only include upfront arrangement fees on broadly syndicated loans; excludes directly placed loans, project finance, and tax-free munis. 9Securities Trading Market Review:
Robust Trading Volumes Offsetting IB Slowdown
Market volatility has supported volumes through 2022, though equities have not yet returned to the early 2021 peaks that were fueled by pandemic-era retail day traders. Data from J.P.
Morgan shows retail inflows to equities remain net positive, though May 2022’s $2 billion in net inflows was well below the $10 billion-$15 billion levels seen through much of the past year.
Gensler’s SEC is now exploring changes to the practice of payment for order flow, which had enabled the rise of $0 commissions, which in turn enabled the retail equities boom. An
open auction system has been floated by market participants as a replacement, which would likely shift volume from electronic market makers back to the exchanges.
Rumors of an FTX/Robinhood deal in June were quickly dismissed, but FTX instead acquired white-label equities platform Embed to help build out FTX Stocks. Other VC-rich crypto
players will likely be exploring diversification into traditional securities brokerage to offset weakness in digital asset volumes.
Overall, fixed-income volumes dipped mildly in Q2, though higher-commission corporate and muni volumes remain elevated as investors reposition their portfolios for rising rates.
Equities Monthly ADTV (share volume in billions) Fixed Income Monthly ADTV ($ volume in trillions)
20B $1.2T
ADTV in May up 16% vs.
TTM average $1.0T
15B
$0.8T
ADTV in May down 5%
10B $0.6T vs. TTM average
$0.4T
5B
$0.2T
0 $0
Q4 '20 Q1 '21 Q2 '21 Q3 '21 Q4 '21 Q1 '22 Q2 '22 Q4 '20 Q1 '21 Q2 '21 Q3 '21 Q4 '21 Q1 '22 Q2 '22
ADTV by Venue Average Trade Cost ADTV by Product May ’22 vs. TTM Avg.
4% 3% Treasuries -3%
2.8
18% Agency MBS -18%
40% 24% Corporates 10%
May '22 Dec '21 May '22
13.2B shs. 17% 42.6bps $898B Munis 61%
69% Private MBS 26%
25% 39.8 Federal Agency Secs 4%
ABS 15%
NYSE/Arca Nasdaq Commission Treasuries Agency MBS All Fixed Income -5%
Other Exchanges Off Exchange Implementation Shortfall Corporates Other
Sources: Virtu, SIFMA, J.P. Morgan. 10Houlihan Lokey Coverage and Capabilities
Recent Houlihan Lokey Capital Markets Sector Transactions
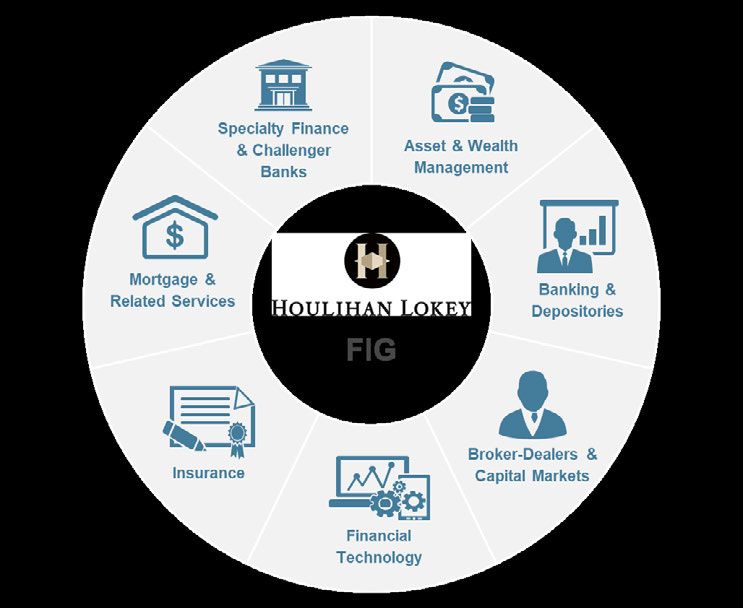
Houlihan Lokey Financial Services Group
Asset and Wealth Banking and Broker-Dealers Mortgage and Specialty Finance and
Financial Technology Insurance
Management Depositories and Cap. Markets Related Services Challenger Banks
With the legacy Freeman & Co. team, Houlihan Lokey is among the most active advisors in the space, with 20+ deals closed since 2019.
Our reputation is unmatched as the “banker’s banker” on transactions in the investment banking/financial advisory sector.
The professionals involved in every broker-dealer/capital markets transaction executed by Freeman & Co. are still leading Houlihan Lokey’s
coverage today—an unprecedented 25+ years of continuity.
$750 Million Series D Preferred
Financing at a valuation of $2.85
Billion has been acquired by
has received a growth capital Minneapolis Grain Exchange
has been acquired by investment from has acquired
has acquired has been acquired by
has been acquired by
a portfolio company of
Buyside Advisor Sellside Advisor Sellside Advisor Buyside Advisor Exclusive Financial Advisor* Sellside Advisor Sellside Advisor Financial Advisor
Fund Placement Multisector Insurance, Wealth Technology Embedded Equities Equities Trading Healthcare
Exchanges
Advisory Advisory Mgmt. Advisory Advisory Trading Platform and TCA Advisory
has been acquired by and its wholly-owned subsidiary has been acquired by
has been acquired by has been acquired by has acquired
has been acquired by has been acquired by
the parent company of have been acquired by
$236,000,000
Sellside Advisor* Sellside Advisor Sellside Advisor Sellside Advisor* Sellside Advisor* Sellside Advisor* Buyside Advisor* Sellside Advisor*
Global FX Execution Chemicals Private Securities Aerospace and Clearing and Fund Placement Full-Service Financial Technology
and Technology Advisory Marketplace Defense Advisory Mini-Prime Advisory Services Inv. Bank Advisory
*Selected transactions were executed by Houlihan Lokey professionals while at other firms acquired by Houlihan Lokey or by professionals from a Houlihan Lokey joint venture company.
Tombstones included herein represent transactions closed from 2019 forward. 12Case Study: Mizuho
Houlihan Lokey Advises Mizuho Americas on Its
Acquisition of Capstone Partners
On July 1, 2022, Mizuho Americas (Mizuho) completed its acquisition of Dallas-based
Capstone Partners (Capstone), a leading independent, middle-market placement agent
focused on fundraising and advisory services to private equity, credit, real assets, and
infrastructure investment firms.
Founded in 2001, the Capstone team includes 40 experienced professionals globally.
has acquired
Mizuho is an integral part of the Japan-based Mizuho Financial Group, one of the largest
financial institutions in the world with ~900 offices and 60,000 employees in nearly 40
countries. As of December 31, 2020, its total assets were $2.1 trillion.
The deal underscores Mizuho’s commitment to enhancing its investment banking offering and
furthering the suite of solutions for clients in the alternative investment market, specifically
financial sponsors.
Buyside Advisor
It also reinforces the bank’s leading capital-raising and distribution capabilities through
Capstone’s global network of 1,500+ limited partners across the U.S., Europe, and Asia with
expanded opportunities for cross-selling complementary investment banking solutions.
In recent years, Mizuho has been expanding its investment and corporate banking franchise,
leveraging its flagship investment-grade bond and loan businesses to grow its noninvestment-
grade and financial sponsors franchise, lead IPO and SPAC transactions, and provide M&A
services on notable transactions.
13Case Study: FocalPoint
Houlihan Lokey Advises FocalPoint on Its
Sale to B. Riley Financial
On January 18, 2022, FocalPoint, a leading independent investment bank based in Los
Angeles, agreed to be acquired by B. Riley Financial (NASDAQ:RILY; B. Riley) for a total
consideration of up to $175 million.
Founded in 2002, FocalPoint specializes in M&A, private capital advisory, financial
restructuring, and special-situation transactions. The firm employs approximately 50
investment banking professionals with deep industry specialization in high-growth sectors.
The transaction, which will create revenue synergies for both companies, comes as
FocalPoint is experiencing significant momentum with $17 billion in closed transactions
spanning a successful 20-year history.
B. Riley provides collaborative capital-raising and business advisory solutions spanning
investment banking and institutional brokerage, private wealth and investment management,
financial consulting, corporate restructuring, and more.
The combination is expected to more than quadruple B. Riley’s pro forma M&A advisory
business while enhancing its debt capital markets and financial restructuring capabilities.
Furthermore, the combination builds on the momentum and execution capabilities of both
firms and is in line with B. Riley’s stated intent to expand in M&A advisory and fixed income.
Strategic and financial sponsor clients will now have access to both firms’ proven execution
capabilities and a full suite of end-to-end services from a single platform.
14Case Study: MarshBerry
Houlihan Lokey Advises MarshBerry on a
Growth Investment From Atlas Merchant Capital
On January 10, 2022, MarshBerry, a leading financial advisory, consulting, and analytics firm
serving the insurance distribution and wealth management industries, received a significant
growth capital investment from Atlas Merchant Capital (Atlas).
Through a suite of industry-specific services, MarshBerry helps insurance agents and has received a growth capital
brokers, specialty distributors, private equity firms, and wealth management firms build, investment from
enhance, and sustain value.
Based in New York and London, Atlas was founded by Bob Diamond and David Schamis,
who (together with their partners) form a complementary partnership with extensive operating
and investing expertise across the financial services landscape.
The new partnership with Atlas will help MarshBerry accomplish its growth goals by improving Sellside Advisor
and expanding services to create even better outcomes for clients.
Furthermore, this partnership provides access to additional resources to help execute on
strategic growth initiatives, including expanded client solutions and acquisitions domestically
and in Europe.
15Case Study: Regions
Houlihan Lokey Advises Regions Financial on Its
Acquisition of Clearsight Advisors
On December 31, 2021, Regions Financial (Regions) acquired Clearsight Advisors
(Clearsight), a leading M&A advisory firm serving clients in the technology, professional
services, data and information services, and digital and technology-enabled services sectors.
Clearsight follows a research-driven, thematic approach toward building relationships across
the sectors served by the company, enabling it to deliver a deep understanding of market has acquired
trends and business strategies.
With $156 billion in assets, Regions is a member of the S&P 500 Index and is one of the
nation’s largest full-service providers of consumer and commercial banking, wealth
management, and mortgage products and services.
The acquisition represents another avenue for the bank to broaden its specialty capabilities Buyside Advisor
for existing technology sector clients while reaching new clients that can leverage Regions’
experience and resources to help them reach their financial objectives.
Furthermore, the acquisition is the latest example of Regions building additional revenue
diversification by delivering more high-value, fee-based financial services and originations.
16Houlihan Lokey Financial Services Group
2016–2021 M&A Advisor Rankings Global: One of the largest, most
North America and Europe Financial experienced, and most active financial
Sector(1) Transactions With Disclosed services teams of any independent Specialty Finance
Asset and Wealth
and Challenger
Deal Values Up to $1.0 Billion investment bank Banks Management
Rank Advisor Deals
65+ dedicated financial services/fintech
1 Houlihan Lokey 73 professionals based in New York and Mortgage and
Related Services
Banking and
Depositories
London, with additional offices in Miami,
2 Barclays Capital 65 Financial
Los Angeles, and Boston Services
3 J.P. Morgan 55 Group
4 Morgan Stanley 54 Exceptional momentum with 150+ Insurance
Broker-Dealers
and Capital
Markets
completed transactions since 2019
5 Piper Sandler 53 Financial
Technology
6 BofA Securities 49 Deep domain knowledge and
entrenched relationships with marquee
7 Goldman Sachs 47
clients across every sector of financial M&A Advisory
8 Raymond James 43 services
Private Capital Markets
Product Capabilities
9 Stifel/Keefe, Bruyette & Woods 42
Long-term, relationship-driven approach Financial Restructuring
10 KPMG 40
toward clients with senior participation on
Source: SNL Financial. all engagements Illiquid Financial Assets
(1) Rankings exclude depository transactions.
Board and Special Committee Advisory
No. 1 ranked M&A advisor to Conflict-free, independent advice hired
nondepository financial services for our intellectual capital and sector Valuation Services
companies cumulatively over the past expertise by the industry’s highest profile
Fairness Opinions
three-, five, seven- and 10-year periods clients, despite no lending relationship
17The Leading Independent, Global Advisory Firm
Houlihan Lokey is the trusted advisor to more top decision-
makers than any other independent global investment bank.
2,200+ 35 $5 Billion+ $2 Billion+ ~25% No
Employees Locations Market Cap Annual Revenue Employee-Owned Debt
Corporate Financial Financial and Financial Sponsors
Finance Restructuring Valuation Advisory Coverage
■ No. 1 Global M&A Advisor ■ No. 1 Global Restructuring ■ No. 1 Global M&A Fairness ■ No. 1 Global Advisor to Private
Advisor Opinion Advisor Equity Firms
■ Leading Capital Markets
Advisor Raising More Than ■ $3.0 Trillion of Aggregate ■ 1,000+ Annual Valuation ■ 1,000+ Sponsors Covered
$100 Billion in Past Five Years Transaction Value Completed Engagements Globally
2021 Investment Banking 2021 Global Distressed Debt & 2002 to 2021 Global M&A 2021 Most Active Global
Rankings All Global Bankruptcy Restructuring Fairness Opinion Advisory Investment Banks to
Transactions Advisory Rankings Rankings Private Equity Firms
Rank Advisor Deals Rank Advisor Deals Rank Advisor Deals
Rank Advisor Deals
1 Houlihan Lokey 549 1 Houlihan Lokey 63 1 Houlihan Lokey 952 1 Houlihan Lokey 323
2 Rothschild 38 2 JP Morgan 889 2 Deloitte 218
2 Goldman Sachs 511
Duff & Phelps, A Kroll
3 Moelis 34 3 889 3 William Blair 183
3 JP Morgan 508 Business
Source: Refinitiv. Source: Refinitiv. Source: Refinitiv. Source: PitchBook.
Excludes accounting firms and brokers. Announced or completed transactions.
Combined Global Presence:
Houlihan Lokey acquired GCA in October 2021, significantly
expanding the firm’s geographic reach in Europe and Asia
and creating the most active global M&A advisory firm.
18Disclaimer
© 2022 Houlihan Lokey. All rights reserved. This material may not be reproduced in any format by any means or redistributed without the prior written
consent of Houlihan Lokey.
Houlihan Lokey is a trade name for Houlihan Lokey, Inc., and its subsidiaries and affiliates, which include the following licensed (or, in the case of
Singapore, exempt) entities: in (i) the United States: Houlihan Lokey Capital, Inc., and Houlihan Lokey Advisors, LLC, each an SEC-registered broker-
dealer and member of FINRA (www.finra.org) and SIPC (www.sipc.org) (investment banking services); (ii) Europe: Houlihan Lokey EMEA, LLP, Houlihan
Lokey (Corporate Finance) Limited, and Houlihan Lokey UK Limited, authorized and regulated by the U.K. Financial Conduct Authority; Houlihan Lokey
(Europe) GmbH, authorized and regulated by the German Federal Financial Supervisory Authority (Bundesanstalt für Finanzdienstleistungsaufsicht); (iii)
the United Arab Emirates, Dubai International Financial Centre (Dubai): Houlihan Lokey (MEA Financial Advisory) Limited, regulated by the Dubai
Financial Services Authority for the provision of advising on financial products, arranging deals in investments, and arranging credit and advising on credit
to professional clients only; (iv) Singapore: Houlihan Lokey (Singapore) Private Limited and Houlihan Lokey Advisers Singapore Private Limited, each an
“exempt corporate finance adviser” able to provide exempt corporate finance advisory services to accredited investors only; (v) Hong Kong SAR: Houlihan
Lokey (China) Limited, licensed in Hong Kong by the Securities and Futures Commission to conduct Type 1, 4, and 6 regulated activities to professional
investors only; (vi) India: Houlihan Lokey Advisory (India) Private Limited, registered as an investment adviser with the Securities and Exchange Board of
India (registration number INA000001217); and (vii) Australia: Houlihan Lokey (Australia) Pty Limited (ABN 74 601 825 227), a company incorporated in
Australia and licensed by the Australian Securities and Investments Commission (AFSL number 474953) in respect of financial services provided to
wholesale clients only. In the United Kingdom, European Economic Area (EEA), Dubai, Singapore, Hong Kong, India, and Australia, this communication is
directed to intended recipients, including actual or potential professional clients (UK, EEA, and Dubai), accredited investors (Singapore), professional
investors (Hong Kong), and wholesale clients (Australia), respectively. Other persons, such as retail clients, are NOT the intended recipients of our
communications or services and should not act upon this communication.
Houlihan Lokey gathers its data from sources it considers reliable; however, it does not guarantee the accuracy or completeness of the information
provided within this presentation. The material presented reflects information known to the authors at the time this presentation was written, and this
information is subject to change. Houlihan Lokey makes no representations or warranties, expressed or implied, regarding the accuracy of this material.
The views expressed in this material accurately reflect the personal views of the authors regarding the subject securities and issuers and do not
necessarily coincide with those of Houlihan Lokey. Officers, directors, and partners in the Houlihan Lokey group of companies may have positions in the
securities of the companies discussed. This presentation does not constitute advice or a recommendation, offer, or solicitation with respect to the
securities of any company discussed herein, is not intended to provide information upon which to base an investment decision, and should not be
construed as such. Houlihan Lokey or its affiliates may from time to time provide investment banking or related services to these companies. Like all
Houlihan Lokey employees, the authors of this presentation receive compensation that is affected by overall firm profitability.
19CORPORATE FINANCE
FINANCIAL RESTRUCTURING
FINANCIAL AND VALUATION ADVISORY
HL.com
20You can also read