Insight GLOBAL - RBC Insight
←
→
Page content transcription
If your browser does not render page correctly, please read the page content below
GLOBAL
     Insight
     Perspectives from the Global Portfolio Advisory Committee                                                         May 2021

                                                                                GreenTech:
                                                                                Keeping it clean
                                                                                We’re seeing a transformative shift
                                                                                to a clean energy world, and with it
                                                                                the next normal. We explore four key
                                                                                drivers underpinning the GreenTech
                                                                                growth prospects.
                                                                                Frédérique Carrier | Page 4

     Also in this issue

     FOCUS ARTICLE                              GLOBAL EQUITY            GLOBAL FIXED INCOME            KEY FORECASTS
     Hydrogen: More                             Gathering speed          The calm before the
     than just talk                                                      calm?

For important and required non-U.S. analyst disclosures, see page 26.
Produced: May 5, 2021 1:35 pm ET; Disseminated: May 5, 2021 4:30 pm ET

Investment and insurance products offered through RBC Wealth Management are not insured by the FDIC or any other federal
government agency, are not deposits or other obligations of, or guaranteed by, a bank or any bank affiliate, and are subject to
investment risks, including possible loss of the principal amount invested.
GLOBAL                                     CONTENTS
Insight                                    4     GreenTech: Keeping it clean
                                           Once, the green technologies theme was a niche that was “nice to have.” Now,
                                           we’re seeing a transformative shift to a clean energy world, and with it the
May 2021
                                           next normal. We explore four key drivers underpinning the GreenTech growth
                                           prospects.

                                           11    Hydrogen: More than just talk
                                           Hydrogen is the lightest of all elements but may turn out to be a heavyweight in
                                           the transition to clean energy. The report lays out five things investors should
                                           know about hydrogen’s global potential, including opportunities for various
                                           industries.

                                           20 Global equity: Gathering speed
                                           The U.S. economy has moved into a higher gear, with other major economies
                                           gathering speed. Strong economic and earnings momentum, robustly positive
                                           consumer and business confidence, and policy set at “supportive” combine to
                                           produce a constructive outlook for equities.

                                           21    Global fixed income: The calm before the calm?
                                           A flurry of positive economic data is unlikely to change accommodative central
                                           bank policy in the near term. And investor uncertainty around the direction of
                                           fiscal policy could provide additional temporary support to bond prices.

                                           IN THE MARKETS
                                           3     RBC’s investment stance

                                           20    Global equity

                                           21    Global fixed income

                                           23    Key forecasts

                                           24    Market scorecard

All values in U.S. dollars and priced as
of market close, April 30, 2021 unless
otherwise stated.
Page 3 of 28 Global Insight, May 2021
EQUITIES
RBC’S INVESTMENT
Major economies are in recovery mode, with the U.S. and China leading the
Stance way and Canada keeping pace with its southern neighbor. We expect Europe
and the UK to pick up in the second half of the year as tourism begins to
restart.
Strong earnings momentum, robust consumer and business confidence, and
ongoing accommodative monetary and fiscal policies combine to produce
Global asset class views a constructive outlook for equities. Consolidation periods and corrections
can arrive at any time, but any wobbles in the market should be transitory
Asset because the global and U.S. economies are in the early stages of recovery.
Class View The tight credit conditions necessary to produce the next recession, falling
corporate earnings, and equity bear market look to be a long way off. We
– = +
recommend maintaining a moderately Overweight position in equities.
Equities
FIXED INCOME
Fixed Global fixed income markets found themselves in two halves in April, as
Income U.S. and developed Asian markets outperformed European sovereigns.
The sharp rise in Treasury yields—and concerns on rising COVID-19 case
counts—helped draw investors into U.S. government debt. For now, we think
Expect Expect global yields can move modestly higher as growth and reflation themes gain
below-average above-average steam. We favor shorter maturities in government debt, although we see
performance performance
emerging value in longer maturities, particularly in the U.S. In credit markets,
valuations are historically rich and corporate bond yields remain near record
lows, but we still expect credit to outperform government debt in 2021.
We maintain our Market Weight in global fixed income and maintain
(+/=/–) represents the Global Portfolio
Advisory Committee’s (GPAC) view over moderately low interest rate risk exposure as global yields rise on a
a 12-month investment time horizon. continued repricing of a strong economic recovery. We maintain a modest
Overweight to corporate credit, primarily via preferred shares.
+ Overweight implies the potential for
better-than-average performance for
the asset class or for the region relative
to other asset classes or regions.
= Market Weight implies the potential
for average performance for the asset
class or for the region relative to other
asset classes or regions.
– Underweight implies the potential
for below-average performance for the
asset class or for the region relative to
other asset classes or regions.
Source - RBC Wealth Management
Page 4 of 28   Global Insight, May 2021

MONTHLY                                   GreenTech: Keeping it clean
Focus                                     Once, the green technologies theme was a niche that was “nice to
                                          have.” Now, we’re seeing a transformative shift to a clean energy
                                          world, and with it the next normal. We explore four key drivers
                                          underpinning the GreenTech growth prospects. Companies
                                          developing environmentally-friendly technologies present
                                          interesting long-term investment opportunities, in our view.

Frédérique Carrier                        A profound energy transition
London, UK                                The world is in the midst of a transformative shift toward renewable
frederique.carrier@rbc.com                energy. This transition will be more rapid and potentially more profound
                                          than the adoption of oil in the 1850s. In that instance, it took a century
                                          from the time commercial oil wells were first drilled for oil to account for a
                                          quarter of the energy used worldwide. Today’s goal is to achieve the bulk
                                          of this energy transition by 2050, or over just three decades, in line with
                                          the Paris Agreement’s aim to keep global warming to well below 2 degrees
                                          Celsius compared to pre-industrial levels.

                                          A considerable share of the energy currently produced from fossil fuels
                                          will need to be replaced by energy from renewable sources, remembering
                                          that demand for electricity will go on rising from current levels as the
                                          world population grows and many activities, such as transport, become
                                          increasingly electrified.

                                          In short, the energy transition requires that within a few decades, the
                                          way energy is produced, stored, transmitted, and consumed will need to
                                          change.

                                          According to IRENA, the International Renewable Energy Agency, an
                                          intergovernmental organisation that supports countries in their transition
                                          to greater reliance on sustainable energy, $110 trillion will need to be
                                          invested over the next 30 years to realise the global energy transformation.

                                          Cumulative investments needed for energy transition

                                                Fossil fuels & other:                               Electrification &
                                                    $20T (18%)                                       infrastructure:
                                                                                                       $26T (23%)

                                                                                           $110
                                                                                         trillion

                                                Energy efficiency:                                    Renewables:
                                                   $37T (35%)                                          $27T (24%)

                                          Note: Fossil fuels = mostly oil, natural gas, coal
                                          Source - IRENA
Page 5 of 28 Global Insight, May 2021
Importantly, this transformative investment is being driven by a
MONTHLY FOCUS government policy roadmap that is synchronised for the first time, with
2020 marking a turning point:
GreenTech: Keeping it clean
The European Green Deal refocused the EU’s COVID-19 stimulus package
onto renewables—charging infrastructure, power generation, and green
hydrogen projects, allocating up to $600 billion to green projects.
China’s 14th Five-Year Plan called for electric vehicles (EVs) to constitute
20 percent of overall new car sales in China by 2025 from just five
percent now and to reduce its dependence on coal (spending up to 10
trillion yuan, or $1.5 trillion).
Joe Biden won the U.S. presidential election, with a sweeping
infrastructure programme (up to $2 trillion) one of his key initiatives.
Some industries set to benefit from the energy transition
Transformation Industry
Renewables • Independent wind farm operators
• Wind turbine manufacturers
• Utility companies with expertise in renewable power
A wide range of industries are • Solar panel equipment manufacturers
needed to make the energy • Enablers (semiconductor manufacturers)
transition a reality. • Software/enablers
• Monitoring systems
Energy storage • Battery systems operators
• Battery manufacturers
Transmission & • Transmission systems managers
distribution • Electric cable manufacturers
• Power equipment manufacturers (e.g., substations,
transformers)
• Electricity distribution companies
Electric vehicles • Manufacturers and operators of charging infrastructure
• Parts manufacturers
Source - RBC Wealth Management
Transformation #1: The way energy is produced
As we noted in our climate change report in March, energy used in
industry, transport, and buildings is responsible for some three-quarters
of all greenhouse gas emissions. At the moment, fossil fuels (mostly oil,
natural gas, and coal) are burned to produce electricity, creating carbon
emissions in the process. One way to reduce emissions is to shift to
electricity generated by wind turbines, solar panels, and other renewables.
Hydropower is already being used as much as it likely can: not all countries
have the water resources necessary, and those that do have already
developed them as much as possible over the past 100 years.
The International Energy Agency (IEA) projects that renewables will account
for 95 percent of the net increase in global power capacity through 2025. It
points out that solar and onshore wind, for which costs have fallen
dramatically over the past two decades, are already the cheapest ways of
adding new electricity-generating capacity in most countries. The IEA
Page 6 of 28      Global Insight, May 2021

                                                     expects solar alone to account for 60 percent of all renewable capacity
MONTHLY FOCUS                                        additions through 2025, with wind providing another 30 percent. Within the
                                                     latter, offshore wind is expected to see the most growth, driven by further
GreenTech: Keeping it clean
                                                     cost declines and a move beyond Europe/UK, where it is already a major
                                                     factor, to new markets such as China and the U.S. where ample potential
                                                     remains.

Various countries’ renewable energy situation
They are all making an effort

               Electricity production 2020
                 Wind         Solar       Hydro       Comment
China             5%           3%           17%       China boasts the world’s largest renewables sector and produces close to
                                                      three-quarters of the world’s solar modules, two-thirds of its lithium-ion
                                                      batteries, and close to half of its wind turbines. It also controls the global
                                                      supply of cobalt and lithium, key elements used in battery storage. China is
                                                      currently the world’s largest greenhouse gas emitter, but plans to increase its
                                                      renewables capacity by 40% between 2020 and 2025.

European          15%          5%           13%       In 2000, Germany was the first EU country to announce it would start to
Union                                                 move away from fossil fuels, creating the conditions for European industry
                                                      to develop a global edge in renewables technology. Many of Europe’s largest
                                                      utility companies have now transformed themselves into energy transition
                                                      pioneers, building wind and solar farms and investing in grids around the
                                                      world. The EU has continued to lead the way in the energy transition by linking
                                                      its COVID-19 crisis fiscal response to the goal of achieving a greener economy.
                                                      Plans to redesign the EU’s electricity markets should enable further progress.

U.S.              8%           2%           7%        The U.S. has lagged others so far, as it focused on shale oil and gas to
                                                      become the world’s largest oil producer. President Biden is now focusing on
                                                      decarbonising the U.S. economy. His $2 trillion infrastructure package would be
                                                      the most ambitious in decades. It includes some $175 billion for electric vehicle
                                                      tax credits and charging stations, $100 billion to upgrade the country’s electric
                                                      grid, and a similar amount to retrofit residential and institutional buildings.

Canada            5%           0%           60%       Historically, Canada has focused on hydroelectricity given its abundant
                                                      water resources. Alberta also has a well-developed oil sands industry, but
                                                      given the high cost of extraction combined with relatively weak oil prices
                                                      over the past six years, the region is exploring new technologies. Benefiting
                                                      from the province’s wealth of geological resources, the Alberta government
                                                      is actively encouraging the development of geothermal energy, as well as the
                                                      production of hydrogen. It is also looking to foster the extraction of minerals
                                                      used in the production of batteries.

UK                25%          2%           2%        Over the past decades, the UK has completely eradicated its reliance on
                                                      coal, replacing it with natural gas and renewables, thereby cutting carbon
                                                      emissions faster than other developed countries. The UK boasts the largest
                                                      offshore wind farm in the world with more than 170 turbines across 400 km2
                                                      (however, China has a project on track to surpass this in the next decade).
                                                      To achieve a green economy, the UK’s next step is to reduce its reliance on
                                                      natural gas. Decarbonisation efforts seem to have slipped in recent years
                                                      and the political consensus on this issue has weakened. The government’s
                                                      “Green Industrial Revolution” announcement last December aims to redress
                                                      the situation. The UK is hosting the UN’s climate change summit, known as
                                                      COP26, in November 2021, which will give it the opportunity to reassert its
                                                      position as a global climate leader.

Source - Energy Information Administration, Natural Resources Canada, Ember and Agora Energiewende, China Electricity Council; UK Department for Business,
Energy & Industrial Strategy
Page 7 of 28 Global Insight, May 2021
While wind and solar will likely play the largest role in the low-carbon
MONTHLY FOCUS economy, other technologies will also feature:
GreenTech: Keeping it clean Nuclear: Produces no greenhouse gas emissions, though the manufacturing
of the equipment and the construction of the station most probably do
Carbon capture: Removes carbon dioxide from the atmosphere or directly
from industrial processes and injects it into deep underground geological
formations (known as “sequestration”)
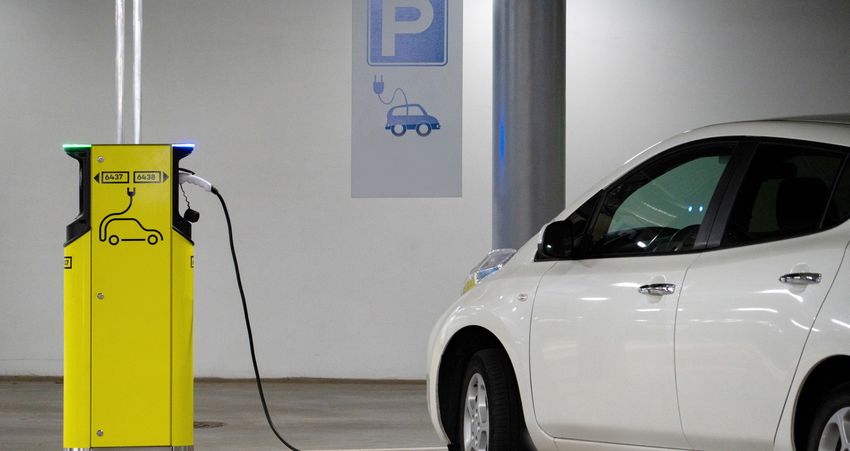
Hydrogen: As a way to store solar and wind energy to be used when needed
and as a direct substitute for fossil fuels including coking coal (for more see
“Hydrogen: More than just talk” on page 11)
Geoexchange: Takes advantage of the fairly constant temperatures a few
metres below the earth’s surface to heat homes and buildings in the winter
and cool them in the summer using heat pumps
Waste heat recovery: Captures the waste heat from buildings and industrial
processes and converts it into electricity via thermoelectric generators
The energy transition has forced oil and gas companies to invest
in renewables. European majors are leading the way. Royal Dutch
Shell even links executive pay to the progress it makes in reducing
emissions. U.S. Big Oil has been more reticent, though these
companies are starting to take some steps. The global energy majors
can be part of the solution, reinvesting part of their substantial free
cash flow to help fund their transition aims. The risk, in our view, is
that they overpay for renewables projects.
Transformation #2: The way energy is stored
One major challenge for renewables is the disconnect between the
continuous nature of electricity demand and the intermittency of solar
and wind power. The sun doesn’t always shine and the wind doesn’t always
blow. Worse, storms can make a wind farm inoperable.
This can be dealt with by adding an energy source that runs only when
needed—though these usually produce some harmful emissions and are
costly to run if only used part-time.
Battery energy storage systems, which can store energy during periods
of excess and discharge it during shortages, are another solution. These
can be stationary or modular, industrial-size batteries installed at various
points of the electric grid to support grid management. They are a critical
component in an increasingly renewable-reliant grid.
Storage costs are coming down thanks to innovation and economies
of scale. According to Shelby Tucker, RBC Capital Markets, LLC Utilities
Analyst, storage system unit costs are expected to decline by 45 percent
by 2030 and by 59 percent by 2050, while the next-generation battery
technologies, some offering more than double the energy capacity of
standard lithium-ion batteries, may drive down costs even further. Tucker
believes the global market for batteries has the potential to grow 100 times
by 2050.
Page 8 of 28   Global Insight, May 2021

                                          Battery technology can also be key to the uptake of EVs. Reducing the
MONTHLY FOCUS                             battery cost is important in making EVs more price competitive as batteries
                                          represent as much as 30 percent of the cost of an EV. Already down by
GreenTech: Keeping it clean
                                          more than 85 percent over the past decade, it needs to fall further. The
                                          average cost of a lithium-ion battery pack is currently just under $140
                                          per kilowatt-hour (kWh). According to BloombergNEF, EVs become cost
                                          competitive compared to traditional cars at $100 per kWh, which appears
                                          to be achievable by 2023, with some producers reporting costs below $100
                                          for the first time.

                                          Importantly, battery range, efficiency, and speed of recharging should
                                          also improve thanks to innovation and investment. Volkswagen recently
                                          committed to reducing battery costs by up to half and producing long-
                                          range and fast-charging batteries from 2024.

                                          Hydroelectric power can act as a very large-scale battery. In Canada,
                                          Quebec recently green-lighted a large wind power project made feasible by
                                          the ability to use the province’s massive hydro capacity as a back-up when
                                          wind power falters. Likewise, Alberta’s extensive wind and solar potential
                                          could be much more fully developed if backed-up by neighbouring British
                                          Columbia’s extensive hydroelectric resources. What’s missing is a more
                                          integrated grid system along their 1,800 km border.

                                          Transformation #3: The way energy is transported
                                          Because solar panels and wind turbines are installed where the sun shines
                                          and the wind is blustery, and not necessarily near cities, the current
                                          transmission model based on power plants sending electricity to nearby
                                          cities is not viable.

                                          To transport solar- and wind-generated electricity, high-voltage
                                          transmission is needed over large distances. In the U.S., as in many
                                          other places, this is an issue because the transmission system is highly
                                          fragmented and doesn’t easily send electricity from one end of the country
                                          to the other.

                                          High-voltage transmission systems are under development, but this is a
                                          complex undertaking with several stakeholders including landowners and
                                          state and local governments. One example is the TransWest Express, a
                                          high-voltage electric grid designed to move three gigawatts (GW) of wind
                                          power generated in windy Wyoming to California. Construction is finally
                                          about to start, 17 long years after planning began.

                                          China has been building out its ultra-high-voltage transmission network
                                          since 2009 to accommodate surging electricity consumption and various
                                          power resources. By the end of 2020, it had constructed 30 networks to
                                          transmit electricity from the its interior to the populated coastal regions in
                                          Eastern and Southern China.

                                          Power distribution systems, which connect power lines to homes, will
                                          also need to be upgraded to accommodate higher electricity demand
                                          as reliance on fossil fuels in the home decreases while electricity
                                          consumption increases. For instance, according to the U.S. Federal
                                          Highway Administration, an EV uses 4,000 kWh of electricity per year to
Page 9 of 28 Global Insight, May 2021
operate, assuming 13,500 miles driven—admittedly, a long distance by
MONTHLY FOCUS European standards. By comparison, the average U.S. household consumes
11,000 kWh per year, so having an EV would increase consumption by one-
GreenTech: Keeping it clean
third in the U.S.
Transformation #4: The way energy is used
Despite buzz for years about EVs, such cars were a mere three percent of
global demand in 2020, though with stark regional differences. Still-
prohibitive prices, inadequate battery ranges, and a lack of public and
home charging infrastructure have all stunted the uptake.
Global electric vehicle demand forecast
Western Europe leads, China is catching up
EV as % of total vehicle demand % of vehicles in
2020 2025E 2050E operation 2050
U.S. 2% 7% 80% 44%
China 4% 18% 95% 57%
Western Europe 6% 20% 95% 63%
Global 3% 11% 83% 46%
Source - RBC Capital Markets
But this appears about to change. RBC Capital Markets, LLC U.S. Auto
Analyst Joseph Spak forecasts EVs will represent 11 percent of demand for
new cars by 2025, with growth rates of some 40 percent per year, supported
by regulations to phase out internal combustion engine vehicles. To date,
at least 24 countries have proposed some form of zero-emission vehicle
targets. For instance, the UK will ban the sale of new petrol and diesel cars
from 2030.
Meanwhile, President Biden’s infrastructure plan proposes allocating some
$175 billion to EVs in the form of tax credits to consumers and incentives to
build 500,000 public charging stations.
Manufacturers are in the early stages of a heavy investment and capital
expenditure cycle to dramatically boost the production of EVs and
develop the related software. Many are planning to ramp up EV capacity,
and to offer a wider range of price points and models. General Motors is
accelerating its EV plans by spending $27 billion over the next five years on
electric and autonomous vehicles. It aims to deliver more than one million
EVs by 2025 and to stop making gasoline-powered cars by 2035. Ford’s
legacy internal combustion engine vehicles should also transition to EVs,
though at a slower pace than at GM. Chinese car manufacturers are also
ramping up EV production. Zhejiang Geely Holding, one of China’s biggest
automakers and owner of Volvo Cars, launched a luxury EV brand, called
Zeekr. A growing number of startups also are eyeing the country’s booming
EV market. Li Auto is aiming to be the No. 1 smart EV maker in China, and is
targeting 20 percent market share in China by 2025.
The transition from internal combustion engines to EVs has been compared
to that from horses to cars. It may not be an exaggeration. The change
goes much beyond altering assembly lines. EVs are increasingly becoming
more like smartphones, with wireless transmission of software updates.Page 10 of 28 Global Insight, May 2021
Getting this digitalisation right is key, as software opens up new
MONTHLY FOCUS opportunities for recurring and post-sale revenues via digital upgrades and
increased customer connectivity. Volkswagen is spending €27 billion over
GreenTech: Keeping it clean
the next five years on software, artificial intelligence, and autonomous
vehicles, aiming to increase the share of its own software used in its cars
from currently 10 percent to 60 percent. Like others, it is opting to keep new
technologies in-house to learn how to optimise technology and costs.
Spak points out that investors have generally cheered this step-up in
investment as it improves companies’ future prospects. But they will likely
want to see proof of better returns on these investments and of EVs as a
platform with more recurring revenue opportunities, a larger addressable
market, and less cyclicality. For traditional automakers undergoing this
metamorphosis, investor enthusiasm should be tempered by the possibility
of write-downs of legacy manufacturing footprints, restructurings, labour
concerns, and culture change.
Parts suppliers will also need to navigate a swift transition. Spak believes
those that can show a path to stronger earnings power in an EV world
should see their valuations re-rate higher—or at least sustain their recent
increases in valuation. Should current levels of profitability be merely
maintained or even decrease, a higher valuation would be harder to justify,
in his view.
A pause that has refreshed?
GreenTech stocks have lost some ground so far this year, as the market has
rotated into stocks that will likely benefit from the economic reopening.
A useful gauge is the MSCI Global Alternative Energy Index, which tracks
companies that derive 50 percent or more of revenues from operations
that contribute to a more environmentally sustainable economy. The index
lost close to 30 percent of its value between early January and early March
this year. To be sure, this followed a 220 percent gain from the trough of
March 2020 to the index’s January peak (versus the MSCI World Index’s
gain of 71 percent over the same period). After the recent correction, the
index’s relative price-to-earnings ratio is the lowest it has been in four
years. Despite the strong gains last year, the recent volatility represents a
good opportunity, in our view, to build exposure to these long-term, secular
themes.Page 11 of 28 Global Insight, May 2021
MONTHLY Hydrogen: More than just talk
Focus Hydrogen is the lightest of all elements, but it has the potential
to be a heavyweight in the transition to clean energy. Startups
and seasoned corporations in a variety of sectors are
already committing to innovative hydrogen applications, and
governments are setting ambitious goals. It won’t be a one-
size-fits-all transition. There will be—and should be—regional
differences in the uses and export of hydrogen, especially in the
early years. The report takes a closer look at hydrogen’s global
Kelly Bogdanova
San Francisco, United States potential, including untapped opportunities for its use in a
kelly.bogdanova@rbc.com variety of industries.
Five things investors should know about hydrogen’s potential in the
clean energy transition:
#1 – Hydrogen has promise
This versatile, clean-burning element has a role to play in carbon reduction
and the transition toward lower- and zero-carbon energy production.
Hydrogen can help reduce emissions from fossil fuels and heavily polluting
industries. Importantly it also has the potential to improve the reliability of
renewable energy.
In the coming years, we think hydrogen will:
Flow through natural gas pipelines. Some existing pipelines can safely
carry a mixture of 5–15 percent hydrogen with natural gas without
damaging the infrastructure, according to RBC Capital Markets;
Reduce emissions in heavy industries such as chemicals, steel, iron,
and cement production, as well as crude oil refining;
Become a key component of local industrial power supply chains that
incorporate wind, solar, and other green energy solutions; and
Help to power transportation systems such as truck fleets, trains,
industrial equipment (e.g., forklifts), ferries, tug boats, ships, and
airplanes.
Hydrogen demand is currently modest, but appears set to rise as industries
look to reduce their carbon footprint. Hydrogen’s uses are already
expanding into the applications cited above and perhaps will move into
even more ambitious applications as the costs of low- and zero-carbon
hydrogen production decline.
RBC Capital Markets estimates global demand for pure hydrogen is about
70 million metric tons, with about 95 percent consumed by the oil refining
and chemicals industries.Page 12 of 28 Global Insight, May 2021
An additional 45 million metric tons of hydrogen demand comes from
MONTHLY FOCUS mixtures of hydrogen with other gases, mainly used for heat and electricity.
Hydrogen: More than just talk We believe demand for pure hydrogen is expected to increase meaningfully
in coming decades, but the forecasts and scenarios vary widely, from a 267
percent increase to a 10-fold increase by 2050. There is even a “theoretical
max” demand estimate that is much higher, as the chart below illustrates.
The degree to which hydrogen demand will grow depends on how weak
or strong governments’ clean energy and hydrogen policies are, and how
coordinated. Importantly, demand will also depend on how much cost
improvement occurs through hydrogen innovation relative to competing
energy sources.
Existing national and multi-national carbon reduction agreements are key
factors that could incentivize hydrogen demand growth. But we doubt the
Paris Climate Agreement will be the last word on climate and sustainability
goals.
In 2020, the EU developed more aggressive goals to decarbonize its
economy and, importantly, incorporated hydrogen in its plans. Within the
EU, the German government has among the most ambitious hydrogen
goals, which is notable because that country is home to the largest
industrial firms in the EU.
We think carbon reduction targets in other major economies are likely to
be ratcheted up and will serve to expand the uses and demand for
hydrogen.
Demand forecasts vary widely
Potential global demand for hydrogen in 2050 in different scenarios (in millions of
metric tons per year)
Five different demand scenarios for 2050
1,400
1,200
1,000
800
600
400
200
0
Current BNEF IEA Hydrogen BNEF BNEF
level Weak Council Strong Theoretical
Policy Policy Max
Note: BNEF “Weak Policy” and “Strong Policy” scenarios depend on how strong and coordinated
government decarbonization and hydrogen policies are. The BNEF “Theoretical Max” estimate depends
on strong policy plus the adoption of hydrogen by unlikely-to-electrify sectors of the economy. The IEA
forecast represents its Sustainable Development Scenario, which it estimates based on goals in the Paris
Climate Agreement. The Hydrogen Council is an industry group of more than 100 companies that seeks to
accelerate the deployment of hydrogen in order to foster the clean energy transition.
Source - RBC Wealth Management, RBC Capital Markets, BloombergNEF (BNEF), International Energy
Agency (IEA), Hydrogen CouncilPage 13 of 28 Global Insight, May 2021
#2 – There are hurdles
MONTHLY FOCUS With every promising or revolutionary aspect of hydrogen’s future role
Hydrogen: More than just talk in cleaner energy output, hurdles exist. We think many of them can be
overcome, but others seem more daunting. The degree to which such
challenges are met will determine just how ubiquitous hydrogen becomes.
The International Energy Agency (IEA) estimates that about 75 percent of
hydrogen currently comes from natural gas and 23 percent from coal, the
latter with a high carbon footprint. In the future, other means of hydrogen
production using electricity derived from wind, solar, hydro, and nuclear
energy, will come to represent a greater share of the total.
As hydrogen production becomes less carbon-intensive, its uses
expand, and more production processes become viable, the following
challenges will inevitably arise:
Storage: Hydrogen is more difficult to store than fossil fuels because it is
less dense (only 15 percent as dense as gasoline), more diffusible (i.e., can
spread), and can penetrate and leak through some types of steel and iron
and cause them to become brittle.
Back to school: What is H2?
Hydrogen ...
Is the most abundant element in the Can store energy, which allows it to function as
universe a battery to complement renewable energy and
smooth out intermittent supply and demand
Is clean-burning, colorless, and odorless mismatches of solar and wind power
Has a flame that is invisible to Has diffusibility (i.e., it can spread more
the naked eye easily than natural gas)
On earth, exists only Can penetrate through porous
bonded with other metals, including some types of
elements (i.e., water H2O) steel and iron pipes
Is the lightest element, so Can be stored and transported
it has low density or mass within certain limitations
by volume (only 15% as
dense as gasoline) Has a combustion potential (auto-
ignition temperature) similar to
But it has high energy density natural gas and much higher than
(almost 3 times more than diesel gasoline vapor
or gasoline)–meaning a greater amount
of energy stored in its mass Generates no carbon emissions on its own. The
amount of carbon emissions involved in hydrogen
Is an energy carrier, not an energy source production depends on the source used to extract it
(hydrogen from coal has high emissions; hydrogen
from wind power has very low to zero emissions)
Source - RBC Wealth Management, RBC Capital Markets, U.S. Department of EnergyPage 14 of 28 Global Insight, May 2021
There are four primary methods of storing hydrogen: underground salt
MONTHLY FOCUS caverns, depleted oil and natural gas fields, rock caverns (aquifers), and
pressurized containers. Salt caverns are the best-suited of the geological
Hydrogen: More than just talk
options, according to RBC Capital Markets. But salt caverns are limited
geographically. Containers are better-suited for small-scale storage.
Companies and the scientific community are working to develop storage
tanks for liquefied and solid-state hydrogen using innovative metals.
Transport: Without modifications, many natural gas pipelines can carry a
5–15 percent blend of hydrogen, RBC Capital Markets estimates, depending
on the pipeline’s type of steel. Over time, existing pipelines could be
converted to pure hydrogen pipelines, and new hydrogen pipelines could
be built, albeit both at a significant cost. Hydrogen’s low density makes
it costly to transport by road, rail, or ship. But innovation and carbon
reduction incentives should make this more feasible over time.
Cost: Large-scale local supply chains will likely be the most cost-effective
means to deliver hydrogen to industrial users, according to BloombergNEF
(BNEF). Its analysts estimate the cost of “green hydrogen” (i.e., hydrogen
produced with renewable power sources having almost zero carbon
emissions) could decline by 85 percent to under $1 per kilogram in many
parts of the world by 2050, an accelerated pace compared to its own
estimate just one year ago. This is among the most aggressive forecasts.
Regardless of the pace of green energy efficiencies, we think electrolyser
equipment will play a key role in the cost equation. That equipment uses
electricity from wind, solar, hydro, or nuclear power to separate hydrogen
from oxygen in water, enabling the hydrogen to generate power via fuel
cells, internal combustion engines, turbines, and other processes. RBC
Capital Markets expects the capital cost of hydrogen electrolysers to fall
dramatically through 2030, as the chart below illustrates. The drawback is
that the electrolysis process is highly water-intensive. Not all countries or
locales have the necessary water supplies; those that do are best equipped
to incorporate electrolysis processes.
Potential capital cost declines of electrolysers (per kilogram of H2)
Electrolysers are the equipment used to produce hydrogen from wind, solar, hydro, and nuclear power. The lower the cost
of this equipment, the more likely hydrogen will be in demand.
$2.50 Bear scenario: The upper part
of the light blue shaded area,
$2.00 where the costs are highest
$1.50 Base scenario: The dark blue
$1.00
line
$0.50
Bull scenario: The lower part
of the light blue shaded area,
$0.00 where the costs are lowest
2020
2021
2022
2023
2024
2025
2026
2027
2028
2029
2030
The “Bear scenario” assumes 22.5 gigawatt total capacity installed, 13% learning rate. The “Base scenario” assumes 90 gigawatt total capacity installed, 13%
learning rate. The “Bull scenario” assumes 90 gigawatt capacity installed, 19% learning rate. Data assumes a 50% load factor.
Source - RBC Capital Markets estimates, Hydrogen CouncilPage 15 of 28 Global Insight, May 2021
#3 – It’s not one size fits all
MONTHLY FOCUS There will be—and should be—regional differences in the uses and export
Hydrogen: More than just talk of hydrogen, especially over the next 5–10 years. While many governments’
long-term goals will be to derive the bulk of hydrogen production from
clean energy sources—aka green hydrogen—the main “colors” or types of
hydrogen that dominate in one country or region likely won’t be the best fit
for others in the early years of this transition.
Leaders in natural gas supplies, such as the U.S., Russia, Qatar, and
Canada, may initially tilt toward producing a greater share of blue and
turquoise hydrogen—both of which can be derived from natural gas—than
countries without such abundant resources.
This is not green hydrogen per se, but it can reduce carbon emissions
nonetheless. According to RBC Capital Markets, blue hydrogen is four
times less carbon-intensive than gray hydrogen, which is predominantly
produced today. Turquoise hydrogen is even less carbon-intensive. RBC
Capital Markets energy analysts wrote, “We believe natural gas may
become a bridge fuel that helps green hydrogen become a reality.”
The hydrogen rainbow
The major types of hydrogen classified by colors
Types of H2 Production source (feedstock) and select production processes
From coal; traditionally has not involved carbon capture and
Brown
storage (CCS) but can through coal gasification
Gray From natural gas through thermochemical conversion
From natural gas via steam reforming; uses carbon capture and
Blue
storage (CCS) to minimize CO2 emissions
From natural gas via methane pyrolysis; H2 and solid carbon are the
Turquoise
outputs, both of which have uses
Yellow From nuclear power via electrolysis and other methods
From renewable electricity (solar, wind, and hydro) via electrolysis
Green
of water; breaks down water into hydrogen and oxygen
Source - RBC Wealth Management, RBC Capital Markets, U.S. Department of Energy, EWE AG, World
Nuclear Association
Countries that already have a relatively higher proportion of renewable
power supplies, such as the UK, Sweden, Denmark, and Spain, may be able
to capitalize on green hydrogen production more quickly than countries
still in the early stages of such a buildout.
China could, indirectly or directly, eventually become a leader in green
hydrogen production. In addition to building out significant renewable
power resources, China is already a leader in electrolysis equipment
manufacturing which is essential for green hydrogen production. While
Europe currently leads on electrolyser innovation, China produces the
cheapest electrolysers in the world.Page 16 of 28 Global Insight, May 2021
Even within countries, there will be geographic differences. For example,
MONTHLY FOCUS the Canadian provinces of British Columbia (BC) and Alberta have
relatively robust wind and solar resources alongside abundant natural gas
Hydrogen: More than just talk
supplies and infrastructure. This makes BC and Alberta uniquely positioned
to provide green hydrogen to local industries and export it to other parts of
Canada and the U.S., and to develop blue and turquoise natural gas-based
hydrogen for regional use and export.
There is a debate among experts about just how fast the various types of
hydrogen will evolve and which will lead. Estimates are in flux, with some
seeing a predominant role for blue and turquoise hydrogen for many
years, but others such as BNEF seeing green hydrogen moving to the fore
more quickly. An important determinant will be how rapidly the two major
platforms for future hydrogen development are adopted. In some respects,
there are competing interests between the two.
Large-scale transportation networks: Hydrogen would be shipped by
pipeline from production centers to industrial consumers, including over
great distances. This model would be akin to today’s oil and natural gas
distribution channels.
Localized distribution networks: Hydrogen production and
consumption would occur within regions and countries—the closer to
end-user demand the better.
The large-scale hydrogen transportation platform is a long-range and much
more expensive approach in terms of infrastructure buildout, whereas the
localized hydrogen networks could have near-term cost advantages and
potential, but lack scale. We see advantages for the latter.
Hydrogen supply chain from production to consumers
Low- or zero-carbon H2 storage &
H2 production methods transportation Consumers of H2
Steam methane (natural
gas) reforming + CCUS*
INDUSTRY POWER TRANSPORT
H2 bulk H2
storage tanks Oil refining Heat supply Fuel-cell truck
Renewables (wind,
Chemical Electricity Fuel-cell train
solar) + electrolysis
supply
Metallurgy Fuel-cell bus
H2 H2 Power storage
ships pipelines Electronic Fuel-cell
airplane
Nuclear + electrolysis
*CCUS stands for “Carbon capture, utilization, and storage”
Source - RBC Wealth Management, Rosatom GlobalPage 17 of 28 Global Insight, May 2021
#4 – Government policies and innovation will play outsized roles
MONTHLY FOCUS BNEF estimates that building on existing piecemeal regulatory approaches
Hydrogen: More than just talk with support from governments will enable hydrogen to meet seven
percent of global energy needs by 2050 compared to the low-single digits
today—not an insignificant proportion.
For hydrogen to take off over the longer term and become a much greater
component of total energy supply, significantly more will have to be done.
Strong and coordinated government regulations and incentives, and
significant government and private sector funding would be necessary
to build scale and advance technologies. Corporations will need to be
proactive and seize the opportunity. The price tag is high, and we are
already starting to see mismatches between decarbonization goals and
incremental realized outcomes.
BNEF analysts estimate expenditures of $11 trillion in hydrogen
production, storage, and transport infrastructure would be necessary
to push hydrogen’s role up to 24 percent of global energy needs by 2050.
This scenario would also require a significant, separate investment in
renewable wind and solar energy, which hydrogen production would
leverage.
Without substantial government support and coordinated regulation—
and corporate enthusiasm—it’s doubtful the private sector hydrogen
research and development, innovation, and investment will take place on
a grand scale. But ubiquitous hydrogen deployment is not required to push
incremental hydrogen demand higher and derive decarbonization benefits.
#5 – Key industries are innovating
Investment opportunities in hydrogen are not yet “clear” so to speak—it’s
still early. But they are forming in four broad categories:
Heavy industry applications, particularly in the chemicals, steel, other
heavy metals, and cement industries where carbon emission reduction
will be essential to achieve global goals;
Oil refining and natural gas industry uses, including pipeline
companies;
Hydrogen for local industrial supply chains and power generation
based on electrolysis from wind, solar, hydro, and nuclear power
sources; and
Transportation industry innovations.
Efforts in the transportation industry are garnering a relatively large
share of media attention. Companies, startups, and research institutes are
looking into and testing hydrogen-based fuel cells and internal combustion
engines to power medium- and long-haul heavy-payload truck fleets,
commuter and freight trains, industrial equipment (e.g., forklifts), ferries,
tug boats, ships, and airplanes.
For example, Canadian Pacific Railway plans to develop North America’s
first locomotive based on battery power and hydrogen fuel cells. InPage 18 of 28 Global Insight, May 2021
Europe, Austria recently placed Alstom’s hydrogen-powered passenger
MONTHLY FOCUS train into regular service. Startup ZeroAvia, a UK-based firm, is developing
a single-propeller airplane that can operate on an electric motor driven
Hydrogen: More than just talk
by hydrogen fuel cells. Europe’s Airbus is testing hydrogen-based power
applications as well. Kawasaki Heavy Industries conducted the world’s
first successful trial of transporting liquefied hydrogen by ship in October
2020. This effort is part of a long-term, landmark agreement between
Japan and Australia to deliver liquid hydrogen produced from Australian
coal via ship to Japan. Norway-based Nel, the world’s largest producer of
hydrogen electrolysers, was recently awarded a contract to build hydrogen
fueling stations for light-duty fuel cell vehicles in Quebec, Canada. Nel also
supplies fueling equipment and electrolysers for hydrogen-based truck and
bus fleet infrastructure in the U.S., China, and Europe.
Transportation industry sizzle aside, we think the potentially more
consequential innovations and uses of hydrogen in the next 5–10 years
will take place in carbon-intensive heavy industries—steel, chemicals,
natural gas, and power generation.
Linde, a UK-based multinational formed from a merger with U.S.-based
Praxair, has already built more than 80 hydrogen electrolysis plants mainly
used by traditionally carbon-heavy industries.
Some of the most ground-breaking innovations are coming in the steel
industry. Linde, in partnership with Sweden-based steel maker Ovako,
successfully replaced liquefied natural gas with hydrogen as feedstock
in the production process—a first for the industry. This reduced carbon
emissions without any negative impact on the steel’s quality. German
steelmaker ThyssenKrupp and Japan’s Nippon Steel are attempting to
make “zero-carbon steel” using green hydrogen derived from solar and
wind electricity through the electrolysis process, instead of the heavy-
carbon-intensive steel manufacturing process of burning “met” coal at high
temperatures.
BASF, the world’s largest chemicals company, has built a test plant that
will be used to determine if low-carbon hydrogen using methane pyrolysis
can succeed at an industrial scale. This process splits biomethane (natural
gas) into two components: hydrogen and solid carbon. The hydrogen could
be used to generate power for a variety of uses, while the solid carbon
could be used in heavy metals production such as aluminum and steel,
or for battery materials. Other firms are working on methane pyrolysis as
well. We think this technology has promise.
There are a number of hydrogen initiatives in the power industry. The H21
project, a UK government partnership with Norwegian energy firm Equinor
and UK gas distributor Cadent, would bring a 12.5 gigawatt hydrogen-based
power plant to Northern England. In the U.S., NextEra Energy Inc. seeks to
build its first green hydrogen power plant in Florida, which will use a 20
megawatt electrolyser based on solar power. Entergy is partnering with
Mitsubishi Power to bring hybrid hydrogen- and natural gas-based power
to Texas and other states in the region. In Ohio, the Long Ridge Energy
Terminal is slated to become a carbon-free hydrogen production facility. It
will initially run on a blend of hydrogen and methane (natural gas) basedPage 19 of 28 Global Insight, May 2021
on General Electric turbines, and then would ultimately transition to 100
MONTHLY FOCUS percent hydrogen.
Hydrogen: More than just talk
Opportunity
Hydrogen has rapidly become more than just talk. Many businesses
ranging from startups to major industrials have committed to an
accelerated increase in production and to innovative applications.
Governments are committing to even more stringent and challenging
emission reduction targets for 2050. The significant drop in renewable
electricity costs and dramatic increase in renewable power production is
facilitating and opening the door to hydrogen as a valuable complementary
clean technology, in our opinion. While the costs for building out the
related industrial infrastructure may be high, we think the potential for job
and wealth creation is compelling.
For hydrogen-related investments, we would focus on opportunities that
are likely to find their way to market in the next 5–10 years and are not as
dependent on substantial, coordinated long-term government subsidies
that have yet to be designated or allocated.Page 20 of 28 Global Insight, May 2021
GLOBAL Gathering speed
Equity The U.S. and Canadian economies are While Europe and the UK have
powering ahead. Q1 GDP growth for lagged North America mostly due
the U.S. came in at a very strong 6.4% to pandemic-related lockdowns and
(and we suspect may be eventually Brexit confusion, consumer and
Jim Allworth revised higher). The Canadian business confidence are on the rise
Vancouver, Canada
economy looks to be keeping pace and imminent reopenings are likely
jim.allworth@rbc.com
and we think it will do so over the full to boost sentiment further. The
year. Consumer spending, by far the comeback in the tourism sector—
largest component in both economies, important to the UK, France, Spain,
has been leading the way. But capital and Italy—should be a big addition
spending by business looks to be to GDP in the second half of this year
taking off too—non-residential capex and all of next.
in the U.S. grew by a chunky 9.9% in
China’s recovery continued through
Equity views Q1 following an even stronger Q4 last
Q1, albeit at a somewhat slower
year. Importantly, equipment and
Region Current pace. Monetary policy tightening has
software spending advanced at a
Global + already produced some volatility in
startling 26% annual rate.
United States +
debt markets but is unlikely, in our
Meanwhile, with new orders opinion, to seriously alter the GDP
Canada =
running at a blistering pace for trajectory in that country.
Continental Europe =
both manufacturing and services,
United Kingdom = Strong economic and earnings
inventories too low despite efforts
momentum, robustly positive
Asia (ex Japan) + to replenish, and economies not
consumer and business confidence,
Japan = yet fully reopened, this powerful
and policy still set at “supportive”
GDP momentum is likely to extend
+ Overweight; = Market Weight; – Underweight combine to produce a constructive
Source - RBC Wealth Management through 2021 and well into 2022,
outlook for equities. The major trend
in our opinion. An eventual U.S.
is likely to remain upward as long as
infrastructure spending initiative will
the outlook for the economy remains
add a positive impetus for several
positive. Corrections can arrive at
years beyond 2021.
any time, but we believe that concern
With the Conference Board’s Measure about higher-than-normal valuations
of CEO Confidence at a 17-year high, is very unlikely to be the trigger.
quarterly earnings and forward
We recommend a global balanced
guidance are likely to remain upbeat.
portfolio be moderately Overweight
And analysts’ earnings estimates, on
equities.
balance, are unlikely to be revised
lower anytime soon.
Evolution of our 2021 S&P 500 earnings estimate
200
$187
$177
180
$168
160
$149
140
120
100
June 2020 January 2021 February 2021 April 2021
Source - RBC Wealth Management, RBC Capital MarketsPage 21 of 28 Global Insight, May 2021
GLOBAL The calm before the calm?
Fixed income Treasury yields declined in April for instance, said that it is premature
despite a flurry of positive economic to even discuss scaling back stimulus,
data, including strong gains in and the Bank of Japan maintained its
nonfarm payrolls and retail sales. aggressive policy stance at its April 27
Atul Bhatia, CFA With vaccination rates in the U.S. meeting. The Bank of Canada did
Minneapolis, United States
moving higher, conditions point recently cut the amount of its bond
atul.bhatia@rbc.com
toward continued strong growth in purchases, but it remains an outlier
the second and third quarters. among G7 central banks.
Rising bond prices are atypical With Fed policy unlikely to change
against a strong economic backdrop, and largely priced in, investor
but we see several reasons for the emphasis in the U.S. is shifting to
recent demand. One is the high rate fiscal policy that is more difficult to
of global infections, which has led predict. The Biden infrastructure plan
to some limited border closures. The equates to nearly 10% of GDP but
absolute level of Treasury yields— faces an uncertain future in Congress.
which even after currency hedging Similarly, the administration has
is higher than that of many foreign proposed corporate and capital gains
government bonds—has also sparked tax changes that, if implemented, may
demand from overseas investors. potentially impact future individual
Another factor is the still-low rate and corporate investment. We
of inflation: although retail sales believe investor uncertainty around
were up 9.8% in March from the prior these proposals—particularly the
month, March’s core consumer prices changes to tax policy—could provide
were only 1.6% higher than 2020. additional temporary support to bond
prices.
The recent strong data is unlikely to
change monetary policy in the near We continue to believe in the growth
term. The Fed has consistently guided story and expect rates to rise over
to accommodative policy until time. In the U.S., we believe yields
employment has recovered and on the 10-year Treasury will likely be
inflation is well-established. This near 2% by year end. Were 30-year
stance is generally in line with other yields to reach 2.5% over that period,
developed market central banks. The we would view them as potentially
head of the European Central Bank, attractive for the long term.
U.S., Europe, and Japan all below target on preferred inflation measure
Despite recent strong data, 2.5%
2.0%
inflation is still running 1.5%
below the target of 2%. 1.0%
Accommodative policy will 0.5%
0.0%
likely remain until inflation is -0.5%
well established. -1.0%
-1.5%
Apr-19
Apr-20
Apr-21
Feb-20
Feb-21
Mar-20
Mar-21
Jul-19
Jul-20
Oct-19
Dec-19
Oct-20
Dec-20
Nov-19
Nov-20
May-19
Aug-20
Jan-21
Jun-19
Aug-19
Jan-20
May-20
Jun-20
Sep-19
Sep-20
U.S. Personal Consumption Expenditures Price Index (y/y)
Euro Area Index of Consumer Prices (y/y)
Japan CPI Nationwide ex Fresh Food (y/y)
Target
Source - RBC Wealth Management, Bloomberg; U.S. data through 2/28/21 & EU/Japan data through 3/31/21Page 22 of 28 Global Insight, May 2021
Fixed income views Sovereign yield curves
GLOBAL FIXED INCOME Gov’t Corp. 2.5%
Region bonds credit Duration
2.0% 1.63
Global = + 5–7 yr
1.5%
1.59
United 1.0%
= + 5–7 yr
States
0.5% 0.84
Canada = = 5–7 yr
0.0%
Continental -0.5%
= = 5–7 yr
Europe
1Y
2Y
10Y
20Y
30Y
5Y
United
– = 3–5 yr
Kingdom U.S. Canada UK
+ Overweight; = Market Weight; – Underweight
Source - RBC Wealth Management Source - Bloomberg; data through 4/30/21
Central bank rate (%) 10-year rate (%)
0.25 1.63
U.S. U.S.
0.25 1.75
Canada 0.25 1.55
Canada
0.25 1.60
-0.50 -0.20
Eurozone Eurozone
-0.50 -0.05
0.10 0.85
UK UK
0.10 1.05
3.85 3.20
China China
3.85
-0.10 0.10
Japan Japan
-0.10 0.10
4/30/21 1 year out 4/30/21 1 year out
*1-yr base lending rate for working capital, Note: Eurozone utilizes German Bunds.
PBoC Source - RBC Investment Strategy Committee,
Source - RBC Investment Strategy Committee, Global Portfolio Advisory Committee, RBC Global
RBC Capital Markets forecasts, Global Portfolio Asset Management
Advisory Committee, RBC Global Asset
ManagementPage 23 of 28 Global Insight, May 2021
Real GDP growth Inflation rate
United States: Housing boom 6.4%
KEY Economic data broadly positive amid vaccination 4.0%
rollout. ISM indexes firmly in expansion territory. New 2.3%
Forecasts orders positive, inventories too low. Unemployment
rate down to 6%, weekly unemployment claims
1.3%
2.6% 2.2%
1.8%
falling. Strong payroll growth will result in all jobs
replaced by early 2022. Home prices at 15-year high -3.5%
on record low supply. Core inflation barely below 2019 2020 2021E 2022E
the Fed’s 2% target at 1.8% y/y. Near-term surge
underway, but Fed policy unlikely to change.
Canada: BoC sees brightening economic outlook 5.8%
The BoC advanced the timeline to full economic 3.9%
2.0%
0.8%
recovery from the effects of the pandemic. Growth
expectations up more than 2% to 6.5% for 2021, and 2.4% 2.2%
inflation projected to reach 2% target by late 2022. 1.7%
The committee tapered asset purchases from CA$4
billion to CA$3 billion per week. Housing market -5.4%
worryingly strong as demand well ahead of supply. 2019 2020 2021E 2022E
Unemployment rate at 7.5%. Third wave lockdowns
temporarily dampening employment growth.
Eurozone: Manufacturing jumps to new record
Double-dip recession arrived with Q1 negative GDP 4.4% 4.5%
growth report. Largely a result of big hit to important 1.3%
0.3%
services sector from widespread shutdown in
1.2% 1.4% 2.0%
response to third wave. Eurozone manufacturing hit -6.7%
a record high mostly due to continued strength in
Germany’s output. European Central Bank kept its
very stimulative monetary policy unchanged. After 2019 2020 2021E 2022E
a slow start, vaccinations have picked up, which
should lead to gradual reopenings throughout May.
Tourism rebound expected in H2.
UK: Expecting faster growth
5.7% 6.5%
Bank of England (BoE) Deputy Governor Ben
1.8% 0.9%
Broadbent recently said he expects to see “very
rapid economic growth at least over the next couple 1.6% 2.0%
of quarters.” Consumers expected to spend as 1.3%
much as 5% of savings banked during pandemic.
Manufacturing and industrial output climbed with -9.8%
transport equipment as well as computer, electrical, 2019 2020 2021E 2022E
and optical equipment leading the way. Pent-up
demand drove stronger-than-expected retail sales.
China: Domestic slowdown 9.0%
China’s official and Caixin PMIs indicate domestic
economy is slowing while external demand 6.1%
5.5%
remains strong. Construction indicators show
infrastructure investment has weakened in response 2.5%
to government efforts to rein in lending. The dynamic 1.3%
phase of the recovery from the pandemic appears to 2.9% 2.4%
2.0%
be over with slower growth projected going forward 2019 2020 2021E 2022E
as the government deals with distortions in the debt
market.
Japan: Consumer slump following shutdowns 3.0% 3.0%
GDP has been recovering on the back of very strong 0.7%
exports and manufacturing. Consumer and business 0.0%
confidence on the rise. Despite these positives,
0.5% 0.4% 0.8%
Q1 GDP expected to retreat as COVID-19-related
Chart source - RBC Investment Strategy shutdowns hit consumer spending. Recovery
Committee, RBC Capital Markets, Global expected to pick up speed late in Q2. Bank of Japan -4.9%
Portfolio Advisory Committee, Bloomberg
consensus estimates
to maintain accommodative policy but now expects 2019 2020 2021E 2022E
inflation won’t reach 2% target before 2024.You can also read