Infrastructure workforce and skills supply - A report from Infrastructure Australia's Market Capacity Program
←
→
Page content transcription
If your browser does not render page correctly, please read the page content below

October 2021

Infrastructure
workforce and
skills supply
A report from Infrastructure Australia’s
Market Capacity Program
Ownership of intellectual property               Creative Commons licence
rights in this publication                       With the exception of the Coat of Arms, the
Unless otherwise noted, copyright (and any       copyright in this publication is licensed under a
other intellectual property rights, if any) in   Creative Commons Attribution 3.0 Australia
this publication is owned by the                 Licence.
Commonwealth of Australia (referred to
below as Infrastructure Australia).           Creative Commons Attribution 3.0 Australia
                                              Licence is a standard form licence agreement
© Infrastructure Australia 2021               that allows you to copy, communicate and
                                              adapt this publication provided that you
Disclaimer                                    attribute the work to the Commonwealth and
The material contained in this publication is abide by the other licence terms.
made available on the understanding that
the Commonwealth is not providing             A summary of the licence terms is available
professional advice, and that users exercise from http://creativecommons.org/licenses/by/3
their own skill and care with respect to its  .0/au/deed.en
use, and seek independent advice if           The full licence terms are available
necessary.                                    from http://creativecommons.org/licenses/by/
                                              3.0/au/legalcode
The Commonwealth makes no                     This publication should be attributed in the
representations or warranties as to the       following way: © Infrastructure Australia
contents or accuracy of the information       2021.
contained in this publication. To the extent
permitted by law, the Commonwealth            Acknowledgements
disclaims liability to any person or          Infrastructure Australia would like to
organisation in respect of anything done, or acknowledge the contribution to the
omitted to be done, in reliance upon          development of this report of Steve Brogan,
information contained in this publication.    Jonathan Cartledge, Peter Colacino, Suzie
                                              Carruthers, Matt Gijselman, Tim Mumford, Zac
                                              Murphy, David Tang, Roy Unny, Ben van
                                              Deventer and the extended Infrastructure
                                              Australia team. We also wish to thank Nous
                                              Group for their work in the delivery of this
                                              report.

                                            OFFICIAL                                                 Page 2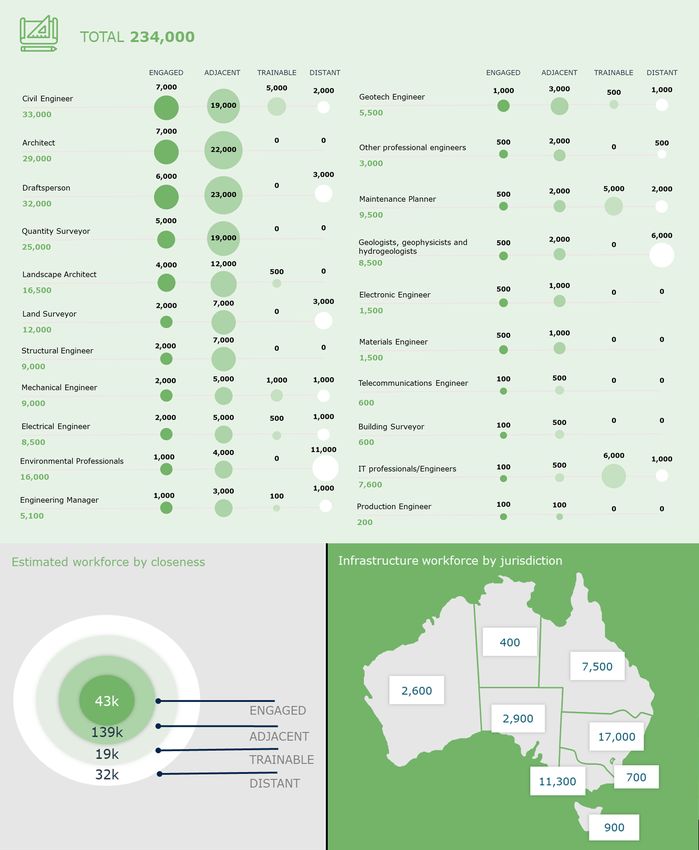
Table of Contents
ACKNOWLEDGEMENT OF COUNTRY .................................................................................... 5
EXECUTIVE SUMMARY ........................................................................................................ 6
  PUBLIC INFRASTRUCTURE RELIES ON A WIDE RANGE OF WORKERS AND SKILLS FOR DELIVERY ........................... 7
  THE CURRENT WORKFORCE IS SMALL AND GEOGRAPHICALLY CONCENTRATED .............................................. 7
  THE WORKFORCE IS ALREADY SHOWING SIGNIFICANT SIGNS OF SHORTAGE ................................................ 8
  PLANNED DEMAND IS ANTICIPATED TO DRAMATICALLY EXCEED THE WORKFORCE’S CAPACITY ............................ 9
  CONSTRAINTS LIMIT THE PRODUCTIVITY OF EXISTING WORKERS AND ATTRACTION OF NEW ONES ..................... 11
1. KEY SKILLS IN THE PUBLIC INFRASTRUCTURE SECTOR ............................................... 13
  AT A GLANCE ..................................................................................................................... 13
  THE DESIGN, CONSTRUCTION AND MAINTENANCE OF PUBLIC INFRASTRUCTURE DRAWS ON FOUR MAIN GROUPS OF
  WORKERS ......................................................................................................................... 13
  PUBLIC INFRASTRUCTURE REQUIRES DIVERSE AND SPECIALIST SKILL SETS ............................................... 15
  WHAT IS A T-SHAPED SKILLS PROFILE? ....................................................................................... 15
2. THE CURRENT PUBLIC INFRASTRUCTURE WORKFORCE ................................................ 17
  AT A GLANCE ..................................................................................................................... 17
  AN ESTIMATED 182,000 INDIVIDUALS ARE CURRENTLY ENGAGED IN THE DELIVERY OF PUBLIC INFRASTRUCTURE
  ACROSS AUSTRALIA ............................................................................................................. 18
  THERE ARE A FURTHER 1.18 MILLION WORKERS IN RELEVANT OCCUPATIONS, BUT MANY ARE IN FUNDAMENTALLY
  DIFFERENT ROLES ................................................................................................................ 19
  THE ENGAGED WORKFORCE RESIDES IN CITIES AND LARGER STATES ...................................................... 20
3. EMERGING WORKFORCE PRESSURES ........................................................................... 23
  AT A GLANCE ..................................................................................................................... 23
  AUSTRALIA’S PUBLIC INFRASTRUCTURE WORKFORCE IS UNDER STRAIN ................................................... 23
  OCCUPATIONAL ASSESSMENTS MASK PRESSING WORKFORCE CHALLENGES ............................................... 25
  INDUSTRY PERSPECTIVE: AUSTRALASIAN RAILWAY ASSOCIATION ......................................................... 28
  CHANGING SKILL NEEDS COMPOUND WORKER SHORTAGES ................................................................. 28
4. THE FUTURE WORKFORCE SUPPLY CHALLENGE ............................................................ 31
  AT A GLANCE ..................................................................................................................... 31
  AUSTRALIA IS FACING A PUBLIC INFRASTRUCTURE WORKFORCE CRISIS ................................................... 31
  OCCUPATION SHORTAGES ARE PROJECTED TO BECOME MORE ACUTE ...................................................... 33
  CONSEQUENCES ARE LIKELY TO BE FELT ACROSS MULTIPLE INDUSTRIES .................................................. 34
  INDUSTRY PERSPECTIVE: CONSULT AUSTRALIA .............................................................................. 36
5. CONSTRAINTS TO ADDRESSING THE SUPPLY CHALLENGE............................................ 37
  AT A GLANCE ..................................................................................................................... 37
  THE FUTURE LABOUR SUPPLY WILL COME FROM DIFFERENT SOURCES ...................................................... 37
  THE FUTURE AVAILABILITY OF INFRASTRUCTURE WORKERS IS AT RISK .................................................... 38
  FEMALE UNDERREPRESENTATION LIMITS THE SECTORS’ ABILITY TO GROW ITS WORKFORCE ............................ 40
  INDUSTRY PERSPECTIVE: AUSTRALIAN CONSTRUCTORS ASSOCIATION ................................................... 42
  SCARCE RESOURCES ARE INCREASINGLY CONSUMED BY COMPLEX PROCUREMENT PROCESSES.......................... 42
  SYSTEMIC ISSUES CREATE BARRIERS FOR INDIVIDUALS SEEKING EMPLOYMENT .......................................... 42
  LEAKAGE FROM EDUCATIONAL PATHWAYS IS COMMON AND QUALITY IS MIXED ........................................... 43
  MIGRATION ALONE CANNOT ADDRESS LABOUR SHORTAGES ................................................................ 43
  PRIORITY MIGRATION SKILLED OCCUPATION LIST .......................................................................... 45
  NATIONAL SKILLS COMMISSION ............................................................................................... 45
TABLE OF FIGURES ........................................................................................................... 46
APPENDIX A – OCCUPATION AND ROLE MAPPING TO ANZSCO......................................... 48
APPENDIX B – OCCUPATIONAL GROUP SNAPSHOTS ........................................................ 53
APPENDIX C – CURRENT OCCUPATIONAL SHORTAGES DETAIL ........................................ 57

                                                             OFFICIAL                                                          Page 3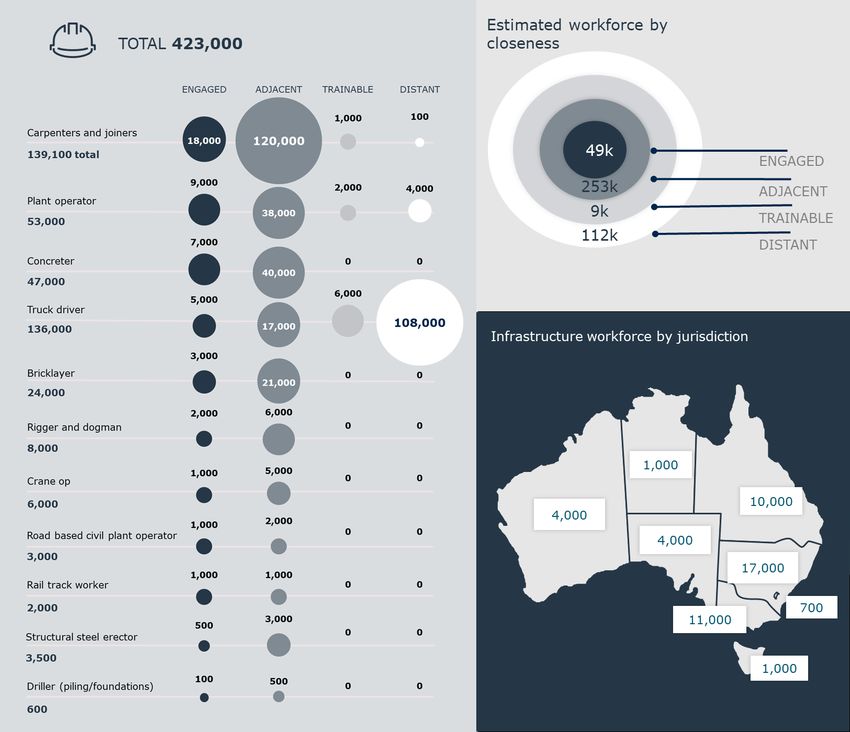
APPENDIX D – ROLE SHORTAGES DETAIL ........................................................................ 61
APPENDIX E – GENDER DIVERSITY BY OCCUPATION ....................................................... 66
APPENDIX F – MODELLING METHODOLOGY ...................................................................... 68
  INTRODUCTION .................................................................................................................. 68
  DEFINING PUBLIC INFRASTRUCTURE RELEVANT OCCUPATIONS AND ROLES ................................................ 69
  DEFINING ENGAGED, ADJACENT, TRAINABLE AND DISTANCE SHARE OF WORKFORCE .................................... 69
  ESTIMATING HISTORICAL AND CURRENT LABOUR SUPPLY FOR PUBLIC INFRASTRUCTURE ................................ 70
  ESTIMATING ANTICIPATED FUTURE WORKFORCE ATTRITION ................................................................ 71
  ESTIMATING FUTURE LABOUR SUPPLY FOR PUBLIC INFRASTRUCTURE. ..................................................... 71
  IDENTIFYING SHORTAGES BASED ON MODELLED SUPPLY AND DEMAND .................................................... 73
  IDENTIFYING SHORTAGES BASED ON LABOUR MARKET INDICATORS ....................................................... 73
  DEVELOPING SKILLS PROFILES FOR IDENTIFIED OCCUPATIONS ............................................................. 74
  DEMOGRAPHIC ANALYSIS ....................................................................................................... 74
  DATA SOURCES AND USAGE .................................................................................................... 75
APPENDIX G – ACRONYMS ............................................................................................... 77
REFERENCES ..................................................................................................................... 78

                                                             OFFICIAL                                                        Page 4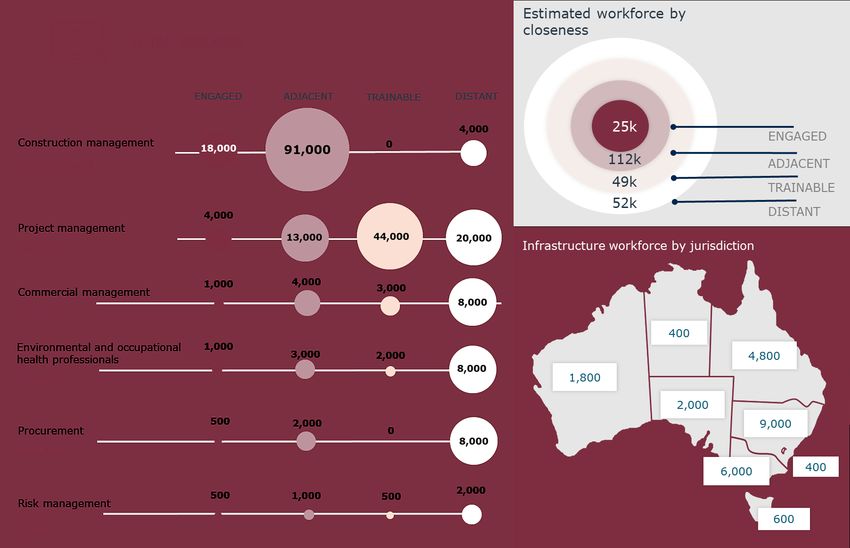
ACKNOWLEDGEMENT OF COUNTRY

Infrastructure Australia proudly acknowledges the Traditional Owners and Custodians of Australia,
and their continuing connections to the land, waters and communities. We pay our respects to them
and to their Elders past, present and emerging. In preparing for the future of our infrastructure, we
acknowledge the importance of looking beyond the immediate past to learn from Aboriginal and
Torres Strait Islander peoples’ unique history of land management and settlement, art, culture and
society that began over 65,000 years ago.

As part of Infrastructure Australia’s commitment to reconciliation, we will continue to develop
strong, mutually beneficial relationships with Aboriginal and Torres Strait Islander partners who can
help us to innovate and deliver better outcomes for Aboriginal and Torres Strait Islander
communities, recognising their expertise in improving quality of life in their communities.

                                               OFFICIAL                                          Page 5
Executive summary
Australia has ambitious plans when it comes to investing in public infrastructure. A skilled workforce
that is available when required will be pivotal in realising these plans. The proposed rapid expansion
of public infrastructure is testing the limits of existing capacity and capability. Signs of shortages are
already prevalent across the workforce with demand anticipated to reach unprecedented levels, well
beyond the sector’s ability to service them. Projections show that at its projected peak in 2023 the
infrastructure workforce will be 48% short of demand, a deficit of 93,000 people.
At a glance
• Public infrastructure draws from four infrastructure-based occupational groups: project
management professionals; engineers, scientists and architects; structures and civil trades and
labour; and finishing trades and labour.
• An estimated 182,000 individuals are currently engaged in the delivery of public infrastructure
across Australia. This includes an estimated 25,000 project management professionals, 43,000
engineers, scientists and architects, 49,000 structures and civil trades and labourers and 65,000
finishing trades and labourers.
• 79% of the engaged workforce are in New South Wales, Victoria or Queensland, and 78% of the
construction workforce are in major cities creating challenges for regional labour markets.
• Smaller jurisdictions or regional areas also face higher risks to workforce retention. A lack of
diversity in construction work means that when government funding ceases, so do the jobs. Just
under 30% of the relevant Northern Territory workforce is engaged in public infrastructure
compared with under 15% in Queensland or Victoria.
• Detailed design work is increasingly being concentrated in New South Wales and Victoria where
two-thirds of engaged engineers, scientists and architects reside, with Western Australia and
Northern Territory having much higher proportions of finishing trades and labour.
• Of the 50 occupations identified as relevant to public infrastructure, some 34 are rated as either
likely or potentially in shortage (16 occupations are rated as likely in shortage and 18 rated as
potentially in shortage). Half of these are engineers, scientists and architects, although there are
shortages in all occupation groups.
• Occupations do not capture the full extent of skills required to deliver public infrastructure.
Consideration of roles within occupations is required to understand this. Analysis of Burning
Glass Technologies job advertisements identified 81 roles (below occupation level) as likely or
potentially in shortage, 22 of which are within occupations that are unlikely to be in shortage
overall. These roles are mostly senior or specialist roles.
• Over the next three years demand for labour is anticipated to reach unprecedented levels.
Labour shortages are anticipated to be three times greater than in 2017-2018, peaking at a
likely shortfall of 93,000 workers in early 2023 or 48% higher than projected supply.
• Shortages are anticipated to peak at 19,000 project management professionals, 70,000
engineers, scientists and architects, 16,000 structural and civil trades and labour and 14,000
finishing trades and labour at different points across the next three years. The country is nearing
peak demand for engineers, scientists and architects in 2021.
• Risks posed by an ageing workforce (40% to potentially retire in next 15 years) are compounded
by regulatory and procurement practices that result in workforce inefficiencies the sector cannot
afford as it copes with escalating demand.
• Efforts to grow the workforce are compromised by a range of cultural, geographical, diversity
and education issues that constrain the sectors’ ability to rapidly grow its workforce. Migration
can not meet the gap alone, and border closures, limitations of visa programs and poor
utilisation of existing migrants are additional constraints.
• Action is required. Continued investment in public infrastructure without significant expansion of
workforce supply risks compounding shortages already evident in the workforce, increasing the
risks to delivery of this once in a generation investment pipeline in the years to come.
OFFICIAL Page 6Public infrastructure relies on a wide range of workers and skills for
delivery
Public infrastructure is defined as any structure that is owned by the government or that is
developed for the public good. Public infrastructure draws on a range of workers and skills to
support delivery from four main infrastructure-based occupational groups: project management
professionals; engineers, scientists and architects; structures and civil trades and labour and;
finishing trades and labour.
Workers bring diverse and specialist skill sets, some of which are general (e.g. communication) or
technical (e.g. project management) and found across many occupations, others are specialist and
distinct to infrastructure with industry increasingly seeking workers with the right blend of general,
technical and specialist skills as reflected in a ‘T shaped’ skills profile with both breadth and depth.
Finding the right number of people with the right skills and experience, at the right time is, and will
continue to be, a challenge for the sector.
The current workforce is small and geographically concentrated
The public infrastructure workforce is approximately 182,000 individuals. This is around 13% of a
broader workforce of 1.37 million people that work in similar roles across construction and other
industries. Figure 1 overleaf categorises this workforce by readiness to transition into public
infrastructure and shows that most of these people are up to six months of training or equivalent
experience away, although this varies for the different occupation groups.
Mobility is limited between the engaged workforce that supports public infrastructure and the
adjacent, trainable and distant workforces that share relevant skills. Skill and experience gaps,
employment conditions, and salary differences all create barriers to mobility between these groups.
The engaged workforce is geographically concentrated, meaning capacity to deliver public
infrastructure is variable across the country. Approximately four out of five workers are based in
New South Wales, Victoria or Queensland. The vast majority live in major cities. In a buoyant
market this creates difficulties for non-metropolitan areas to source labour.
A lack of diversity in construction work means that when government funding ceases, so do the
jobs. For example, 28% of the relevant Northern Territory workforce is engaged in public
infrastructure compared with less than 15% in Queensland or Victoria.
Capacity is constrained further when considering occupational groups. Two-thirds of engineers,
scientists and architects engaged in public infrastructure work live in New South Wales or Victoria.
Western Australia has greater access to finishing trades and labour. This is reflective of a broader
trend where design may be conducted remotely but construction cannot.
OFFICIAL Page 7Figure 1: Snapshot of workforce relevant to public infrastructure 1
The workforce is already showing significant signs of shortage
Australia’s currently planned infrastructure will extend the present infrastructure boom to 2025. The
workforce is already exhibiting signs of strain as projects commence. Figure 2 shows that over two-
thirds of key occupations are likely or potentially in shortage. Challenges are most acute amongst
engineers, scientists and architects, which are expected to be 70,000 people short of demand in late
2021. All phases and all types of public infrastructure projects are reliant on this workforce, and so
this shortage is likely to cause delays in projects. Shortages are also present across all other
occupational groups, with peak unavailability in 2023.
OFFICIAL Page 8Figure 2: Current state shortages across the infrastructure sector 2
Likely Shortages Potential Shortages Unlikely Shortages
• Commercial management
Project • Environmental and
• Construction management
Management • Procurement management
• Risk management
occupational health
Professionals professionals
• Project management
• Building surveyor
• Civil engineer
• Electrical engineer
• Engineering manager • Electronic engineer
• Environmental professionals • IT professionals/engineers
Engineers, • Geologists, geophysicists and • Maintenance planner • Architect
Scientists and hydrogeologists • Production engineer • Landscape architect
Architects • Geotechnical engineer • Structural engineer • Draftsperson
• Land surveyor • Telecommunications engineer
• Materials engineer • Mechanical engineer
• Quantity surveyor
• Other professional engineers,
scientists, etc.
• Bricklayer
• Carpenters and joiners
Structural and • Plant operator
• Concreter
• Rigger and dogman
Civil Trades • Driller (piling/foundation) • Crane operator
• Structural steel erector
and Labour • Rail track worker
• Truck drivers
• Road based civil plant
Operator
• Electrical or
telecommunications trades
• Electrical line workers • Electricians
Finishing assistant
• Telecommunications cabler • Glazier
• Mechanical engineering
Trades and • Telecommunications field • Painting trades
trades workers
Labour staff • General construction
• Plasterers
• Tiler labourer
• Plumbers
• Safety officers
Shortages can also be found at more granular levels, for example specialist or senior roles within an
occupation. The absence of one worker with a specific skill set can have significant implications for a
project and a debilitating impact on the industry if not addressed. Eighty-one specific roles that exist
within occupations have been identified as likely or potentially in shortage. Twenty-two of these are
part of occupations that are not considered to be in shortage overall.
In some cases, shortages are also driven by changing skills needs, which mean the experience of
the existing workforce is no longer relevant.
Planned demand is anticipated to dramatically exceed the workforce’s
capacity
Over the next three years demand for labour in public infrastructure is projected to reach
unprecedented levels. The labour shortages are anticipated to be more than three times as severe
as experienced in 2017-2018, peaking at 93,000 additional workers required in early 2023. At this
point, approximately one in three jobs advertised in public infrastructure would remain unfilled. This
is illustrated in Figure 3 below. Shortages are expected to last until at least 2024 based on currently
confirmed projects that are primarily focused over the forward estimates. Even if the shortages do
not cause delays on projects, the workforce challenges will likely extend further as new projects are
confirmed. A conservative estimate shows this could extend out till 2028.
OFFICIAL Page 9Figure 3: National supply and demand for workers in public infrastructure, historical (2016-2021)
and projection (2021-2032) 3
350,000
Supply
300,000 Known demand
Average demand
250,000 2021-2025
Workers
200,000
Average demand
2016-2021
150,000 Beyond forward estimates
Available data for the period beyond forward
100,000 estimates is limited. Demand for roles in the
period following 2025 are the residual
requirements from projects commenced within
50,000 the forward estimates. Demand for roles in the
period beyond 2025 will be dependent on future
project announcements.
0
2016
2017
2018
2019
2020
2021
2022
2023
2024
2025
2026
2027
2028
2029
2030
2031
2032
2033
2034
2035
2036
Note: the visibility of forward infrastructure spending is limited by available data. Only publicly known projects are included, and therefore
generally occur within the forward estimates. As a result, future expenditure is likely to be larger than forecast beyond the forward estimates as
new projects are announced. Increased clarity of the long-term pipeline is highly desired to support this understanding.
The national picture also masks significant variation across the country. Despite having the largest
workforces, New South Wales, Victoria and Queensland face the greatest risk of shortage. Figure 4
shows that demand is anticipated to significantly outpace supply for these three states every year
from 2021 to 2024.
Figure 4: Net required additional public infrastructure workers by jurisdiction, 2021–2025 (000s) 4
150k
120k
+90k
Jurisdictions need
additional workers
+60k
+30k
0k
-30k
-60k
2021 2022 2023 2024 2025
Jurisdictions have excess workers
New South Wales Queensland South Australia Australian Capital Territory
Victoria Western Australia Tasmania Northern Territory
All jurisdictions except the Northern Territory will have a shortage at least nearly half the size of
their projected workforce, although not all at the same time. There will be some opportunity to
OFFICIAL Page 10resolve specific local shortages through interstate migration, but this will not address the major
national shortages across 2021-2024. In considering potential shortages across states and
territories it is important to note also the potential impact from competing sectors of the economy,
for example oil and gas construction, not captured through this analysis as it is focused on major
public infrastructure.
As overall labour shortages persist, specific occupation shortages will become more acute. Between
2021 and 2024 shortages are anticipated in all four key occupational groupings but are likely
greatest amongst engineers (multiple) and general construction labour. Procurement professionals,
surveyors (various), geologists and similar occupations, road and civil based plant operators,
drillers, safety officers, telecommunication field staff and electrical line workers are other
occupations with strong likelihood of nationwide shortage.
Unless addressed, labour shortages are likely to spill over to other sectors and industries, as each
worker who takes a job delivering public infrastructure more than likely leaves a vacancy elsewhere
that must be filled. This drives a war for talent and may inflate costs. Historically, public
infrastructure has utilised 12-14% of the overall workforce in relevant occupations. If demand
estimates are realised this would require the share of the workforce supporting public infrastructure
to increase to 20% by 2023. More than 50% of engineers, scientists and architects working in other
construction sectors would need to retrain to work in public infrastructure this year, as well as 16%
of project management professionals, 6% of structures and civil tradespeople and labourers, and
3% of finishing tradespeople and labourers by 2023. This compares to shifts of approximately 2.1-
3.5% for each group over the past five years.
Constraints limit the productivity of existing workers and attraction of
new ones
Anticipated demand can only be met though the mobilisation and productivity of existing workers
and attraction of new ones. However, a range of constraints and barriers limit these opportunities.
The infrastructure workforce is ageing, with over 40% of current workers likely to retire over the
next 15 years. While new entrants will join the sector, the loss of experience will be significant. This
challenge is greatest for project management professionals and structures and civil trades and
labour, both of which have more than 40% of workers over the age of 45. At the same time
regulatory and procurement practices result in workforce inefficiencies that limit the productivity of
the existing workforce, which the sector cannot afford as it copes with escalating demand.
At a time when the sector needs to grow its workforce, efforts are compromised by a range of
cultural, geographical, diversity and education issues that constrain the sectors’ ability to rapidly
grow its workforce.
Migration, which is often perceived as a panacea to these shortages, can no longer be relied upon to
fill a growing skills gap. Border closures, lead times and complexity of visa processes and poor
utilisation of existing migrants constrain the sectors’ ability to effectively respond to the supply
challenge through skilled migration, whether through targeted critical skills, or more generally. Even
if these issues were resolved, skilled migration is not a large enough pipeline to address the demand
challenges. It is projected to provide just 6% of new entrants to the workforce.
The challenges for the capacity and capability of Australia’s public infrastructure workforce are clear.
As the gap between demand and supply grows, the importance of early action is perspicuous. Many
proposed investments are in the early stages of planning, but continued investment without
significant expansion of workforce supply risks compounding shortages already evident in the public
infrastructure workforce, increasing the risks to delivery of this once in a generation investment
pipeline in the years to come.
OFFICIAL Page 11These issues are further explored across the following sections:
• Section 1 provides an overview of the type of workforce needed to design, construct and
maintain public infrastructure in Australia.
• Section 2 outlines the current public infrastructure workforce including the geographic
distribution for each occupation category.
• Section 3 assesses pressures on the current public infrastructure workforce.
• Section 4 assesses the capacity and capability of the future public infrastructure
workforce to meet predicted future workforce demand.
• Section 5 outlines the constraints to addressing Australia’s looming infrastructure
workforce shortage through mobilisation of existing workers and growth in new workers.
OFFICIAL Page 121. Key skills in the public
infrastructure sector
At a glance
• This section provides an overview of the type of workforce needed to design, construct
and maintain public infrastructure in Australia.
• Public infrastructure draws from four main infrastructure-based occupational groups:
project management professionals; engineers, scientists and architects; structures and
civil trades and labour; and finishing trades and labour.
• Workers bring diverse and specialist skill sets, some of which are general (e.g.
communication) or technical (e.g. project management) that are found across many
occupations; others are specialist and distinct to infrastructure.
• Industry is increasingly seeking workers with the right blend of general, technical and
specialist skills as reflected in a ‘T shaped’ skills profile.
Public infrastructure includes the development of roads, bridges, airports, train stations, water, gas
and electricity systems, as well as public assets such as community centres and hospitals. 5 It is a
sub-sector of the broader construction industry which also includes residential construction
(detached medium density dwellings that are constructed for the purpose of housing), civil
construction and private industrial and commercial construction (medium to high rise dwellings
which may have multiple occupants that are constructed solely through investment of a private
individual or company, for a commercial purpose).
The focus of this section of the report is on the nature of the workforce required to meet Australia’s
growing public infrastructure demands.
The design, construction and maintenance of public infrastructure
draws on four main groups of workers
The infrastructure workforce consists of four main occupational groups:
• Project management professionals are involved in the planning, organisation, direction,
control and coordination of the construction process. These occupations are typically responsible
for the physical and human resources engaged across the construction lifecycle, including
planning, procurement, risk and compliance.
• Engineers, scientists and architects are engaged on infrastructure projects to design, plan,
organise and manage the detailed specifications of the construction and maintenance. These
occupations are typically engaged early in the construction process, for the duration of the build,
and include many subspecialists that have unique knowledge.
• Structures and civil trades and labour includes individuals experienced in the pre-
construction preparation and construction works. It includes excavation, steelwork, concreting,
carpentry, and drilling. It also includes activities that underpin these tasks, such as cranes and
trucks.
• Finishing trades and labourers includes individuals who move infrastructure projects from
construction to completion. They develop the fit out for construction projects and ensure
infrastructure is operational and can be used for their intended purpose.
OFFICIAL Page 13Each group contains discrete occupations, as set out in Figure 5. These occupations were informed
by Australian and New Zealand Standard Classification of Occupations (ANZSCO) and through
consultation with industry experts and additional key stakeholders.
Figure 5: Public infrastructure occupational taxonomy 6
This classification was developed to account for the limitations of the existing ANZSCO taxonomy.
Further, each occupation includes a range of roles which reflect the different specialisations or
experiences that distinguish positions within a given occupation. These roles were identified using
job advertisement data from Burning Glass, along with consultation with industry. This provides a
greater level of specificity on the workforce needed to support the current and future infrastructure
pipeline that would otherwise be masked by purely focussing on ANZSCO. The full classification is
outlined in Appendix A – Occupation and role mapping to ANZSCO, including the ANZSCO
alignments and the specific roles.
Burning Glass Technologies aggregates job advertisements to create insight into the supply and
demand for talent. The data set includes around nine million job advertisements covering every
occupation and industry in Australia. Through their proprietary algorithms they have defined and
referenced over 1,500 general and technical skills identified by employers as important for new
hires. This can be used to understand trends in skill demand, including skill needs for specific
occupations.
Outside of the four main occupational groups there are other occupations that make public
infrastructure possible. This fifth group of individuals includes individuals that support general
business operations in any organisation – for example human resources, administration and
accounting as well as specialists in other industries like bankers, lawyers and economists. This group
of individuals has been excluded from this analysis, but are no less important to the functioning of
the infrastructure industry.
OFFICIAL Page 14Public infrastructure requires diverse and specialist skill sets
Public infrastructure relies on a large workforce with a broad range of skills. These range from long-
practiced and common skillsets to those that are niche and at the cutting-edge of technology.
At the most granular level, every occupation and role represent a portfolio of skills. Skills are
combined in different ways to perform specific jobs or tasks. For the purposes of this analysis three
categories of skills have been identified:
• Generalist skills are often referred to as enterprise or soft skills and include skills or attributes
that are common to most occupations such as communication, problem solving and time
management.
• Technical skills are required to perform specific, practical tasks that are necessary for many
occupations, but are not confined to construction. These may include skills such as project
management, stakeholder management or quality assurance and control.
• Specialist skills are required by a specific profession and often require a certain qualification
and/or accreditation. Construction related specialist skills are often distinct to the industry. These
include types of engineering, construction management and construction labour skills.
Analysis of the skills employers’ request in job ads shows that most roles require a combination of
these skills as reflected by a “T shaped” skills profile, with generalist and technical skills to provide
breadth, and specialist skills the depth. This is illustrated in Figure 6.
What is a T-shaped skills profile?
A T-shaped skills profile is one of deep specialist knowledge and skills in a particular area, the
vertical stroke of the ‘T’, along with generalist and technical skills, a collaboration mindset and
people skills, the horizontal stroke. 7
OFFICIAL Page 15Figure 6: Example skills profiles by occupational group 8
Project management Engineers, scientists and Structural and civil trades Finishing trades and
professionals architects and labour labourers
Communication Skills Planning Teamwork / Collaboration Detail Orientation
• Building effective
General skills &
• Building effective
relationships • Time management • Time management
relationships
attributes
• Problem solving • Customer service • Customer service
• Problem solving
• Mentoring • Computer literacy • Computer literacy
• Organisational skills
• Written communication • Positive disposition • Preventive maintenance
• Time management
• Verbal / oral • Problem solving • Energetic
• Computer literacy
communication • Organisational skills • Leadership
• Leadership
• Time management
• Scheduling & budgeting • Scheduling & budgeting
Technical skills
• Project management • Project management
• Quality assurance and • Project management
• Scheduling & budgeting • Scheduling & budgeting
control • Quality assurance and
• Stakeholder management • Stakeholder management
• Logistics control
• Quality assurance and • Quality assurance and
• Operations management • Facility management
Control control
• Occupational health and • Occupational health &
• Risk management • Business development
safety safety
Specialist skills
• Environmental consulting
• ISO 14001 standards • Carpentry • Electrical
• Engineering design
• Construction management • Mobile plant operation • Plumbing
• Engineering (civil,
• Managing subcontractors • Delivery unload and • Roofing
electrical, mechanical,
• Construction industry breakdown • Tools (hand and power)
geotechnical etc)
knowledge • Power tools • Painting
• Structural design
• Rail safety • Road construction • Welding
• Digital engineering e.g. BIM
To assist with a greater focus on skills, the National Skills Commission (NSC) has recently released a
BETA version of an Australian Skills Classification. Over time, this will provide a common language
for skills, and the range of skills linked to specific occupations. 9
The BETA introduces a set of core competencies and specialist tasks designed to describe day-to-day
work within an occupation. While presenting a common language, further work is required to
connect them to job advertisements to understand how demand for skills is changing. For this
reason, this report makes use of the Burning Glass Technologies skills taxonomy.
OFFICIAL Page 162. The current public
infrastructure workforce
At a glance
• This section outlines the current public infrastructure workforce including the geographic
distribution for each occupation category.
• An estimated 182,000 individuals are currently engaged in the delivery of public
infrastructure across Australia. This represents about 13% of the total 1.37 million people
working in the occupations outlined in Section 1.
• The workforce engaged with public infrastructure includes an estimated 25,000 project
management professionals, 43,000 engineers, scientists and architects, 49,000 structures
and civil trades and labourers and 65,000 finishing trades and labourers.
• The remaining 1.18 million individuals support a range of other sectors and industries.
o Approximately 869,000 people (63% of the total workforce) work in other construction
sectors and could potentially retrain to work in public infrastructure within six months.
o Approximately 83,000 people (6% of the total workforce) could support delivery of
public infrastructure in six to 12 months with skill development and transition
programs in place.
o A final 231,000 (17% of the total workforce) would take one to three years to
transition, subject to considerable investment in skills development.
• Beyond skills and experience gaps, employment conditions and lack of interest will make it
difficult to attract enough individuals from other industries. If successful in attracting
individuals, competition for labour will likely result in a rapid escalation in labour costs.
• The country’s workforce distribution also presents challenges. 79% of the engaged
workforce are in New South Wales, Victoria or Queensland, and 78% of the construction
workforce are in major cities. In a buoyant market this creates difficulties for non-
metropolitan areas to source labour.
• When individuals are attracted to smaller jurisdictions or regional areas the risks to
retention are higher. A lack of diversity in construction work means that when government
funding ceases so do the jobs. 28% of the relevant Northern Territory workforce is
engaged in public infrastructure compared with just 12-13% in Queensland or Victoria.
• Not all work needs to be decentralised. There are indicators that detailed design is being
concentrated in New South Wales and Victoria where two-thirds of engaged engineers,
scientists and architects reside, with Western Australia and Northern Territory having
much higher proportions of finishing trades and labour. While design may be undertaken
remotely, construction cannot.
An estimated 182,000 Australians work in public infrastructure, out of a total 1.37 million working in
occupations outlined in Section 1. A wide range of industries compete for similar individuals while an
uneven distribution of people presents geographical challenges for the sector that must be
overcome.
This section outlines the current public infrastructure workforce including the geographic distribution
for each occupation category.
OFFICIAL Page 17An estimated 182,000 individuals are currently engaged in the delivery
of public infrastructure across Australia
There are approximately 182,000 people currently working on public infrastructure projects across
Australia. This can be broken down into sectors within infrastructure. Figure 7 highlights that most
individuals are engaged on building activity (residential and commercial construction), roads
highways and subdivisions, and bridges, railways and harbours.
Figure 7: Estimated number of individuals by public infrastructure sector 10
Beyond the engaged workforce, there are another 1.18m individuals working in the occupations
outlined in Section 1. They can be classified into three further categories differentiated by their
readiness to transition to work in public infrastructure: adjacent, trainable and distant.
The adjacent category includes people working in other construction sectors, while the trainable and
distant groups have been defined based on the similarity of the skills requested by employers. The
closer a worker is to engaged, the less additional training would be required to be ready to work on
a public infrastructure project. Estimates range from 0-6 months for adjacent through to 1-3 years if
distant.
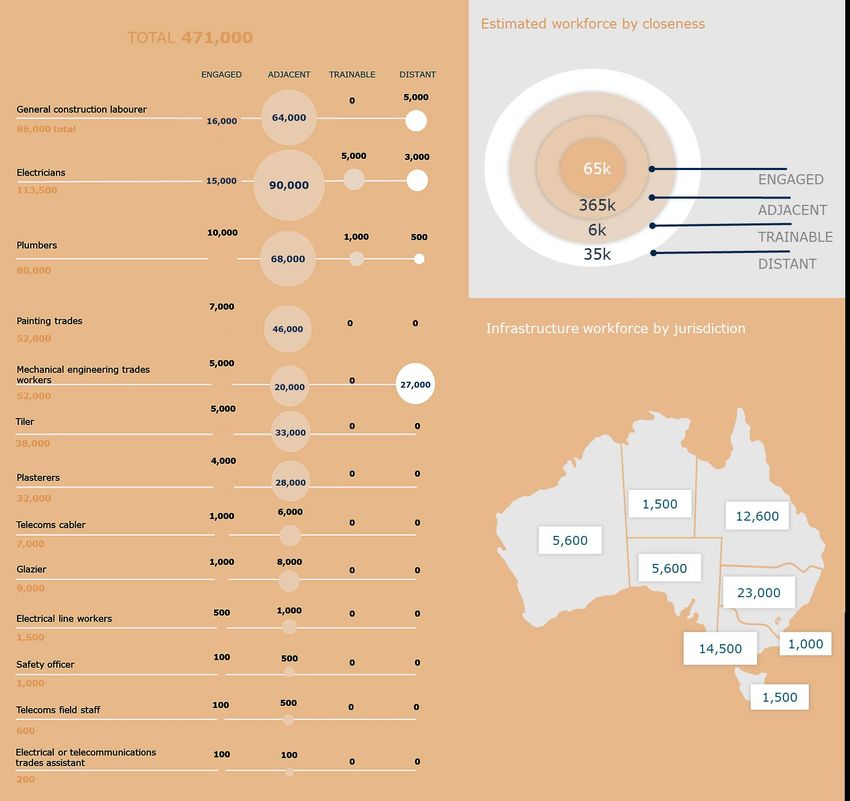
Figure 8 provides definitions of the readiness categories and a snapshot of the total workforce. It
shows that while there is a large adjacent workforce in the other construction sectors, only project
management professionals have significant numbers in the trainable category. While there is a large
distant category, these individuals would need significant retraining before they could usefully
contribute to public infrastructure projects.
More detail is available in Appendix B – Occupational group snapshots, which includes the numbers
for specific occupations and jurisdictional distributions.
OFFICIAL Page 18Figure 8: Snapshot of workforce relevant to public infrastructure 11
There are a further 1.18 million workers in relevant occupations, but
many are in fundamentally different roles
Figure 8 shows there are a total 1.37 million people working in the relevant occupations outlined in
Section 1. 63% of this workforce are in the construction industry, according to Australia and New
Zealand Standard Industrial Classifications (ANZSIC) definitions, which includes public
infrastructure, along with residential construction, civil construction and private industrial and
commercial construction. The remaining 37% work in other industries such as professional, scientific
and technical services, transport, postal and warehousing, public administration and safety and
mining. Figure 9 below shows how these individuals are distributed by industry.
OFFICIAL Page 19Figure 9: Distribution of relevant occupations by industry 12
63% 13% 8% 5% 3% 8%
Construction Professional, Transport, Public Administration Mining Other
Scientific and Postal and and Safety
Technical Services Warehousing
This shows that large portions of the 1.18 million workforce in the adjacent, trainable and distant
categories are in fundamentally different roles and may not actually have the skills needed to work
in public infrastructure, although they could be retrained with sufficient time and resources. While
this presents as an opportunity to address changing workforce requirements of public infrastructure
it will not be a realistic solution in many cases.
Most of the adjacent, trainable and distant workforce is already gainfully employed, and so the
individual must want to leave to attract them to public infrastructure. Overcoming this hurdle is not
insignificant, as industry consultations have repeatedly referenced the difficulty of managing
workforces through boom and bust periods, which are hard to predict and make the industry
unappealing to new entrants.
Many other industries that rely on similar skillsets often pay more and are more likely to keep or
attract individuals. Figure 10 shows that construction has relatively low average earnings compared
to other relevant industries, suggesting that attracting individuals from other industries is not a
reliable approach, and would likely result in a significant escalation in costs.
Figure 10: Average weekly earnings for most common industries among relevant occupations 13
The engaged workforce resides in cities and larger states
The engaged workforce is geographically concentrated, reflecting the location dependent nature of
public infrastructure projects. Figure 11 below shows that three states dominate, with 79% of
individuals based in New South Wales, Victoria and Queensland.
OFFICIAL Page 20Figure 11: Geographic distribution of engaged workforce and total population by jurisdiction 14
Engaged workforce
% of national
engaged workforce
% of total
population 3k
1.9%
1%
34k
18.9%
14k 20.2%
7.6%
10.4%
15k
8.0% 66k
6.9%
3k 36.4%
31.8%
1.5%
1.7%
43k
23.5%
26.0%
4k
2.2%
2.1%
Total population data based on Australian Bureau of Statistics national, state and territory population September 2020.
The engaged supply of individuals is not distributed evenly across states and territories, based on
the detailed supply analysis outlined in Appendix F – Modelling methodology. For example, nearly
two-thirds of engaged engineers, scientists and architects live in New South Wales and Victoria,
while Western Australia has a much higher proportion of finishing trades and labour than other
occupational groups. The Northern Territory is the largest outlier, with a very strong skew towards
both structural and finishing trades, and very few professional roles relative to their workforce. This
is likely reflective of the fact that detailed design is something that can be done remotely but
physical construction can not.
The Northern Territory is also the jurisdiction most concentrated on public infrastructure in 2021,
with 28% of individuals in relevant occupations classified as engaged. No other state has more than
20% of the relevant workforce engaged in public infrastructure, and some of the largest workforces
in Victoria and Queensland have among the lowest focus on infrastructure, with just 12-13% of each
state’s workforce classified as engaged. This indicates that smaller jurisdictions do not have the
diversity in construction work to accommodate significant shifts in demand for public infrastructure.
This may exacerbate the already precarious imbalance between the public infrastructure workforce
concentration in larger states and the population spread across the country as individuals migrate to
where opportunities are greater when projects conclude.
Figure 12 below shows that the construction workforce is also concentrated in urban areas, even
more so than the Australian workforce overall. This includes both the engaged and the adjacent
workforces as they cannot accurately be separated at this granular level. 78% of the construction
workforce live in major cities (as defined by the Australian Bureau of Statistics (ABS) Remoteness
Area classifications), 3% higher than the share of Australia’s total population that live in these
areas. From a market perspective the 3% overrepresentation in major cities can have a significant
impact on the ability to deliver public infrastructure outside of metropolitan areas due to the
challenges incentivising individuals to move to regional areas. This becomes even harder in a
buoyant market.
OFFICIAL Page 21Figure 12: Geographic distribution of construction (engaged and adjacent) workforce by region
(SA3) 15
6k
7500
82k 5000
2500
170k
74k
40k 13k
173k
7k
The constraints of providing a workforce for projects in regional areas, smaller states and states that
compete with other industries such as mining that have the potential to draw individuals from the
public infrastructure workforce, can be difficult to overcome. The availability and nature of work,
lifestyle and training opportunities will always dictate where occupations cluster but understanding
and implementing methods to enable mobility will help to overcome geographical impediments.
OFFICIAL Page 223. Emerging workforce
pressures
At a glance
• This section assesses pressures on the current public infrastructure workforce.
• Of the 50 occupations identified as relevant to public infrastructure, 16 occupations are
rated as likely in shortage and 18 rated as potentially in shortage. Half of these are
engineers, scientists and architects, although there are shortages in all occupation groups.
• Occupations do not capture the full extent of skills required to deliver public infrastructure.
To understand this consideration of roles within occupations is required.
• Analysis of Burning Glass Technologies job advertisements identified 81 roles as likely or
potentially in shortage, 22 of which are within occupations that are unlikely to be in
shortage overall. These roles are mostly senior or specialist.
• The absence of one worker with a specific skill set can have significant implications for a
project and a debilitating impact on the industry if not addressed.
• Shortages are likely being compounded by changing skills needs that lead to the existing
workforce no longer having the right skills. Occupations identified with a high degree of
skill change also indicate a strong likelihood of being in shortage.
• Increased demand for generalist and technical skills is contributing to a large share of
change as employers seek more ‘T shaped’ skill profiles, as described in Section 1.
• The challenge is greatest with engineers who historically have preferenced specialist skills.
Just 24% of skills required for engineers, scientists and architects are generalist,
compared to 32% in other infrastructure occupations.
Australia’s public infrastructure workforce fluctuates in response to demand. Significant capacity
shortages during 2017-18 were followed by a period of weaker demand. This ebb and flow leads to a
loss of skills as the reduced number of available jobs forces people to find employment elsewhere,
after which they may not return. Australia is now at the verge of its next infrastructure boom and
the workforce is showing signs of strain. Shortages already present across occupations and roles are
being compounded by changing skill needs.
This section outlines assessments of current pressures on the public infrastructure workforce.
Australia’s public infrastructure workforce is under strain
The pressure placed by new infrastructure investment on Australia’s public infrastructure workforce
is beginning to show. Some occupations are experiencing short-term acute shortages, whereas other
shortages are reflective of systemic issues in the industry. This raises concerns that as our projected
infrastructure pipeline increases, existing shortages will worsen and new ones will emerge.
Of the 50 occupations identified as relevant to public infrastructure in this context, 16 are likely
already in shortage, 18 are potentially in shortage and only 16 are estimated to have sufficient
capacity to meet existing demand. These are illustrated in Figure 13.
Each occupation has been assessed for signs of current shortages. Four distinct and independent
methods have been used:
• are they on a relevant migration shortlist;
OFFICIAL Page 23• are they recognised by industry through literature or stakeholder consultation;
• is there a shortfall of between the currently modelled supply and demand, and;
• do a set of labour market indicators show shortage.
Each occupation was classified as likely to be in shortage if three or more of these assessments
showed a shortage, potentially in shortage in two assessments suggested a shortage but the other
two did not or were unclear, and unlikely to be in shortage if only one or none of the assessments
identified a shortage. For detail on each of these approaches and assessments by occupation see
Appendix C – Current occupational shortages detail.
Figure 13: Current state shortages across the infrastructure sector 16
Likely Shortages Potential Shortages Unlikely Shortages
• Commercial management
Project • Environmental and
• Construction management
Management • Procurement management
• Risk management
occupational health
Professionals professionals
• Project management
• Building surveyor
• Civil engineer
• Electrical engineer
• Engineering manager • Electronic engineer
• Environmental professionals • IT professionals/engineers
Engineers, • Geologists, geophysicists and • Maintenance planner • Architect
Scientists and hydrogeologists • Production engineer • Landscape architect
Architects • Geotechnical engineer • Structural engineer • Draftsperson
• Land surveyor • Telecommunications engineer
• Materials engineer • Mechanical engineer
• Quantity surveyor
• Other professional engineers,
scientists, etc.
• Bricklayer
• Carpenters and joiners
Structural and • Plant operator
• Concreter
• Rigger and dogman
Civil Trades • Driller (piling/foundation) • Crane operator
• Structural steel erector
and Labour • Rail track worker
• Truck drivers
• Road based civil plant
Operator
• Electrical or
telecommunications trades
• Electrical line workers • Electricians
Finishing assistant
• Telecommunications cabler • Glazier
• Mechanical engineering
Trades and • Telecommunications field • Painting trades
trades workers
Labour staff • General construction
• Plasterers
• Tiler labourer
• Plumbers
• Safety officers
Engineering occupations are currently most at risk of shortage. This is consistent with the feedback
from industry stakeholders such as Engineers Australia and Consult Australia. Geophysicists,
geotechnical engineers, structural engineers and civil engineers are identified as shortages in most
assessment methods. Some of the main drivers of shortages are flagged as lack of applicants with
technical skills and experience, and lack of applicants altogether. Master Builders Australia raise
similar concerns noting that capital cities as well as regional New South Wales and Queensland are
experiencing difficulties recruiting sufficiently skilled civil engineers. 17 These shortages are typically
difficult to address through short-term measures because they require technical expertise and long
training periods.
Some shortages appear to be ongoing and systemic, for example building surveyors. The recent
Building Confidence Report indicated an extreme workforce supply issue in the building surveying
profession due to an ageing workforce and ill-defined career pathway. 18 Similar concerns were
raised by Consulting Surveyors National which noted a workforce shortfall of over 600 surveyors and
spatial scientists nationally. This shortfall is expected to continue to increase due to retirements as
the average age of surveyors is around 52 years. 19
Project management professionals show mixed signs of shortage. Construction managers and
procurement managers are on skilled migration lists, while analysis of supply and demand shows
OFFICIAL Page 24You can also read