Infrastructure Investments Fund - Mendocino County Employees Retirement Association
←
→
Page content transcription
If your browser does not render page correctly, please read the page content below

Infrastructure Investments Fund
Mendocino County Employees Retirement Association

December 11th, 2019

As of September 30, 2019 and in U.S. dollar terms unless otherwise specified
FOR INSTITUTIONAL/WHOLESALE/PROFESSIONAL CLIENTS AND QUALIFIED INVESTORS ONLY – NOT FOR RETAIL USE OR DISTRIBUTION
STRICTLY PRIVATE | CONFIDENTIAL

Today’s Presenters

                      Daniel Galinko, Vice President, is an Investment Specialist in the Infrastructure Investments Group. Prior to joining J.P. Morgan in 2017, he was
                      a Senior Associate at StepStone Group where he served on the research team, conducting due diligence on primary fund, co-investment, and
                      secondary investments across the private equity, natural resources, and infrastructure asset classes. StepStone Group provides advisory and
                      asset management services to institutional clients on a global basis. Before joining StepStone, Daniel started his career at Oppenheimer &
                      Company where he supported that firm’s private equity fund of funds and co-investment platform. Daniel earned a BA in Economics and East
                      Asian Studies from Brandeis University and an MA in Regional Studies East Asia from Harvard University.

                      Shawn Parris, Vice President, is a Client Advisor within J.P Morgan Asset Management. He is responsible for providing asset management
                      solutions for defined benefit, defined contribution, endowment and foundations for U.S. institutional investors, including corporations, municipalities,
                      not-for-profits, higher education and healthcare systems. Shawn previously worked at Schroders Investment Management as an Institutional
                      Manager. At Schroders he led the relationship management and business development efforts of the firm in the western region. Prior to Schroders,
                      Shawn worked at Philadelphia International Advisors, where he marketed the firm's investment products to clients across North America. Shawn
                      received a B.Sc. in Finance from Drexel University and an MBA from the Lebow School of Business. He holds the FINRA Series 7, 66 and 3
                      licenses.

There can be no assurance that these professionals will continue to be involved with JPMIM or the Investment Advisor, or that the past performance or success of any such professional serves as an
indicator of such professional’s future performance or success.

2 | FOR INSTITUTIONAL/WHOLESALE/PROFESSIONAL CLIENTS AND QUALIFIED INVESTORS ONLY – NOT FOR RETAIL USE OR DISTRIBUTION
STRICTLY
                                                                                                                         STRICTLY    PRIVATE
                                                                                                                                  PRIVATE    | CONFIDENTIAL
                                                                                                                                           | CONFIDENTIAL

Private Core Infrastructure Market

3 | FOR INSTITUTIONAL/WHOLESALE/PROFESSIONAL CLIENTS AND QUALIFIED INVESTORS ONLY – NOT FOR RETAIL USE OR DISTRIBUTION
STRICTLY PRIVATE | CONFIDENTIAL

Why Core/Core+ Infrastructure Equity?

                                  D2                                           I                                                  Y

                     Diversification                                     Inflation                                               Yield
                                                                        Protection

          ■ Low correlation to other                          ■ Core/core+                                       ■ Core/core+
            major asset classes                                 infrastructure typically                           infrastructure typically
          ■ Local assets with unique                            exhibits strong inflation                          exhibits strong cash flow
            risk/return drivers                                 linkage                                            generation
          ■ Downside protection and                           ■ Inflation is a pass-
            lower volatility                                    through under many
                                                                contractual and
                                                                regulatory structures

For illustrative purposes only.

4 | FOR INSTITUTIONAL/WHOLESALE/PROFESSIONAL CLIENTS AND QUALIFIED INVESTORS ONLY – NOT FOR RETAIL USE OR DISTRIBUTION
226bbbc0-bdca-11e9-bc2f-9a16b6810c67 - August 13th, 2019
                                                                                                                                                                                STRICTLY PRIVATE | CONFIDENTIAL

                      Core/Core+ Infrastructure is a Foundational Element of a Balanced Portfolio
                       Consistent Cash Generation Results in a Lower Relative Expected Risk Profile
                                                                     Illustrative Expected Cash Yield vs. Total Return Profile
                                                  Historical Annualized Volatility
                         8                           Global
                                                     Equities
                                                                Global Fixed
                                                                  Income     Private Equity IIF (net, local)
                                        5-year        10.9%        2.9%          4.3%            1.3%

                                        10-year       13.4%        2.8%            6.3%           2.3%
Projected Yield (%)

                         6                                                                                                      IIF (Net Local Returns)1
                                                                CORE / CORE+ INFRA ASSETS
                                                            Cashflow drives significant yield & underpins
                                                           stability of total return & diversification potential
                         4

                                 Global Agg Bonds                             60/40 Portfolio
                                                                                                                                                           NON-CORE INFRA ASSETS
                         2                                                                             AC World Equity
                                                                                                                                               Growth & capital appreciation with greater risks
                                                                                                                                                   reducing portfolio level diversification

                                                                                                                                                                      Private Equity

                                                           2                           4                           6                      8                         10                         12                         14
                                                                                                               Expected Total Return (%)
                      Source: Bloomberg, Burgiss, JP Morgan. Historical statistics for Global Equity based on the GDDUWI Index from MSCI, for Global bonds data is based on LEGATRUU index from Bloomberg, Burgiss data
                      is used for Private Equity, and IIF data for the IIF gross returns. The projections in the chart above are based on JPMAM proprietary long term capital markets assumptions (10 – 15 years) for risk, return
                      and correlations between major asset classes. The assumptions are presented for illustrative purposes only. They must not be used, or relied upon, to make investment decisions. The assumptions are not
                      meant to be a representation of, nor should they be interpreted as JPMAM investment recommendations. Note that these asset class assumptions are passive-only; they do not consider the impact of active
                      management. 1Yield in the middle of the Fund’s target 5-7% target. Actual yield for the last 5 years was 6.9% as of 3/31/19. IIF in local currency assumptions based on a
                      10.3% Fund level weighted average discount rate as of 3/31/2019 net of fees, tax, expenses and excluding F/X. The target returns are for illustrative purposes only and are
                      subject to significant limitations.
                      5 | FOR INSTITUTIONAL/WHOLESALE/PROFESSIONAL CLIENTS AND QUALIFIED INVESTORS ONLY – NOT FOR RETAIL USE OR DISTRIBUTION
STRICTLY PRIVATE | CONFIDENTIAL
IIF Defines Core Investment Strategy Focusing on Yield
Essential services that often operate on a monopolistic basis either by regulatory structure or long-term
contract, which drives visibility into cash yield
Distribution/Regulated Assets: Contracted/Power Assets: GDP-Sensitive Assets:
Monopolistic regulatory frameworks Long-term contracts with volume Mature assets with significant
give visibility into stable cash flows minimums which typically result in demand history often underpinned
yield approximating total return by long-term contracts
Water and wastewater
Electricity Conventional generation Airports (with contracts)
distribution/transmission Renewable generation Seaports (with contracts)
Natural gas distribution Storage Rail Leasing (with contracts)
For illustrative purposes only.
6 | FOR INSTITUTIONAL/WHOLESALE/PROFESSIONAL CLIENTS AND QUALIFIED INVESTORS ONLY – NOT FOR RETAIL USE OR DISTRIBUTION
09/19 - 50c7bc30-d49a-11e9-8402-6efd0ee825d7
STRICTLY PRIVATE | CONFIDENTIAL
Demand for infrastructure investments continues to grow
Significant gap exists between infrastructure needs and current investment levels
Total deal volume in 2018 ($1.62tn) was slightly lower than the volume in 2017 ($1.63tn)
The 2018 deal volume was close to 2.5 times the level in 2007 ($662bn) and 3 time the level in 2010 ($507bn)
However, this level represents only about 40% of the minimum estimated infrastructure investment ($3.3tn) needed to meet UN’s 2030
Sustainable Development Goals (SDG)
OECD estimates for infrastructure investment needs range between $3.3tn and $7.9tn annually to meet its 2030 SDG
By comparison, total AUM at private infrastructure funds remains small at $556bn, dry powder estimated at $191bn, as of December
2018
Private Infrastructure Investments vs Total
3,500
Deal Volume and AUM, $bn
3,000
2,500
2,000
1,500
1,000
500
0
2007 2008 2009 2010 2011 2012 2013 2014 2015 2016 2017 2018
Total Deal Volume ($bn) Total Infrastructure Investment Need ($bn) Total Private Infrastructure Fund AUM ($bn)
Source: Preqin (Infrastructure Deal data and Private Infrastructure Fund AUM), G20-Global Infrastructure Hub (“Technical note on estimates of infrastructure investment
needs” Total Infrastructure Investment). Both Primary (greenfield/brownfield) and Secondary deals included. Missing deal volume is estimated using the average size of
known deals. Data as of December 2019, accessed as of August 2019. Total Deal Volume includes only private infrastructure transactions. Total Infrastructure Investments
include public and private investments.
7 | FOR INSTITUTIONAL/WHOLESALE/PROFESSIONAL CLIENTS AND QUALIFIED INVESTORS ONLY – NOT FOR RETAIL USE OR DISTRIBUTION
09/19 - 50c7bc30-d49a-11e9-8402-6efd0ee825d7
STRICTLY PRIVATE | CONFIDENTIAL
Infrastructure Equity Risk Premium (ERP) has remained stable since 2000
Even as discount rates for private infrastructure have declined in concert with global yields, the equity risk premium in private
infrastructure has remained stable, averaging 7.2% since 2000
Infrastructure equity risk premium has averaged 98bps higher than developed market equity risk premium since 2012
Greater investor interest in private infrastructure assets is driving the discount rate lower. However, the decline is lower than the
decline in global government bond yields, resulting in private infrastructure risk premium increasing
As most global central banks are in the midst of a cutting cycle, this trend is likely to continue, attracting greater interest from investors
Estimates for core infrastructure discount rates vs. risk-free proxies
US 10-yr govt bond yield UK 10-yr govt bond yield EU 10-yr govt bond yield
14% Core infrastructure discount rate Infrastructure ERP DM ERP (Avg since 2012 = 6.04%)
12%
10%
8.2% 8.3%
7.6% 7.9%
7.3% 7.5%
8% 6.9% 7.0% 7.1% 7.1% 6.9% 7.1% 7.3% 6.9%
6.7% 6.7% 6.6% 6.7% 6.6%
7.4%
6% 6.7%
4%
2%
0%
-2%
2000 2001 2002 2003 2004 2005 2006 2007 2008 2009 2010 2011 2012 2013 2014 2015 2016 2017 2018 2019
Source: Bloomberg, JPMAM. 2019 discount rate represents year-to-date transactions. Equity risk premiums represent the difference between the core
infrastructure discount rate and the geographically weighted annual average government bond yields. Data as of June 2019.
8 | FOR INSTITUTIONAL/WHOLESALE/PROFESSIONAL CLIENTS AND QUALIFIED INVESTORS ONLY – NOT FOR RETAIL USE OR DISTRIBUTION
STRICTLY PRIVATE | CONFIDENTIAL
Each Form of Infrastructure Investing – Listed and Unlisted – Can Play an Important
Role Within an Overall Portfolio
Benefits: Considerations: Role in a Portfolio:
True diversification Less liquid (e.g., semi-annual,
with soft lock up)
Lower volatility of returns
Private Typically higher fees
Downside protection potential
Core
Inflation sensitivity
Infrastructure
Control over management / governance
Ability to diversify by geography / sector
Typically higher liquidity Public equity market-like volatility
Typically lower fees, depending on High equity beta / equity market
Listed structure correlations
Infrastructure Not always pure infrastructure
exposure, depending on the
vehicle
Each form of infrastructure investing has its benefits and considerations. Allocations should be driven by
investors’ objectives and existing portfolio holdings, with consideration for an appropriate mix across structures.
For discussion purposes only.
9 | FOR INSTITUTIONAL/WHOLESALE/PROFESSIONAL CLIENTS AND QUALIFIED INVESTORS ONLY – NOT FOR RETAIL USE OR DISTRIBUTION
STRICTLY
                                                                                                                      STRICTLY    PRIVATE
                                                                                                                               PRIVATE    | CONFIDENTIAL
                                                                                                                                        | CONFIDENTIAL

Infrastructure Investments Fund

10 | FOR INSTITUTIONAL/WHOLESALE/PROFESSIONAL CLIENTS AND QUALIFIED INVESTORS ONLY – NOT FOR RETAIL USE OR DISTRIBUTION
d99c5e30-0569-11ea-b259-4eb51feb0b87 - November 12th, 2019
STRICTLY PRIVATE | CONFIDENTIAL
IIF ─ Open Ended Core/Core+ Infrastructure Portfolio
Seeks to deliver diversification, inflation protection, stable cash yield (“D.I.Y.”) and attractive
risk-adjusted returns through market cycles
Strategy Overview Summary of Key Strategy Elements
Founded in 2006; open-ended perpetual structure Net Asset Value USD 12.0 billion (53% loan-to-value)
Core/core+ infrastructure; long-term, contracted/regulated assets Target Return 8-12% net1
19 portfolio companies (464 assets) in 25 countries & 12 subsectors
Target Cash Yield 5-7% on NAV1
Target control investments in private middle market platforms:
Average equity transaction size of ~USD 75mm since 2013 Sector/Geographic Distribution/Regulated, GDP-Sensitive &
Focus Contracted/Power in OECD
ESG integrated into investment and asset management processes
Co-largest/controlling owner of 16 of 19
Estimated queue of 6 - 12 months or less from closing (subject to Governance
portfolio companies
change)
Cash Yield as Foundation of Total Return (% p.a.)2 Existing Portfolio
$794
Geographic Breakdown: Sector Breakdown:
$560 8.2%
$220 $250 $345 Canada, Other,
7.0% 4.5% 4.3%
USD in millions
$157 6.2% 6.2% 6.1%
Australia, US 25.2% GDP-
6.0% Sensitive
5.0% 31.0%
Contracted
/Power
45.3%
UK 17.0%
Western Distribution
Europe /Regulated
2013 2014 2015 2016 2017 2018 43.0% 23.7%
All data as of September 30, 2019. The advisor seeks to achieve the stated objectives. There can be no guarantee the objectives will be met. 1 The target returns and cash yield are for
illustrative purposes only and are subject to significant limitations. An investor should not expect to achieve actual returns or yield similar to the targets shown above. Please see the complete
Target Return disclosure at the conclusion of the presentation for more information on the risks and limitation of target returns. 2 Yield on NAV, the one-year cash yields were
calculated using individual quarterly cash yields. Majority of yield expected to be ordinary income with the balance return of capital. 3 Other includes Japan, Chile and
South Africa. 4 2.4% invested in Sweden, which is denominated in SEK.
11 | FOR INSTITUTIONAL/WHOLESALE/PROFESSIONAL CLIENTS AND QUALIFIED INVESTORS ONLY – NOT FOR RETAIL USE OR DISTRIBUTIONd99c5e30-0569-11ea-b259-4eb51feb0b87 - November 12th, 2019
STRICTLY PRIVATE | CONFIDENTIAL
IIF Investment Philosophy – Long-Term Ownership and Accountability
■ Open-ended fund structure provides the underlying long-term benefits
Long-Term ■ Power of compounding returns over time
■ Strong alignment for investor including significant cash invested by the IIG team
■ Control positions facilitate active asset management
Governance & Control ■ IIF has a dedicated team; no directly competing funds or strategies
■ Expertise of independent directors supplement IIF team
■ Defines core infrastructure - underpinned by contracted and regulated cash
Durable Cash Yield flows
■ Key diversifier of an investor’s portfolio away from traditional asset classes
■ Deploying capital behind boards and management teams we know and trust
Platform Investing ■ Typically smaller, less competitive deals; average size ~USD 75mm since 2013
■ Allows crossover from being financial to strategic investor
■ ESG integrated across all levels of governance and into investment and asset
ESG management processes
For illustrative purposes only. As of September 30, 2019.
12 | FOR INSTITUTIONAL/WHOLESALE/PROFESSIONAL CLIENTS AND QUALIFIED INVESTORS ONLY – NOT FOR RETAIL USE OR DISTRIBUTIONd99c5e30-0569-11ea-b259-4eb51feb0b87 - November 12th, 2019
STRICTLY PRIVATE | CONFIDENTIAL
Dedicated IIG Team of 52 Supported by 80 Independent Directors Across the Portfolio
Paul Ryan, MD Matthew LeBlanc, MD Brian Goodwin, MD
Portfolio Manager Chief Investment Officer Head of Portfolio Asset Management
New York New York New York
Investment & Asset Management Team — New York Investment & Asset Management Team — London
Landy Gilbert Andrew Kapp Hai-Gi Li John Lynch Rob Hardy Mark Walters
Managing Director Managing Director Managing Director Managing Director Managing Director Managing Director
Ed Wu Kathleen Lawler Dan Mitaro Sara Sulaiman Mark Scarsella Ben Francis
Executive Director Executive Director Executive Director Executive Director Executive Director Vice President
Marko Josipovic Preston Scherer Farah Meroue Sneha Sinha Gary Blackburn
Georgina Yea
Vice President Vice President Vice President Vice President Associate
Associate
Michelle Jack Gillespie Frederico Correia
Clara Lequin Stephen Leh
Michael Karp van Ryneveld Associate Associate
Associate Associate
Associate Associate
Alexandru
Sophia Sciabica Mauricio Palazzi Godoroja
Associate Associate Finance/Tax
Associate
Stephen Liu, ED
Manura Miriyagalla, ED
Client Strategy Fund Execution Research Esther Cho, VP
April Lee, VP
Nick Moller Gilly Zimmer Dan Galinko Amanda Wallace Hannah Logan Karthik Sara Scoppetuolo, VP
Executive Executive Vice Managing Executive Narayan Simon Choi, Associate
Director Director President Director Director Vice President
New York New York New York New York London New York Client Service
Jonathan Schwartz, VP
Chris Simard Cassie Winn Ebru Sert Sinead Browne Katarina
Esandra Blackwood, VP
Vice President Vice Executive Associate Roele
Frances Huang, Associate
New York President Director New York Associate
Nina Maurio, Associate
New York New York London
Penn Sednaoui, Associate
All listed individuals are employees of JPMAM. There can be no assurance that the professionals currently employed by JPMAM will continue to be employed by
JPMAM or that the past performance or success of any such professional serves as an indicator of such professional’s future performance or success.
Source: JPMAM, as of November 2019.
13 | FOR INSTITUTIONAL/WHOLESALE/PROFESSIONAL CLIENTS AND QUALIFIED INVESTORS ONLY – NOT FOR RETAIL USE OR DISTRIBUTIONd99c5e30-0569-11ea-b259-4eb51feb0b87 - November 12th, 2019
STRICTLY PRIVATE | CONFIDENTIAL
Global Reach and Scale of the IIF Portfolio
For illustrative purposes only. As of December 31, 2018.
14 | FOR INSTITUTIONAL/WHOLESALE/PROFESSIONAL CLIENTS AND QUALIFIED INVESTORS ONLY – NOT FOR RETAIL USE OR DISTRIBUTIONd99c5e30-0569-11ea-b259-4eb51feb0b87 - November 12th, 2019
STRICTLY PRIVATE | CONFIDENTIAL
A Diversified Portfolio: USD 12.0 Billion; 19 Portfolio Companies, 464 Underlying Assets
Existing well diversified portfolio where no single asset comprises more than 5.7% of the Fund
Portfolio Companies by % NAV – Q3 2019 Diversity By Country (NAV%) – Q3 2019
Canada Other1
100% 1.8% 4.3%
4.5%
Coastal 3.3%
North Sea Australia
5.0%
90% SWGen
6.0% Continental
5.7% Europe
Novatus 43.1%
Contracted/ Power United
80% 11.1%2 45.3% Kingdom
Sonnedix
(393 assets) 17.0%
70%
18.8%3, 4
Ventient United States
60%
25.2%
1.5%
BWT 2.9%
50%
Noatum 4.5%
Diversity By Subsector (NAV%) – Q3 2019
GDP-Sensitive
Nieuport
4.9% 31.0% Midstream Regulated Gas
40% Beacon Gas Gen. 3.3% 12.6% Regulated
6.0% (57 assets) 5.0% Water
NQA 7.1%
Solar Gen.
30% 11.2% 12.7% Regulated
Koole Electricity
1.9% 1.9%
20% ENW 2.2% Distribution/ District Heating
Varme 3.4% Regulated 2.2%
SWWC 3.6% Wind Gen. Airports
Southern 23.7% 24.2%
10% 5.7% 10.5%
(14 assets)
NorteGas
6.8% Storage
0% Summit Sea Ports Rail Leasing 12.8%
2.9% 4.9%
All data as of September 30, 2019.
1 Other includes Chile, Japan, and South Africa. Diversification does not guarantee investment returns and does not eliminate the risk of loss.
2 Comprises 246 assets.
3 Includes the Vision Renewables platform and comprises 104 assets.
4 Ventient closed on an expected refinancing in Q4 2019 that decreased Ventient’s percentage of the portfolio to ~10.0%
15 | FOR INSTITUTIONAL/WHOLESALE/PROFESSIONAL CLIENTS AND QUALIFIED INVESTORS ONLY – NOT FOR RETAIL USE OR DISTRIBUTIONd99c5e30-0569-11ea-b259-4eb51feb0b87 - November 12th, 2019
STRICTLY PRIVATE | CONFIDENTIAL
IIF Portfolio Cash Flow is Focused on Regulated and Long-Term Contracted Assets
Regulated and long-term contracted assets make up a large portion of the current IIF portfolio, and are expected to constitute a
significant portion of value even after 10 years
The proportion of regulated and contracted assets will be even higher after including the impact of some recent transactions and pro
forma for the completed portfolio company operations
The forecast presented is for current portfolio only and does not assume any re-contracting
Assuming no re-contracting, more than 55% of revenue is contracted/regulated in 2029
100% 3% 4% 6% 7% 7% 7% 8% 8% 8% 8% 8%
90%
80% 33% 36% 36% 36% 36% 38% 38% 38% 37%
70% 38% 39%
60%
50%
34% 31% 28% 26% 26% 21% 20% 18% 18%
23% 22%
40%
30%
20% 37%
30% 30% 30% 31% 31% 32% 33% 33% 34% 35%
10%
0%
2019 2020 2021 2022 2023 2024 2025 2026 2027 2028 2029
Regulated Contracted GDP ‐ Sensitive Uncontracted
Source: Data as of 2Q 2019, in USD, revenues beyond Q2 2019 are forecast. Opinions, estimates, forecasts, and projections are based on current market conditions,
constitute our judgment and are subject to change without notice. There can be no guarantee they will be met. Past performance is no guarantee of comparable future
results.
16 | FOR INSTITUTIONAL/WHOLESALE/PROFESSIONAL CLIENTS AND QUALIFIED INVESTORS ONLY – NOT FOR RETAIL USE OR DISTRIBUTIONd99c5e30-0569-11ea-b259-4eb51feb0b87 - November 12th, 2019
STRICTLY PRIVATE | CONFIDENTIAL
Current Portfolio – 19 Companies with 464 Underlying Assets1
Distribution/Regulated (24%) Contracted/Power (45%) GDP-Sensitive (31%)
Electricity North West Nortegas Coastal States Winds Ventient Energy2 Beacon Rail BW Terminals
Regulated electric Second largest gas North American wind Diversified portfolio of 104 Rolling stock leasing Liquid bulk storage business
distribution network providing distribution company in portfolio in New York, contracted wind farms company which operates in with over 2.4 million barrels
power to over 6mm people in Spain servicing over 1mm Oregon, and Texas totalling totaling more than 1,100 MW the freight and passenger of capacity located in
northwest England supply points with natural 354 MW’s of capacity throughout the train markets in the UK and Louisiana and Georgia
gas / liquefied propane gas UK and Europe Continental Europe
25.0% ownership 59.3% control various control 100% control 100% control 100% control
Southern Water SouthWest Water Novatus Energy Sonnedix Power Koole Terminals Nieuport Aviation
Services Company 1,600 MW portfolio Holdings European liquid bulk storage Owns and operates the
Regulated water and Regulated water and of wind and Interest in global solar company with c.3.6m cubic passenger terminal at Billy
wastewater network in wastewater utilities serving solar projects developer, owner and meter capacity focused on Bishop Toronto City Airport,
southeast England serving over 500,000 people in 5 in the U.S. operator the Amsterdam-Rotterdam- Toronto’s second largest
over 7mm customers states Antwerp region airport
39.8% control 100% control 100% control 100% control3 100.0% control 100% control
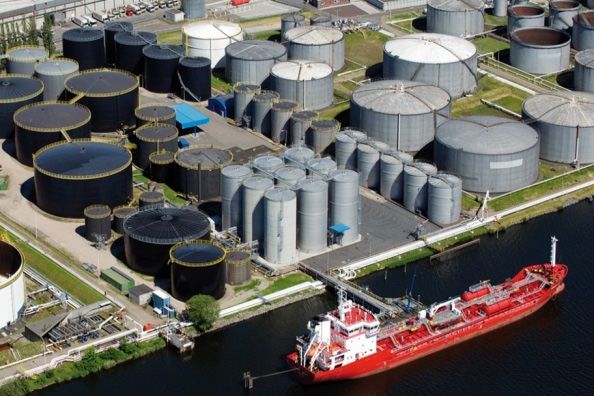
Summit Utilities Värmevärden Southwest North Sea Noatum Ports North Queensland
Regulated natural gas District Heating company in Generation Midstream Partners Leading operator in Airports
distribution utilities with Sweden that provides 1,600 MW gas fired Transports and processes the Iberian Peninsula Cairns and Mackay Airports,
operations in Arkansas, environmentally sustainable generation facilities in ~ 20% of the UK’s natural comprised of 18 terminals in serving the Great Barrier
Colorado, Maine, Missouri heat for residential and non- 4 states gas on an average day Spain Reef and Bowen Basin
and Oklahoma residential clients
100% control 100% control 100% control 50% control4 various control 66.1% control
Denotes Platform Investments
Assets identified for future potential equity capital deployment. The companies above are shown for illustrative purposes only. Their inclusion should not be interpreted as a recommendation to buy
or sell.
Note: Control includes managed co-investment stakes.1 Data as of September 30, 2019. Diversification does not guarantee investment returns and does not eliminate the risk of loss. 2 Includes the Vision
Renewables platform. 3 Includes management stake. 4 Split control with financial partner and includes a management stake.
17 | FOR INSTITUTIONAL/WHOLESALE/PROFESSIONAL CLIENTS AND QUALIFIED INVESTORS ONLY – NOT FOR RETAIL USE OR DISTRIBUTIONd99c5e30-0569-11ea-b259-4eb51feb0b87 - November 12th, 2019
STRICTLY PRIVATE | CONFIDENTIAL
ESG Overview and Initiatives
The Fund incorporates core ESG principles throughout its investment and ongoing asset
management processes
• Majority Control – key for implementation of sustainable practices
• Independent Board of Directors – provides diversity of thought, IIF 2018-2019 ESG Initiatives
Governance relationships and experience
• Culture of Accountability and Alignment – framework for – Information Protection and
investors’ long-term goals
Cybersecurity
• Stakeholder engagement is critical for maintaining social license to – Supply Chain Management
operate
Stakeholders • Proactive approach to managing relationships, including customers, – Resilience and Disaster
employees, communities, regulators, governmental entities, debt
providers and supply chain
Preparedness
– Stakeholder and Community
• United Nations Principles for Responsible Investing (UN PRI)
Engagement
signatory1
UN PRI
• “A” rating for Direct Infrastructure on the 2019 UN PRI annual
assessment report2
• Global Real Estate Sustainability Benchmark (GRESB) member3 and
Fund ranked 5th out of 28 in its peer group in 2019
GRESB • 8 companies received 5 stars; 5 companies received 4 stars and 3
companies received 3 stars; 3 assets were #1 in peer group and
sector leaders4
• We believe more than 75% of the IIF portfolio contributes to the
SDG achievement of the United Nations Sustainable Development Goals
As of September 30, 2019. 1 JPMAM is the signatory to UN PRI. 2 For more information regarding the PRI assessment methodology or to view the 2019 JPMAM RI
Transparency Report, please go to www.unpri.org.The 2019 JPMAM assessment Report is available upon request. 3JPMAM is a member of GRESB
Infrastructure. 416 of 18 portfolio companies completed the 2019 GRESB submission. Coastal and BWT did not participate; BWT did not participate because
ownership was less than six months of the submission period. The portfolio company submissions includes separate submissions by CSP Spain and Noatum
Maritime. UNPRI and GRESB ratings are not reliable indicators of current and/or future results or performance of the underlying assets. ESG considerations
are one aspect of our decision making process. We continue to only make investments that we believe will be return-enhancing and accretive to our clients’
18 | FOR INSTITUTIONAL/WHOLESALE/PROFESSIONAL CLIENTS AND QUALIFIED INVESTORS ONLY – NOT FOR RETAIL USE OR DISTRIBUTION
portfolios.d99c5e30-0569-11ea-b259-4eb51feb0b87 - November 12th, 2019
STRICTLY PRIVATE | CONFIDENTIAL
2018-2019 Acquisition Activity
BW Terminals
North Sea Midstream
Liquid bulk storage business with over
New Investments
2.4 million barrels of capacity in NSMP is a leading independent North
Louisiana and Georgia Sea midstream infrastructure
Control: 100% business
Control: 50%*
Closed in Q1 2019
Q2 2018 Q3 2018 Q4 2018 Q1 2019 Q2 2019 Q3 2019
Platform Investments
Beacon SWWC Koole Beacon Nieuport Noatum
Sonnedix Ventient Coastal Ventient
Maritime
Expanded presence Double Oak Consolidation Vortex Energy MIQ Logistics Vortex Energy
Odjfell Terminals Increased fleet Closed on
Increased
Consolidation
in UK and Wastewater utility Acquired by acquiring 76 acquisitions of Acquired 49% of a Acquired 88% of Acquired a U.S. Acquired remaining
European markets locomotives ownership to 100% 1 GW portfolio of non-asset based 51% of a 1 GW
located in Alabama; complementary portfolio solar PV the Class A tax
increasing fleet by provides services to terminal in Rotterdam plants in Italy and European onshore equity interests provider of end- portfolio
110 locomotives ~5,700 dwelling Increased Ownership France; wind farms to-end logistics, German wind
units IIF increased its construction Vision Renewables transportation portfolio
Seminole ownership to 100% projects in Chile Acquired 16.5 MW and distributions Closed on a 141
3 water treatment and Japan onshore wind farm services MW operating
plants with treated in France onshore wind
raw water under a portfolio in Germany
40-year take-or-pay
water supply
agreement
As of September 30, 2019.
These examples are included solely to illustrate the investment process and strategies which have been utilized by the manager. It should not be assumed that investments
within the portfolio have or will perform in a similar manner to the investment above. Please note that this investment is not necessarily representative of future investments
that the manager will make. There can be no guarantee of future success. *Split control with financial partner and includes a management stake.
19 | FOR INSTITUTIONAL/WHOLESALE/PROFESSIONAL CLIENTS AND QUALIFIED INVESTORS ONLY – NOT FOR RETAIL USE OR DISTRIBUTIONd99c5e30-0569-11ea-b259-4eb51feb0b87 - November 12th, 2019
STRICTLY PRIVATE | CONFIDENTIAL
IIF Has Demonstrated Strong Risk-Adjusted Returns
IIF has demonstrated robust returns with less volatility than other asset classes since inception
Evolution of USD 1 Invested in Q2 2007 to Q3 2019
$2.75 Annualized Return
Glo bal IIF IIF Private Equity
Glo bal listed
Equities infrastructure (gro ss, lo cal) (gro ss, USD) IIF (gross, Local)
$2.50 5-year 8 .4 % 7 .3 % 8 .5 % 5 .8 % IIF (gross, USD)
10-year 9 .9 % 8 .6 % 7 .5 % 6 .1%
US private real estate
$2.25 Global equities
Annualized Volatility
Glo bal IIF IIF
Global listed infrastructure (S&P)
Glo bal listed
Equities infrastructure (gro ss, lo cal) (gro ss, USD) Global bonds
$2.00
5-year 10 .9 % 9 .8 % 1.3 % 4 .5 % Hedge funds
10-year 12 .1% 9 .7 % 2 .0 % 4 .6 %
$1.75
$1.50
$1.25
$1.00
$0.75
$0.50
Source: Bloomberg, NCREIF, J.P.Morgan Asset Management. Global equities, global listed infrastructure, global bonds, and US real estate are measured by MSCI World, S&P Global Infrastructure Index,
Barclays Global Agg, and NFI-ODCE, respectively. Private Equity from 15 year quarterly Burgiss data, and available through Q2-2019. All series are based on gross of fees, net of taxes and expenses total
return indices, and denominated in USD; please refer to the IIF Historical Return & Yield Summary slide for returns for IIF net of fees and full disclosure regarding fee
calculations. Data as of Q3-2019. IIF Past performance is not indicative of future results. Indices do not include fees or operating expenses and are not available for
actual investment.
20 | FOR INSTITUTIONAL/WHOLESALE/PROFESSIONAL CLIENTS AND QUALIFIED INVESTORS ONLY – NOT FOR RETAIL USE OR DISTRIBUTIONd99c5e30-0569-11ea-b259-4eb51feb0b87 - November 12th, 2019
STRICTLY PRIVATE | CONFIDENTIAL
IIF Historical Return & Yield Summary
Net local currency returns represent significant premium to CPI +6.1% and risk-free rate +6.8% over 5 years1
The portfolio is currently being held at a 10.2% weighted average equity discount rate which reflects the
long-term business plans of the underlying portfolio companies2
Returns for Periods Ended September 30, 20193
Five Since Five Year
One Year3 Three Year3 Ten Year3
Year3 Inception3 Volatility
Gross Asset Performance (Local Currency) 10.6% 9.8% 9.4% 8.5% 8.4%
Taxes4 (0.4%) (0.4%) (0.3%) (0.5%) (0.4%)
Fund Expenses4 (0.5%) (0.5%) (0.5%) (0.5%) (0.6%)
Management Fees4 (0.9%) (0.9%) (1.0%) (1.2%) (1.3%)
Net Total Return Local Currency 8.7% 7.9% 7.5% 6.2% 5.9% 1.3%
F/X Impact5 (3.7%) (0.9%) (2.6%) (1.4%) (2.5%)
Net Total USD Return 4.7% 6.9% 4.8% 4.8% 3.3% 4.5%
Cash Yield (Distributions / NAV) 8.1% 7.7% 7.1% 6.1% 5.5% 1.2%
Past performance is no guarantee of future results. Returns include the re-investment of income.
1 Global weighted average CPI and risk-free rate across IIF’s currency exposures (US, UK, Eurozone, Canada, Australia, and Sweden)
2 Represents the weighted average equity discount rate for the portfolio as of September 30, 2019.
3 Performance numbers represent a composite return of the combined fund investor vehicles (FIVs) in existence as of September 30, 2019. Specific FIV and investor returns are shown on the quarterly
investor statements. Investment performance does not include hedging gains/(losses) resulting from the Hedging Program.
4 Includes Fund-level income and expenses; taxes mainly relate to deferred taxes on net appreciation of the Fund
5 FX gains and losses at the underlying portfolio companies are included in FX and represent an impact on the One Year, Three Year, Five Year, Ten Year and Since
Inception returns of 0.4%, 0.0%, 0.0%, 0.0% and 0.0% respectively.
21 | FOR INSTITUTIONAL/WHOLESALE/PROFESSIONAL CLIENTS AND QUALIFIED INVESTORS ONLY – NOT FOR RETAIL USE OR DISTRIBUTION66322ad0-0adf-11ea-885b-da5d243e7eaf - November 19th, 2019
STRICTLY PRIVATE | CONFIDENTIAL
F/X Currency Hedging Program Performance
Oct 1st, 2018 through
AUD EUR GBP JPY USD
Sept 30th, 2019
Net Total Return - Local Currency 8.8% 9.5% 9.4% 8.7% 9.3%
FX Impact2 -4.2% -4.2% -4.2% -4.2% -4.2%
Net Total USD Return - Pre Hedging 4.6% 5.3% 5.3% 4.5% 5.2%
FX Translation to Home Currency3 7.1% 6.4% 6.0% -5.0% 0.0%
Impact of Hedging4 -1.3% -3.3% -1.4% 8.1% 6.2%
Hedging Expense -0.1% -0.1% -0.1% -0.1% -0.1%
Net Home Currency Return - Post Hedging 10.4% 8.3% 9.8% 7.5% 11.2%
As September 30, 2019
Past performance is no guarantee of future results. Returns include the re-investment of income.
Returns represent a composite of the returns of all investors in each particular FIV. Individual returns may vary.
AUD = IIF Australian Trust 1, EUR = IIF UK 1 Hedged LP; GBP = IIF UK 1 Hedged LP, JPY = IIF Canadian 1 Hedged LP; USD = IIF Hedged LP.
1 Returns for periods greater than one quarter are time-weighted rates of return calculated by linking quarterly returns. Returns of greater than one year are annualized.
2 Relates to changes in the exchange rates of the underlying portfolio companies held in local currency terms and the USD, the Fund's reporting currency
3 Relates to the exchange rates of the Fund currency (USD) to an investors home currency
4 Relates to the gains/(losses) on the FX currency forward contracts between the underlying portfolio companies' currency and Investor's home currency.
Please refer to the PPM for important additional risks, disclosures and information.
22 | FOR INSTITUTIONAL/WHOLESALE/PROFESSIONAL CLIENTS AND QUALIFIED INVESTORS ONLY – NOT FOR RETAIL USE OR DISTRIBUTIONd99c5e30-0569-11ea-b259-4eb51feb0b87 - November 12th, 2019
STRICTLY PRIVATE | CONFIDENTIAL
Key Terms & Conditions
Summary of Key Terms & Conditions
Currency Denominated in USD; Unhedged and select currency hedged Fund Vehicles available1
Target Return 8-12% net2
Target Cash Yield 5-7% on NAV2 (Cash distributions)
Sector Focus Distribution/Regulated, GDP-Sensitive & Contracted/Power
Geographic Focus U.S., Canada, Western Europe, and other OECD
Distributions Quarterly. Can be received as cash or reinvested
Semi-annual on best efforts basis with 4-year soft lock
Repurchases Repurchase requests made prior to the fourth anniversary of the final drawdown of an Investor’s
Commitment subject to a 4% repurchase discount
USD 10 million
Minimum Commitment May be waived at investment advisor’s discretion (may be subject to different terms and conditions
including higher fees)
USD10mm tod99c5e30-0569-11ea-b259-4eb51feb0b87 - November 12th, 2019
STRICTLY PRIVATE | CONFIDENTIAL
IIF Optional Currency Hedging Program ─ Summary
In October 2018, IIF established an optional currency hedging program. ~USD 3.0 billion of capital invested in the program as at July 2019
While we believe the Fund’s long-term investment horizon alleviates the impact of currency movements over-time, certain investors have
sought a ‘within the Fund’ currency hedge to reduce short-term currency volatility
Hedged Fund Investor Vehicles (“HFIVs”) are offered as parallel vehicles to certain existing un-hedged FIVs, subject to certain tax,
regulatory and legal considerations where there was a sufficient level of investor interest during the election period (i.e., there is not currently
hedging options for every FIV)
Summary of IIF Currency Hedging Program
HFIVs Currently Available IIF Australian 1 Trust, IIF LP, IIF Canadian 1 LP, IIF Cayman 1 Ltd, IIF UK 1 LP, IIF Luxembourg & IIF ERISA LP
Currencies Offered AUD, CHF, EUR, GBP, JPY, SEK & USD currently
Hedging Strategy Anticipate rolling 3 month forwards; directly hedge portfolio company reporting currencies
Fees JPM does not charge any additional fees for managing the program
Anticipate ongoing operational costs to be 7bps1 p.a. dependent on program scale
Additional interest cost of use of credit facility to cover F/X mark-to-market (“MTM”) (if necessary) will be
Estimated Costs allocated to the applicable Hedging Investors
F/X forward market pricing also results in a benefit or cost. Depends on market conditions and currencies being
hedged and evolves over time as the result of relative interest rates
Settled with use of the Fund’s credit facility and then repaid by Hedging Investors
Fund distributions held back (if necessary) to recover F/X MTM
F/X Settlement
Ability to redeem units or call capital above commitment amount from the hedged investor to cover MTM of the
hedge
Election (Existing Annual election anticipated May 31 for every July 1
Investors) Ability to partially hedge and move into and out of HFIV
Third Party Administrator Chatham Financial
As of June 30, 2019.
1 Assumes program size of USD 3.0bn, costs will be higher if interest is more muted.
Note: Please refer to the PPM for important additional risks, disclosures and information.
24 | FOR INSTITUTIONAL/WHOLESALE/PROFESSIONAL CLIENTS AND QUALIFIED INVESTORS ONLY – NOT FOR RETAIL USE OR DISTRIBUTIONd99c5e30-0569-11ea-b259-4eb51feb0b87 - November 12th, 2019
STRICTLY PRIVATE | CONFIDENTIAL
Key Takeaways
Existing • USD 12.0 billion NAV portfolio
Diversified • 464 assets (19 portfolio companies), 25 countries, 12 subsectors
Portfolio
• No single asset accounting for more than ~ 6.0% of portfolio
• Platform investing, typically focusing on smaller, less competitive opportunities
Differentiated
• Short commitment queue, estimated at 6 - 12 months or less from closing
Strategy
• Enables strong alignment for investor through significant cash invested by the IIG team
Long-Term
Contracted/ • Estimated 64% of the Fund’s portfolio company’s 2019 revenues are contracted/regulated1
Regulated • Visibility to 5-7% p.a. of NAV target cash yield with 8.1% p.a. for trailing 12 months2
Assets
• ESG integrated across all levels of governance and into investment and asset management processes
ESG • Co-largest/controlling owner of 16 of 19 portfolio companies
• Management across the portfolio through a consistent framework
All data as of September 30, 2019. The advisor seeks to achieve the stated objectives. There can be no guarantee the objectives will be met. 1Source: JPMAM, data as of June 30, 2019. Opinions,
estimates, forecasts, and projections are based current market conditions, constitute our judgment and are subject to change without notice. There can be no guarantee they will be met. Past performance is
no guarantee of comparable future results. 2 The target returns and cash yield are for illustrative purposes only and are subject to significant limitations. An investor should not expect to achieve actual
returns or yield similar to the targets shown above. Please see the complete Target Return disclosure at the conclusion of the presentation for more information on the risks and
limitation of target returns.
25 | FOR INSTITUTIONAL/WHOLESALE/PROFESSIONAL CLIENTS AND QUALIFIED INVESTORS ONLY – NOT FOR RETAIL USE OR DISTRIBUTIONSTRICTLY PRIVATE | CONFIDENTIAL Appendix 26 | FOR INSTITUTIONAL/WHOLESALE/PROFESSIONAL CLIENTS AND QUALIFIED INVESTORS ONLY – NOT FOR RETAIL USE OR DISTRIBUTION
d99c5e30-0569-11ea-b259-4eb51feb0b87 - November 12th, 2019
STRICTLY PRIVATE | CONFIDENTIAL
Summary of Current and Proposed New Fee Schedule
IIF’s fee changes are designed to enhance simplification, increase alignment and continue to
provide a competitive offering to our investors
Current Fee Schedule Proposed New Fee Schedule1
d99c5e30-0569-11ea-b259-4eb51feb0b87 - November 12th, 2019
                                                                                                                                                                STRICTLY PRIVATE | CONFIDENTIAL

      A Diversified Long Term Investor Base Built Over More Than a Decade
       IIF has commitments from 574 client accounts across 26 countries

                                     Commitments By Geography                                                                       Commitments by Investor Type
                                                                                                                                                       Endowments,
                                                     Asia ex Japan                                                                                     Foundations
                                                          2%                                                                    Unions/multi-           and Other**
                                            Australia 4%        Other
d99c5e30-0569-11ea-b259-4eb51feb0b87 - November 12th, 2019
STRICTLY PRIVATE | CONFIDENTIAL
Portfolio Company Boards are an Extension of the Infrastructure Investments Group
Sector knowledge, expertise & networks of these board members are critical to the effective
management of portfolio companies and sourcing new strategic platform investments
Distribution/Regulated Board Members (39 Total) Contracted/Power Assets Board Members (14 Total)
Randy Daniels Kathy Alexander Bob Foster Petros Kitsos
SouthWest Water Company, Summit Utilities Southwest Generation Sonnedix Power Holdings
BW Terminals; U.S. U.S. U.S. U.S.
Former New York Secretary of Extensive experience in 40+ yrs in government, 22+ yrs in aerospace, defense
State from 2001-2005 utilities and security sectors energy, and power & diversified industrials
Susan Howard Wendy Barnes Leanne Bell Lindsay Brace-Martinez
Southern Water Services Southern Water Services Ventient Energy, Southwest Novatus Energy
UK UK Generation; U.S. U.S.
Extensive experience in law, Extensive experience in 35+ yrs experience Inv. experience in sustainability,
water and other infrastructure utilities and security sectors investment banking natural resources
Conrado Navarro Karen Plessinger Steen Stavnsbo Mikael Kramer
NorteGas SouthWest Water Company, Sonnedix, Ventient Energy Ventient Energy,
Spain Sonnedix; U.S. UK Värmevärden
25+ yrs of gas distribution and 22+ yrs energy finance and 25+ yrs experience global UK
operational experience private equity experience wind energy industry 30+ yrs energy experience
Sherina Edwards Peter Kind Barry Welch Anne Cleary
SouthWest Water Company SouthWest Water Company Novatus, Southwest Southwest Generation
U.S. U.S. Generation; U.S. U.S.
Extensive experience in Law, 30+ yrs utility and power Former CEO of Atlantic 30+ years experience in the
government and infrastructure investment banking experience Power Corporation electrical utility space
GDP-Sensitive Board Members (24 Total)
Keith Howard Ross Rolfe Chris Ward
Beacon Rail Leasing North Queensland Airports Nieuport Aviation,
UK Australia BW Terminals; U.S.
20+ yrs in rolling stock CEO of Infigen Energy and 30+ years experience, Port
owning companies former CEO of Alinta Energy Authority of NY and NJ
Jane Bird Diane Smith-Gander Henk Rottinghuis
Nieuport Aviation North Queensland Airports Koole Terminals
Canada Australia Netherlands
20+ yrs in infrastructure Former management 30+ yrs experience in the
project management consultant shipping industry
Source: JPMAM, as of January 2019.
29 | FOR INSTITUTIONAL/WHOLESALE/PROFESSIONAL CLIENTS AND QUALIFIED INVESTORS ONLY – NOT FOR RETAIL USE OR DISTRIBUTIONSTRICTLY PRIVATE | CONFIDENTIAL Risk and Disclosures This material is confidential, contains proprietary information of J.P. Morgan Alternative Asset Management, and is for informational purposes only and may not be reproduced, shown or distributed. It is intended solely for the recipient and may not be shared with any third parties without written consent from J.P. Morgan Alternative Asset Management, Inc. This document is a general communication being provided for informational purposes only. It is educational in nature and not designed to be recommendation for any specific investment product, strategy, plan feature or other purposes. By receiving this communication you agree with the intended purpose described above. Any examples used in this material are generic, hypothetical and for illustration purposes only. None of J.P. Morgan Asset Management, its affiliates or representatives is suggesting that the recipient or any other person take a specific course of action or any action at all. Communications such as this are not impartial and are provided in connection with the advertising and marketing of products and services. Prior to making any investment or financial decisions, an investor should seek individualized advice from a personal financial, legal, tax and other professional advisors that take into account all of the particular facts and circumstances of an investor’s own situation. Target Return/Target Volatility: The annual target return/target volatility and other fund objectives have been established by JPMAAM based on its assumptions and calculations using data available to it and in light of current market conditions and available investment opportunities and is subject to the risks set forth herein and set forth more fully in the applicable offering document or investment management agreement. These portfolio objectives are for illustrative purposes only and are subject to significant limitations. An investor should not expect to achieve actual returns/actual volatility similar to the target return/target volatility shown herein. Because of the inherent limitations of the target returns,/target volatility potential investors should not rely on them when making a decision on whether to invest in the portfolio. These objectives cannot account for the impact of economic, market, and other factors may have on the implementation of an actual investment program. Unlike actual results, the target return/target volatility and other fund objectives do not reflect actual trading, liquidity constraints, and other factors that could impact the future returns of the portfolio. JPMAAM’s ability to achieve the target return/target volatility and fund objectives is subject to risk factors over which JPMAAM may have no or limited control. There can be no assurance that the portfolio will achieve its investment objective, the target return/target volatility, or any other portfolio objectives. The actual results achieved may be more or less than the target return/target volatility shown herein. Investing in infrastructure assets or debt associated with infrastructure involve a variety of risks, not all of which can be foreseen or quantified, and which include, among others: the burdens of ownership of infrastructure; local, national and international economic conditions; the supply and demand for services from and access to infrastructure; the financial condition of users and suppliers of infrastructure assets; risks related to construction, regulatory requirements, labor actions, health and safety matters, government contracts, operating and technical needs, capital expenditures, demand and user conflicts, bypass attempts, strategic assets, changes in interest rates and the availability of funds which may render the purchase, sale or refinancing of infrastructure assets difficult or impracticable; changes in environmental laws and regulations, investments in other funds, troubled infrastructure assets and planning laws and other governmental rules; changes in energy prices; negative developments in the economy that may depress travel activity; force majeure acts, terrorist events, under-insured or uninsurable losses; and other factors which are beyond the reasonable control of the Fund or the Investment Adviser. Many of these factors could cause fluctuations in usage, expenses and revenues, causing the value of the Investments to decline and negatively affecting the Fund’s returns. Currency hedging and other speculative investment practices may increase investment loss. Currency transactions involve the leveraged trading of contracts denominated in foreign currency conducted with a futures commission merchant or a retail foreign exchange dealer as your counterparty. Because of the leverage, rapidly loss of some or all of the funds deposited for such trading and may lose more than deposited. The UN PRI assessment methodology (10 assessed modules) and assessment report together aim to achieve three objectives set by the PRI Advisory Council (Facilitate learning and development; Identify areas for further improvement; and Facilitate dialogue between asset owners and investment managers) on responsible investment activities and capabilities. JPMAM Direct Infrastructure asset class was ranked with a number of firms in the United Nations Principal for Responsible Investment, which JPM is a signature. The 2018 JPMAM assessment Report is available upon request. Risks Associated with Investing in the Strategy: Please consult the Memorandum for other key risk factors associated with investments in the Fund. NOT FOR RETAIL DISTRIBUTION: This communication has been prepared exclusively for institutional, wholesale, professional clients and qualified investors only, as defined by local laws and regulations. This is a promotional document and is intended to report solely on investment strategies and opportunities identified by J.P. Morgan Asset Management and as such the views contained herein are not to be taken as advice or a recommendation to buy or sell any investment or interest thereto. This document is confidential and intended only for the person or entity to which it has been provided. Reliance upon information in this material is at the sole discretion of the reader. The material was prepared without regard to specific objectives, financial situation or needs of any particular receiver. Any research in this document has been obtained and may have been acted upon by J.P. Morgan Asset Management for its own purpose. The results of such research are being made available as additional information and do not necessarily reflect the views of J.P. Morgan Asset Management. This presentation is qualified in its entirety by the offering memorandum, which should be carefully read prior to any investment in a fund. The purchase of shares of a fund is suitable only for sophisticated investors for whom an investment in such fund does not constitute a complete investment program and who fully understand and are willing to assume the risks involved in such fund’s investment program. An investment in the funds involves a number of risks. For a description of the risk factors associated with an investment in a fund, please refer to the section discussing risk factors in the offering memorandum (available upon request). Shares of the funds are not deposits, obligations of, or endorsed or guaranteed by, JPMorgan Chase Bank, NA or any other bank and are not insured by the FDIC, the Federal Reserve Board or any other government agency. 30 | FOR INSTITUTIONAL/WHOLESALE/PROFESSIONAL CLIENTS AND QUALIFIED INVESTORS ONLY – NOT FOR RETAIL USE OR DISTRIBUTION
STRICTLY PRIVATE | CONFIDENTIAL

Risk and Disclosures (cont’d)
Any forecasts, figures, opinions, statements of financial market trends or investment techniques and strategies expressed are those of J.P. Morgan Asset Management, unless otherwise stated, as of the
date of issuance. They are considered to be reliable at the time of production, but no warranty as to the accuracy and reliability or completeness in respect of any error or omission is accepted, and may be
subject to change without reference or notification to you. Investments in Alternative Investment Funds (AIFs) involves a high degree of risks, including the possible loss of the original amount invested. The
value of investments and the income from them may fluctuate in accordance with market conditions and taxation agreements. Changes in exchange rates may have an adverse effect on the value, price or
income of the products or underlying investment. Both past performance and yields are not reliable indicators of current and future results. There is no guarantee that any forecast will come to pass. Any
investment decision should be based solely on the basis of any applicable local offering documents such as the prospectus, annual report, semi-annual report, private placement or offering memorandum.
For further information, any questions and for copies of the offering material you can contact your usual J.P. Morgan Asset Management representative. Any reproduction, retransmission, dissemination or
other unauthorized use of this document or the information contained herein by any person or entity without the express prior written consent of J.P. Morgan Asset Management is strictly prohibited.

In the United Kingdom, the Funds are categorized as a Non-Mainstream Pooled Investment as defined by the Financial Conduct Authority (FCA). The Funds are not available to the general public and may
only be promoted in the UK to limited categories of persons pursuant to the exemption to Section 238 of the Financial Services and Markets Act 2000 (FSMA 2000). This information is only directed to
persons believed by JPMorgan Asset Management (UK) Limited to be an eligible counterparty or a professional client as defined by the FCA. Persons who do not have professional experience in matters
relating to investments should not rely on it and any other person should not act on such information.

Investors should note that there is no right to cancel an agreement to purchase shares under the Rules of the Financial Conduct Authority, the normal protections provided by the UK regulatory system do
not apply and compensation under the Financial Services Compensation Scheme is not available. J.P. Morgan Asset Management or any of its affiliates and employees may hold positions or act as a
market maker in the financial instruments of any issuer discussed herein or act as the underwriter, placement agent or lender to such issuer. The investments and strategies discussed herein may not be
suitable for all investors and may not be authorized or its offering may be restricted in your jurisdiction, it is the responsibility of every reader to satisfy himself as to the full observance of the laws and
regulations of the relevant jurisdictions. Prior to any application investors are advised to take all necessary legal, regulatory and tax advice on the consequences of an investment in the products.

Securities products, if presented in the U.S., are offered by J.P. Morgan Institutional Investments, Inc., member of FINRA.

J.P. Morgan Asset Management is the brand for the asset management business of JPMorgan Chase & Co. and its affiliates worldwide.

To the extent permitted by applicable law, we may record telephone calls and monitor electronic communications to comply with our legal and regulatory obligations and internal policies. Personal data will
be collected, stored and processed by J.P. Morgan Asset Management in accordance with our Company’s Privacy Policy (https://www.jpmorgan.com/global/privacy). For further information regarding our
local privacy policies, please follow the respective links: Australia (https://www.jpmorgan.com/country/AU/EN/privacy), EMEA (https://am.jpmorgan.com/us/en/asset-management/gim/mod/legal/external-
privacy-policy), Japan (https://www.jpmorganasset.co.jp/wps/portal/Policy/Privacy), Hong Kong (https://am.jpmorgan.com/hk/en/asset-management/per/privacy-statement/), Singapore
(http://www.jpmorganam.com.sg/privacy) and Taiwan (https://www.jpmrich.com.tw/wps/portal/Footer/Privacy).

This communication is issued by the following entities: in the United Kingdom by JPMorgan Asset Management (UK) Limited, which is authorized and regulated by the Financial Conduct Authority; in other
European jurisdictions by JPMorgan Asset Management (Europe) S.à r.l.; in Hong Kong by JPMorgan Asset Management (Asia Pacific) Limited, or JPMorgan Funds (Asia) Limited, or JPMorgan Asset
Management Real Assets (Asia) Limited; in Singapore by JPMorgan Asset Management (Singapore) Limited (Co. Reg. No. 197601586K), or JPMorgan Asset Management Real Assets (Singapore) Pte Ltd
(Co. Reg. No. 201120355E), this advertisement or publication has not been reviewed by the Monetary Authority of Singapore; in Taiwan by JPMorgan Asset Management (Taiwan) Limited; in Japan by
JPMorgan Asset Management (Japan) Limited which is a member of the Investment Trusts Association, Japan, the Japan Investment Advisers Association, Type II Financial Instruments Firms Association
and the Japan Securities Dealers Association and is regulated by the Financial Services Agency (registration number “Kanto Local Finance Bureau (Financial Instruments Firm) No. 330”); in Australia to
wholesale clients only as defined in section 761A and 761G of the Corporations Act 2001 (Cth) by JPMorgan Asset Management (Australia) Limited (ABN 55143832080) (AFSL 376919); in Brazil by Banco
J.P. Morgan S.A.; in Canada for institutional clients’ use only by JPMorgan Asset Management (Canada) Inc., and in the United States by J.P. Morgan Institutional Investments, Inc., member of FINRA; J.P.
Morgan Investment Management, Inc. or J.P. Morgan Alternative Asset Management, Inc.

In Switzerland, JPMorgan Asset Management (Switzerland) LLC, Dreikönigstrasse 37, 8002 Zurich, acts as Swiss representative of the funds and J.P. Morgan (Suisse) SA, 8 Rue de la Confédération, 1204
Geneva, as paying agent of the funds. JPMorgan Asset Management (Switzerland) LLC herewith informs investors that with respect to its distribution activities in and from Switzerland it receives
commissions pursuant to Art. 34 para. 2bis of the Swiss Collective Investment Schemes Ordinance dated 22 November 2006. These commissions are paid out of the management fee as defined in the fund
documentation. Further information regarding these commissions, including their calculation method, may be obtained upon written request from JPMorgan Asset Management (Switzerland) LLC.

Copyright 2019 JPMorgan Chase & Co. All rights reserved.

31 | FOR INSTITUTIONAL/WHOLESALE/PROFESSIONAL CLIENTS AND QUALIFIED INVESTORS ONLY – NOT FOR RETAIL USE OR DISTRIBUTION
You can also read