In the Recovery Room: How the Houston and Texas Energy & Economic Revival will Fare - CES Friday Webinar Series, June 19, 2020 - Rice ...
←
→
Page content transcription
If your browser does not render page correctly, please read the page content below

In the Recovery Room:
How the Houston and Texas Energy & Economic Revival will Fare

            CES Friday Webinar Series, June 19, 2020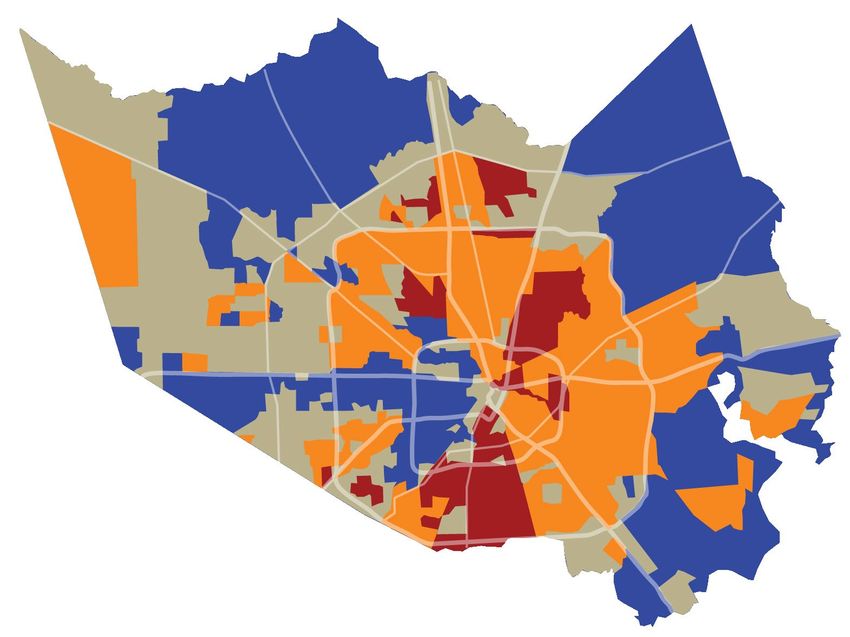
Welcome
Our regular CES Friday webinar with:
• Bill Gilmer
• Brett Perlman
• Steve Klineberg

©M.M. Foss, CES/BIPP                   2
The Constant
 Gardener –
 Looking for
Green Shoots

©M.M. Foss, CES/BIPP   3
Silver linings playbook?

©M.M. Foss, CES/BIPP                              4
Houston’s Economy in the
Wake of COVID-19 and the Oil Bust
          Robert W. Gilmer, Ph.D.
      C.T. Bauer College of Business
              June 19, 2020
Economic Effects of the Virus:
           What We Don’t Know Right Now
• The virus is in charge. We don’t know the case infection rate, case fatality rate, if
  re-infection is possible, herd immunity is possible, or when there might be
  effective treatment or vaccine. When do economic impacts end?
• Public health officials follow behind the virus and create their own uncertainty
  with timing and extent of public orders, especially sweeping mandates like stay-
  home orders and widespread business closings
• Along with mandatory social distancing we have trouble understanding or
  gauging the on-going economic cost of reactive social distancing by the public, in
  stores, restaurants, hotels, travel, or personal services. This continues at an
  unknown level after stay-home orders are lifted
• The shock of the virus/public orders creates huge structural breaks in the
  economic data. Supply and demand for oil, labor, basic foodstuffs, are suddenly
  and wildly out of balance. Economic models don’t work any longer until balance
  is restored
Economic Impacts of A Pandemic
       Pandemic Before 2010                            COVID-19 Pandemic
• Starts with immediate reactive social       • With use of stay-home orders and business
  distancing, fewer customers in bars,          closings economic impacts all come at once:
  restaurants, stores, etc.                     widespread business shutdown, a huge shock
                                                and uncertainty, millions immediately lose
• Over 6- to 8-month period, the disease        their jobs
  spreads through the workplace, millions     • Of course, millions don’t fall ill now and
  lose jobs, worker shortages are acute,        fatality rate is lower. Also, many of the job
  plants are closed, supply chain disrupted     losses under stay-home orders would have
• Business and consumer uncertainty slows       happened anyway as illness spread without
  spending                                      orders
• Herd immunity or vaccine finally slows      • A play for time? Epidemiology studies show
                                                you can lower the peak mortality (flatten he
  the virus                                     curve and prevent hospitals/essential services
• At different places and times, local          from being overrun) but cumulative
  ordinances used to slow virus                 mortalities are not reduced nearly as much
New Initial Unemployment Claims Show Economic
                         Shock in Texas vs. Houston
            300                                               80               • The initial claims data for the
                                                                                 U.S., Texas, and Houston are
Thousands

                                                                   Thousands
                                                              70
            250                         virtually identical in their timing
                                                              60                 and extent of losses
            200
                                                              50               • The shock is not the spread of
                                                                                 the virus but the preemptive
            150                                               40
                                                                                 stay-home orders and essential
            100
                                                              30                 business closings
                                                              20               • Jobs losses are mostly a
            50                                                                   combination of mandatory and
                                                              10                 reactive social distancing – plus
             0                                                0                  the shock to businesses and
            2020-03-07    2020-04-07   2020-05-07                                households as they cut spending
                          TX Initial    Hou Initial
March/April Payroll Job Losses
                  in Houston By Sector
                                          (Seas. Adj.)
Upstream Oil                    -12,300            Selected Services     -225,300
  Producers                      -2,400             Accommodation         -10,200
  Services                       -5,500             Air Transportation     -3,600
  Fabricated Metal               -1,600             Entertainment         -17,500
  Machinery                      -3,200             Food/Drink           -103,000
Prof/Bus Services               -25,200             Health Care           -45,200
  Employment Services           -14,200             Other Services        -19,300
  Headquarters                   -3,200             Private Education      -3,900
  Prof/Technical                 -6,600             Retail                -22,600
  Building Services              -1,600            Other Sector Losses    -34,200
Construction                    -28,900
  Buildings                      -4,300            Total Losses          -325,900
  Heavy                          -5,200
  Trades                        -19,600            Economic Base Jobs    -39,600
Finance                          -5,300              Oil Base            -16,100
Other Manufacturing              -4,200              Not Oil             -29,100

May not add to totals due to seasonal adjustment
What Public Health Orders Take Away in Jobs,
       the Treasury Puts Back As Income Payments
  Monthly Change In Personal Income
            ($ Billion s.a.)                       • Treasury stimulus is now $2.9 trillion,
                       March   April March/April
                                                     with $1.3 trillion for protecting jobs,
Personal Income        -34.5   163.8   129.3
                                                     direct payments to individuals, or
 Employee
                                                     supplementing unemployment
Compensation           -31.2   -73.2    -104.4
                                                     payments
  Wages and Salaries   -27.7   -61.7    -89.4
                                                   • $1.3 trillion would pay $33,900 to 33
                                                     million Americans, or 80% of the
  Proprietors Income   -12.4   -16.5    -28.8        average annual U.S. wages and salaries
Gov't Transfers         5.9    249.9    255.8
 Unemployment           3.7     30.0    33.7
                                                   • Plus Federal Reserve stimulus with zero
 Economic Impact        0.1    215.7    215.8
                                                     interest rates and return of 2008-09
                                                     credit facilities, plus new programs for
Disposable Income      -29.1   177.3    148.2
                                                     corporations, states and localities, and
                                                     small business
 Personal Outlays      -88.8   -159.5   -248.3
Personal savings        59.7   336.8    396.5
For Houston, Oil and Gas Turn a Typical
Downturn Into a Serious Decline
• Additional little problem of oil and gas in Houston: An ongoing soap opera
with a credit crunch last summer became an oil war between Russia and
the Saudi’s early this year, that turned into a virus-driven collapse this
spring
• With global stay-home orders, the demand for oil fell from 100 mmb/d to
maybe 85 million. All parties are on board to clean up the mess – U.S.,
Russia, Saudi Arabia, OPEC
• Three stages of recovery: (1) Get supply and demand back into balance and
find the market-clearing price again; (2) once we find the fundamentals,
they will be ugly with oil price at $45 through much of 2021; (3) oil price
improves to $60 or better only as U.S. and global economy recover in late
2021 or early 2022Oil and Houston? • Oil-related jobs = Producers, Services, Machinery, and Fabricated Metals • Around 31,000 local oil-related jobs will be lost to this downturn by early 2021. What happens between now and early 2021 with supply/demand out of whack is anyone’s guess, with the rig count in freefall and oil services in retreat. But yes, briefly much bigger • Why not more oil jobs lost? Lots of the house-cleaning has already been done and there is little fat left in the system. We lost 72,000 jobs to the speculative fracking bust of 2015-16 and restored only 21,000 by the middle of 2019 – when job losses began again. The rig count fell 25 percent pre-COVID • Is there a place for fracking post-Covid-19? Yes, if there is a place for $60 oil and a return to 100 mmb/d of oil demand
Outlook for Houston
• Suppose the virus has largely come under control by early- to mid-2021 –
  maybe herd immunity, treatment, or vaccine?
• That puts aside all the crazy numbers of jobs swinging back and forth in
  response to enforced public orders and social distancing through this year.
  With a return to economic fundamentals for markets, we will probably be
  coming out of a significant recession in 2021Q2 that will find us 100,000
  jobs below the prior peak in payroll employment in 2020Q1
• The deeper the recession, the faster the bounce back. We see job growth
  turn strong in mid-2021, the growth far above trend at 80,000 to 90,000
  jobs in 2022 as the U.S. economy comes back, then even faster in 2023 and
  oil makes a return in Houston. The local employment returns to trend
  growth rates again
In the Recovery Room: Houston’s
Economic Recovery from the Pandemic
          and the Oil Shock

                      June 2020
Today’s Discussion
• Changing Role of the Energy Industry in Houston’s
Economy
• Economic Recovery from the Pandemic and the Oil Price
Collapse
− In Houston’s Economy
− In the Energy Industry
• Long term Impacts of the Energy Transition on Houston’s
Economy
2For many decades through the 2014 oil price collapse,
the Houston area enjoyed advantaged economic growth
vs. peer cities and the overall US economy
42,000
Per Capita Net Earnings ($USD), Inflation Adjusted
39,000
36,000
33,000
30,000
27,000
24,000
Houston
US
21,000 MSA
0
1968
1970
1972
1974
1976
1978
1980
1982
1984
1986
1988
1990
1992
1994
1996
1998
2000
2002
2004
2006
2008
2010
2012
2014
2016
Net Earnings: Earnings less housing and taxes
Note(s): Per Capita Net Earnings adjusted using US Bureau of Labor Statistics Inflation Calculator
Source(s): US Bureau of Economic Analysis
3Upstream oil and gas has been the primary
catalyst for Houston’s growth advantage
Houston Metropolitan Statistical Area (MSA) and US per capita net earnings drivers
35% 35% 30%
Upstream Oil & Infrastructure &
US Economic Growth
Gas Industry Growth Pro-growth Enablers
― Houston economy tracks overall ― Primary generator of ― Low housing cost, pro growth
US economy high multiplier jobs policies, low taxes
― Immigration across socio-
economic groups
The multiplier effect:
― Economic impacts vary by job type
― Job functions requiring driving inputs from manufacturing, services, construction etc. have higher economic
impact
Source(s): Dr. Bill Gilmer from the U of H Institute for Regional Forecasting (model back-tested to 1996)
4Today’s Discussion
• Changing Role of the Energy Industry in Houston’s Economy
• Economic Recovery from the Pandemic and the Oil Price
Collapse
− In Houston’s Economy
− In the Energy Industry
• Long term Impacts of the Energy Transition on Houston’s
Economy
5Shape and Timing of the Recovery? V U
Impact of 6 Recessions on Houston’s Economy
                                    Oil Prices                  Rigs Lost                  Energy jobs lost                 Total jobs lost
Period     Cause
                                Peak        Trough             #            %               #               %                #                %

1982-
          Oil Price Bust       30.75         12.05        -3,766         83.3          -53,600           -46.3         -221,100           -13.2
1987

1990-     Interest Rate
                               35.89         14.57          -526         46.3          -13,900            -7.2          -18,400            -1.0
1991      Spike

2001-
          Enron/911            34.55         19.53          -528         41.3          -13,300            -6.9          -32,900            -1.4
2003

2008-     Great
                              136.96         39.51        -1,119         44.4          -11,900           -13.6         -120,500            -4.5
2009      Recession

2015-
          Fracking Bust       106.31         30.32        -1,527         79.1          -92,400           -30.7          -13,700            -0.5
2016

2019-?    New Reality          70.98         12.00          -804         74.2          -20,900           -25.7        330,100*            -10.3

Note: All losses calculated from the monthly average
Sources: U.S. Energy Information Administration, Baker Hughes, U.S. Bureau of Labor Statistics
* Represents May 2020 Peak; June TWC report shows Houston added back 73,800 jobs, Employment remains 276,400 below Feb. level of 3.2 MM

                                                                                                                                          7
How long to recover 276,000 jobs? Period Jobs Created Suggested Recovery Long-Term Annual Average 66,300 4 year, 1 month Long-Term Monthly Average 4,100 5 years, 7 months Annual Average, Ten Best Years 103,800 2 years, 7 months
Today’s Discussion

• Changing Role of the Energy Industry in Houston’s Economy
• Economic Recovery from the Pandemic and the Oil Price
  Collapse
   − In Houston’s Economy
   − In the Energy Industry
• Long term Impacts of the Energy Transition on Houston’s
  Economy

                                                            9
Houston Region Energy Employment
310
290
270
250
230
210
190
170
150
Source: Greater Houston Partnership analysis of Texas Workforce Commission CES data
1011
12
Significant Decline in Market Expectation of
Future Oil Prices

Source: Haynes & Boone LLP, “Energy Bank Price Deck Survey”, April 1, 2020

                                                                             13
Today’s Discussion
• Changing Role of the Energy Industry in Houston’s Economy
• Economic Recovery from the Pandemic and the Oil Price
Collapse
− In Houston’s Economy
− In the Energy Industry
• Long term Impacts of the Energy Transition on Houston’s
Economy
14Range of Potential Global Oil Demand
Factors influencing long
Recent term oil demand
scenarios
developed by • Return to air travel
others range • Faster decarbonization
from ~80-120
• Less mass transit
mmbpd
• High electric vehicle
penetration
• More telecommuting
• Slower economic growth
Source: ConocoPhillips, “Oil & Natural Gas in the Energy Transition”, Feb. 19, 2020
15KPMG’s Modeling for the Center Identified a Range of Options for
Houston’s Future
Modeling Approach: diversification and job growth cases
High cycle oil
price rebound
Market: Oil and ‘Lower for
gas price longer’
scenario
Key – high quality job outlook
Likely to achieve 2014
peak
‘Lower forever’ Potential to achieve
scenario 2014 peak
Unlikely to achieve
2014 peak
No economic e.g., New energy or
diversification Digitization of other option
traditional oil
Leadership Action:
Extent of economic
diversification
16The scenario modeling considered a combination of oil & gas
sector employment growth and diversification across selected
sectors Scenario Outline
Peer city annual growth rate: 2.1%
Back to the future Back to the future: Cyclical oil price
rebound reestablishes Houston’s
Historical O&G economic growth to match rate of peer
growth 2.08% annual
cities(a)
growth
High risk: Low oil price coupled with lack
Maintaining Return to
of diversification maintains current
current growth outperformance economic deterioration(b)
Upstream ‘Lower for
Oil & Gas
longer’ 1.97% annual 2.20% annual
employment
growth growth Maintaining current growth: Selective
diversification plus modest oil and gas
expansion maintains Houston MSA
High risk growth, but does not match peer city
levels(c)
‘Lower forever’ 1.62% annual
growth
Return to outperformance: Thoughtful
diversification plus modest oil and gas
Limited Selective Significant expansion achieves Houston’s
outperformance(c)
Degree of diversification
Note: (a) Employment CAGRs are based on Houston MSA historical data from 1990 – 2014. O&G sector employment CAGR is 2.77%, All other Houston MSA employment CAGR is 2.03%; (b) High risk scenario
includes 2.03% CAGR across non O&G employment - no incremental growth across chosen diversification sectors and no growth in the O&G sector is included; (c) Incremental growth across each chosen
diversification sector is determined by analyzing how much faster the sector is currently growing over the overall employment CAGR of 2.03%. ‘Lower for longer’ O&G sector growth is approximately 1.3% (matches
1990 – 2014 CAGR). ‘Significant’ diversification includes sectors from the ‘selective’ category.
Source(s): US Bureau of Labor Statistics, IMPLAN, KPMG
17Prophetic City: Houston on the
Cusp of a Changing America
In the Recovery Room: The Impact of
Houston’s Demographic Transformations
Dr. Stephen L. Klineberg Center for Energy Studies Webinar:
slk@rice.edu June 19, 2020.The number of documented U.S. immigrants,
by decade (1820-2010)
12
10.5
10
Between 1492 and 1965, 82% of
all the immigrants who came to 8.8
American shores came from Europe.
8
MILLIONS OF IMMIGRANTS
After reform of the restrictive laws in
1965, 88% of all the new immigrants
have been non-Europeans.
1965
6 “Hart-Celler
Act”
4
2
1924
“National Origins
0.1 Quota Act”
0.5
0
1820s 1830s 1840s 1850s 1860s 1870s 1880s 1890s 1900s 1910s 1920s 1930s 1940s 1950s 1960s 1970s 1980s 1990s 2000s
Source: U.S. Department of Homeland Security. Office of Immigration Statistics.
© Dr. Stephen L. Klineberg and the Kinder Institute for Urban Research.Cities with the largest numbers of foreign-born
residents (2010-2014)
Boston
San Francisco
Chicago New York City
Washington D.C.
Los Angeles Dallas
San Diego Atlanta
Miami
Houston
Source: ACS 2010-2014 Five-Year Estimates. U.S. Census Bureau
© Dr. Stephen L. Klineberg and the Kinder Institute for Urban ResearchDemographic changes in Harris County by decade
(1960-2010) and the ACS estimates for 2012-2016
4.5
Non-Hispanic Whites Blacks Hispanics Asians/Others
8
4.0
8
3.5
Percent of total population 7
42
3.0 4
41
POPULATION IN MILLIONS
40
2.5 2
23
16
2.0
.08 19
20 19 18
10 18
1.5 .03
6 20
1.0 20
63 54 42 33 31
0.5 74 69
0.0
1960 1970 1980 1990 2000 2010 2012-2016
(1,243,158) (1,741,912) (2,409,547) (2,818,199) (3,400,578) (4,092,459) (4,434,257)
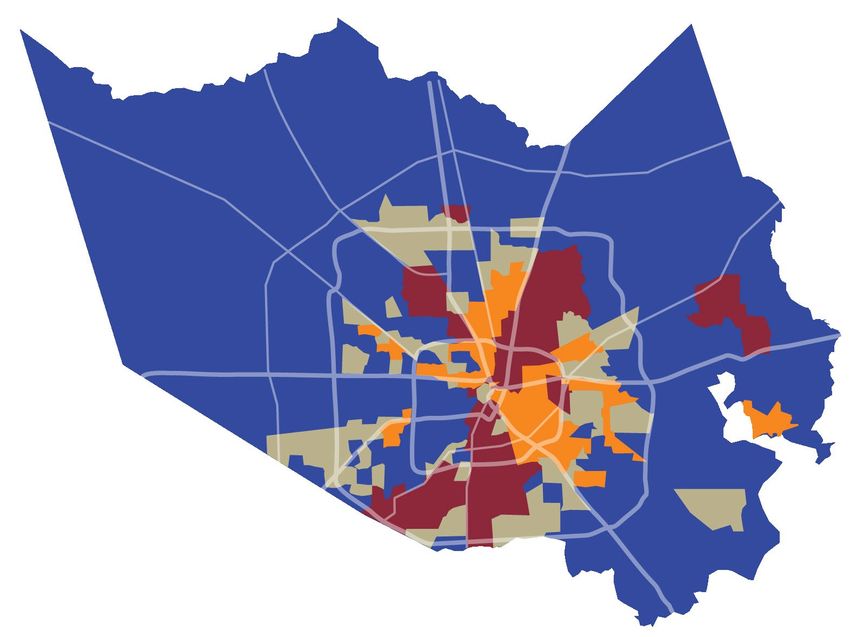
Source: U.S. Census. Classifications based on Texas State Data Center ConventionsThe ethnic distribution across Harris County
Anglo majority
Black majority
Latino majority
No majority
1980
Source: Outreach Strategists, LLC. Color represents demographic group being a majority in that
census tract. © Dr. Stephen L. Klineberg and the Kinder Institute for Urban ResearchThe ethnic distribution across Harris County
Anglo majority
Black majority
Latino majority
No majority
1990
Source: Outreach Strategists, LLC. Color represents demographic group being a majority in that census tract.
© Dr. Stephen L. Klineberg and the Kinder Institute for Urban ResearchThe ethnic distribution across Harris County
Anglo majority
Black majority
Latino majority
No majority
2000
Source: Outreach Strategists, LLC. Color represents demographic group being a majority in that
census tract. © Dr. Stephen L. Klineberg and the Kinder Institute for Urban ResearchThe ethnic distribution across Harris County
Anglo majority
Black majority
Latino majority
No majority
2010
Source: Outreach Strategists, LLC. Color represents demographic group being a majority in that
census tract. © Dr. Stephen L. Klineberg and the Kinder Institute for Urban ResearchThe demographics of the eight most diverse large
metro areas in America (ACS, 2013-2017)
Anglos Blacks Hispanics Asians/Others
100
4
9 8 9 8
13 14
19
11
22
28 15
75 24 44
37
33
17
45 25
PERCENT OF POPULATION
16 15
50
17
20
6
25 53
47 48 46 48
37
30 32
0
Houston New York Los Angeles Chicago Dallas Wash. D. C. Miami Atlanta
(6,636,208) (20,192,042) (13,261,538) (9,549,229) (7,104,415) (6,090,196) (6,019,790) (5,700,990)
Source: U.S. Census, American Community Survey (2013-2017)The current population of Harris County by age
group and ethnicity (ACS, 2013-2017)
Non-Hispanic Whites All Others
78 79 79 78 77
72 72 72
65
55 56
51 49
45 44
35
28 28 28
22 21 22 23
21
Source: American Community Survey (2013-2017)The current population of the United States by
age group and ethnicity (ACS, 2013-2017)
79
Non-Hispanic Whites All Others 76
72
65
56 57 58
54 55
52
50 50 50 50
48 46 45 44 43 42
35
28
24
21
Source: American Community Survey (2013-2017)The projected population of U.S. by age group and
ethnicity in 2050, assuming no change in immigration
Non-Hispanic Whites All others
64 64
62 61
59 58 57 56 56
54 53
50 50
46 47
43 44 44
41 42
38 39
36 36
Source: U.S. Census Bureau. 2012 National Population Projections, Alternative Net International Migration
Series (Constant Series). © Dr. Stephen L. Klineberg and the Kinder Institute for Urban Research.For further information: To download the 2020 report: To purchase the new book: kinder.rice.edu/ simonandschuster.com houstonsurvey2020 /books/Prophetic-City
kinder.rice.edu
                                    /InstituteForUrbanResearch
www.d a ta hous ton.org /kha s
            kind e r@ric e .e d u
                713-348-4132        @RiceKinderInst
You can also read