Identifying social media user demographics and topic diversity with computational social science: a case study of a major international policy forum
←
→
Page content transcription
If your browser does not render page correctly, please read the page content below
Journal of Computational Social Science (2020) 3:167–188
https://doi.org/10.1007/s42001-019-00061-9

    RESEARCH ARTICLE

Identifying social media user demographics and topic
diversity with computational social science: a case study
of a major international policy forum

John Brandt1 · Kathleen Buckingham1 · Cody Buntain2 · Will Anderson1 ·
Sabin Ray1 · John‑Rob Pool1 · Natasha Ferrari1

Received: 19 June 2019 / Accepted: 26 December 2019 / Published online: 7 January 2020
© The Author(s) 2020, corrected publication 2020

Abstract
When the world’s countries agreed on the 2030 Agenda for Sustainable Develop-
ment, they recognized that equity and inclusion should be at the center of imple-
menting the 17 Sustainable Development Goals (SDGs). SDG 15, which calls for
protecting, restoring, and promoting the sustainable use of terrestrial ecosystems,
has spurred commitments to restore 350 million hectares of land by 2030. These
commitments, primarily made in a top-down manner at the international scale, must
be implemented by actively engaging individual landholders and local communities.
Ensuring that diverse and marginalized audiences are engaged in the land restoration
movement is critical to equitably distributing the economic benefits of restoration.
This publication uses social network analysis and machine learning to understand
how important the voices of Africans, women, and young people are in governing
restoration in Africa. We analyze location- and machine learning-identified demo-
graphics from Twitter data collected during the Global Landscapes Forum (GLF),
which is the world’s largest platform for promoting sustainable land use practices.
Our results suggest that convening the GLF in Nairobi, Kenya elevated the voices
of African leaders in comparison to the previous GLF in Bonn, Germany. We also
found significant demographic differences in topic-level engagement between dif-
ferent ages, races, and genders. The primary contributions of this paper are a novel
methodology for quantifying demographic differences in social media engagement
and the application of social media and social network analysis to provide critical
insights into the inclusivity of a large political conference aimed at engaging youth
and African voices.

Keywords Text mining · Social media analysis · Demographic analysis · Network

* John Brandt
  john.brandt@wri.org
1
      World Resources Institute, 10 G St NE #800, Washington DC 20002, USA
2
      University of Maryland, College Park, College Park, MD 20742, USA

                                                                                            13
                                                                                     Vol.:(0123456789)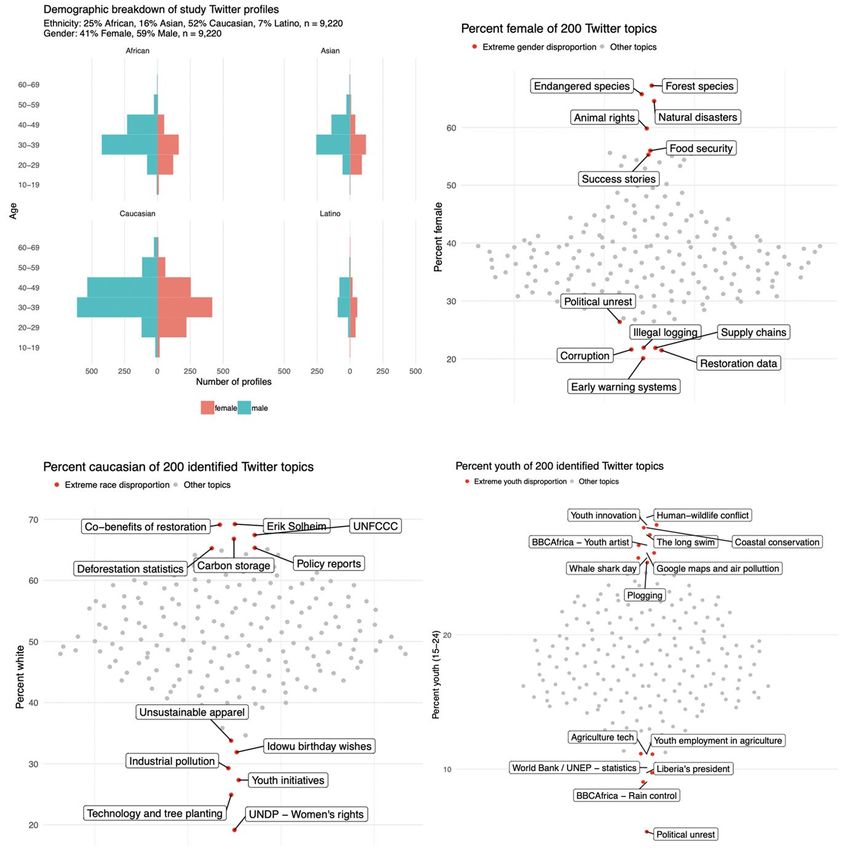
168                                    Journal of Computational Social Science (2020) 3:167–188

Introduction

Twenty-eight African countries have committed to begin restoring 113 million
hectares of degraded land by 2030. These commitments, made to the global
Bonn Challenge and the Africa-led African Forest Landscape Restoration Initia-
tive (AFR100), have captured global interest. Events like the Global Landscapes
Forum (GLF) bring together policymakers, implementers, and others working to
manage land sustainably. In August 2018, the GLF hosted its first Africa-based
conference in Nairobi, Kenya to “[bring] together actors from all backgrounds
and sectors [and] spark a global conversation around Africa’s landscapes” [1].
This regional conference, “Landscape Restoration in Africa: Prospects and
Opportunities,” aimed to highlight African leadership in the global restoration
movement, which historically has largely been led by Western non-governmental
organizations and the United Nations. The need to promote the voices of diverse
audiences in sustainable development planning and implementation has recently
received attention [2, 3]. However, quantitatively measuring the success of these
initiatives is difficult. Relying on mechanical sensors that detect face-to-face
interactions, previous work has demonstrated significant degrees of homophily
at academic conferences, suggesting that these types of events may not be the
best way to engage diverse audiences [4]. By focusing attention on social media
as a proxy, this paper establishes a quantitative method using online discussions
to measure the engagement of targeted demographic groups during an event of
major environmental importance.

Africa’s restoration movement

Across the continent of Africa, about 300 million people living in drylands
depend on the land for income and sustenance. By 2030, this number is expected
to increase to 540 million. At the same time, climate change could result in the
expansion of Africa’s drylands by as much as 20% [5], as land temperature rises
more quickly than the global average [6]. Landscape restoration, the process
of returning vitality to a degraded landscape, provides a unique opportunity to
mitigate the effects of land degradation, while also improving the economy and
human well-being. In recent years, restoration has gained prominence in the inter-
national environmental agenda. The United Nations General Assembly launched
the UN Decade on Ecosystem Restoration from 2021 to 2030, aiming to create
new opportunities for job creation, food security and climate change adaptation
on previously degraded land. Global platforms such as the United Nations’ Sus-
tainable Development Goals, the Aichi Biodiversity Targets [7], as well as goal-
based targets, like the New York Declaration on Forests and the Bonn Challenge
have continued to put restoration at the center stage of international and multilat-
eral agreements [8].

13
Journal of Computational Social Science (2020) 3:167–188                            169

Communication channels in Africa

African communication networks have grown with the population and with devel-
opment. With over 200 million people between the ages of 15 and 24, Africa has
the youngest population in the world [9]. Young Africans have grown up in the
digital era and are creating the fastest-growing mobile phone market in the world.
Over 40% of Africans own a mobile phone, and 725 million are projected to have
a smartphone by 2020 [10]. While mobile phones serve as the primary platform
for Internet access, only 37.3% percent of the population is online [11].
   Kenya, which hosted the GLF’s African event, has one of the Africa’s most devel-
oped telecommunications and media networks, but its citizens act like most African
Internet users by going online through their phones. Eighty-six percent of Kenya’s
50 million residents use the Internet, of which 79% access the Internet through
mobile devices [10]. Kenyan president Uhuru Kenyatta maintains active Facebook
and Twitter accounts, and his supporters say his modern communication tactics are
“demystifying the presidency” [12]. In Kenya, voters under the age of 35 made up
51% of the entire electorate in the 2017, and the number of voters in the 26–35 age
group has more than doubled since 2013. The rate of digital growth in Africa is
staggering. In 2017, over 191 million Africans used social media. In 2017 alone,
Kenya saw a 35% increase in internet users, 1 million new social media users, and a
10% increase in phone use [10]. One in five Africans (21%) now regularly get news
from social media, and among youth and citizens with post-secondary education, the
Internet and social media are more popular sources of news than newspapers [13].
   In response, the traditional African media (newspapers, radio, TV, etc.) have
expanded their online presence. Kenya’s most widely circulated newspaper, The
Daily Nation, has over 1.5 million followers on Twitter, and NTV, its sister TV sta-
tion, has over 2 million followers and posts in both English and Swahili. Several
international media groups, including the BBC and Deutsche Welle, have bureaus in
Kenya that regularly post content on social media and on their websites in Swahili
and English. The spread of the internet and urbanization, however, has fragmented
the media landscape [14]. The result is that targeting communications to general
audiences has become more difficult. Placing an article on landscape restoration in
The Daily Nation no longer guarantees the influence it once did. At the same time,
the increasingly fragmented media landscape enables messages to freely reach new
and more specific audiences and for communicators to directly shape the narrative.
   Access to technology, however, is still a limiting factor to communications, par-
ticularly in low-income countries (LICs) and in rural areas, where there is limited
access to electricity. Those who live in rural areas, including restoration practition-
ers, are also less likely to have access to the internet, mobile phones, and other com-
munication technology. Women in Africa are also 13% less likely to own a mobile
phone than men. Another limitation to efficient communication across Africa is its
high linguistic diversity [15]. While some researchers estimate that over 50% of
Africans speak more than two languages, fluency in major international languages,
especially English and French, is limited, especially in rural areas [16]. For restora-
tion communicators who craft messages in international languages, engaging local
audiences is a major challenge.

                                                                            13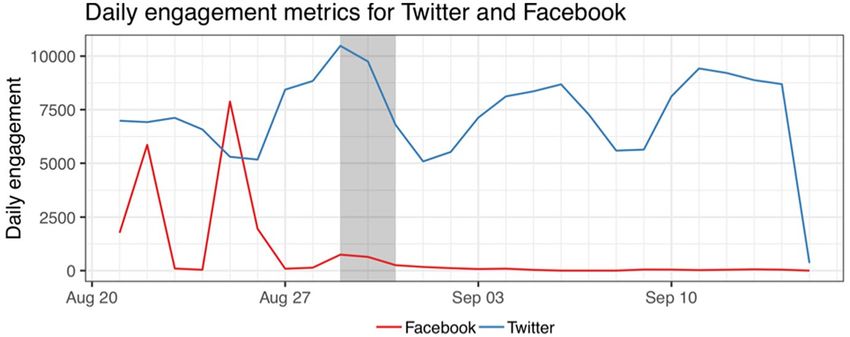
170                                      Journal of Computational Social Science (2020) 3:167–188

The Global Landscapes Forum

The Global Landscapes Forum (GLF), a space for discussion for policymakers,
implementers, and others working to improve landscapes, was originally hosted in
2013 as part of the United National Climate Change Conference of Parties (UNF-
CCC COP). The GLF, which separated from the UNFCCC in 2017, calls itself “the
world’s largest knowledge-led platform on sustainable land use,” and restoration is
one of its key pillars [17]. The GLF serves as a key space where NGOs, govern-
ments, the private sector, practitioners, and international organizations can share
expertise, network, and pilot new projects or theories of change.
   The GLF organized its first Africa-based conference in Nairobi, Kenya at the
headquarters of the United Nations Environment Programme (UNEP) from August
29 to 30, 2018. The GLF argued that, “By bringing together actors from all back-
grounds and sectors, the conference will spark a global conversation around Africa’s
landscapes” [1]. The conference, “Landscape Restoration in Africa: Prospects and
Opportunities,” offered an opportunity to highlight African leadership and focused
on boosting diversity and inclusion at the international level, specifically amplifying
the voices of African speakers and youth attendees. In this spirit, the GLF sponsored
100 African youth leaders under 35 years old to attend the conference and a separate
leadership program [18]. Several of these youth leaders are active and influential on
social media, and they used their clout to spread positive messages about sustain-
able landscapes to their extensive networks during the conference. The Nairobi 2018
GLF drew 800 in-person attendees, and 13,000 people tuned in online. The GLF’s
social media reached another 52 million people [17].

Social media analysis

In the past 10 years, text mining of social media data has contributed to research
on politics, marketing, public health, urban planning, transportation, and education
[19]. Twitter data have been used for a wide variety of applications, including identi-
fying gang members [20], predicting stock market movements [21], and forecasting
voter turnout [22]. Within the field of climate change research, Twitter data have
primarily been used to monitor public opinion on climate change. For instance, [23]
analyzed how exposure to severe weather events affects climate change perceptions
on Twitter. They found that users express their concerns related to extreme weather
on social media, and that major climate events can drive changes in sentiment and
mood on Twitter. In a similar study, [24] concluded that Twitter is an important
platform for spreading climate change awareness. These studies point to the utility
of mining large-scale social media data to supplement or replace traditional survey
methodologies in cases where they are not feasible to conduct because of geographic
or temporal scale.
   Recent advancements in natural language processing, such as word and sentence
embeddings, have significantly increased the utility of text mining approaches to
Twitter data. While initial studies primarily relied on latent Bayesian methods like

13
Journal of Computational Social Science (2020) 3:167–188                             171

Latent Dirichlet allocation [25], the short and highly varied nature of Tweets reduces
the accuracy of unsupervised classification with these methods [26]. Embedding
methods, such as Word2Vec [27] and GloVe [28], have improved the ability to
identify hundreds of topics across large collections of Twitter data [29]. One such
method, the Universal Encoder (USE) [30], is particularly relevant to modeling
Twitter data because it is designed to be generalizable to a wide range of variable
length documents by leveraging multi-task training on multiple downstream tasks
like classification, subjectivity and sentiment analysis [30]. Li et al. [31] identified
USE as the current state-of-the-art technique for classifying and identifying topics in
Twitter data.
   Identifying the demographics of users on social media platforms can provide
invaluable context to topic identification and network analysis of social media
communities. There are a number of ways to infer the demographics of users on
Twitter, including computer vision, network analysis, website traffic data, and nat-
ural language processing of names and posts. Analyzing first and last names with
a character-based recurrent neural network, [32] achieved 73% accuracy classify-
ing 13 ethnicities, and 83% accuracy classifying people into four categories (Asian,
Hispanic, black, white). Computer vision approaches, such as the wide residual net-
work, have recently enabled researchers to predict the age of people in photographs
with an average error of 2.7 years, significantly outperforming human estimation,
which averages a 6.3-year error [33]. Deep convolutional neural networks have also
achieved 95% accuracy in image-based gender classification [34].
   Demographic analyses of Twitter and other social media data using the meth-
odologies described above have made significant contributions to demographic
research in recent years, including applications in researching segregation, political
ideologies, tobacco use, international migration, and the spread of foodborne illness
[35–37] found that Twitter also provides a platform for mobilization for traditionally
underrepresented or marginalized groups. Given the widely accepted racial and class
inequality in global environmental movements, globally robust, real-time identifica-
tion of who is engaging in trending topics on Twitter may provide useful insights
into how different populations engage with climate issues [38]. For instance, social
interactions on Twitter have been used to infer demographic characteristics like
political ideology [39], location [40], income [41], and gender [42].

Methodology

Social media data sources and collection methods

Raw data for this study were collected from Twitter and Facebook between 20
August 2018 and 15 September 2018 to identify online activity before, during,
and after the GLF conference. For a broad understanding of social media interac-
tion with GLF event materials, we collected engagement metrics on Facebook for
21 web pages promoted in the GLF “Nairobi 2018 social media toolkit” (See sup-
plementary information for full list) [43]. Twitter’s public API was used to collect
relevant Tweets and user profiles during the study period.

                                                                             13
172 Journal of Computational Social Science (2020) 3:167–188
Our other collection mechanism relied on Twitter’s real-time filter stream, which
allows users to specify a set of keywords, individuals, and locations to track. Using
Twitter’s API, we used five separate filter streams to collect Tweets that contained a
specified keyword, mentions of key users, were written by a specified individual, or
were geolocated to a specified location concurrent with our dictionaries developed
by restoration experts (See SI for full list; Table 1). While the sample stream gives
a random (< 1%) sample of content posted to Twitter, the filter stream allowed us
to collect all tweets that matched our filters posted to the platform as long as the
volume of Tweets did not exceed 1% of the platform’s total volume. To compare the
data from the GLF Nairobi, we also analyzed a dataset of 575,930 Tweets collected
during the 2017 GLF in Bonn, Germany in December 2017.
Data cleaning
To reduce the noise inherent to social media analysis, we leveraged social inter-
actions among the individual accounts in our dataset to extract content produced
by relevant accounts or accounts that interacted with relevant accounts. Retweets,
wherein an individual A rebroadcasts a message authored by individual B to indi-
vidual A’s followers, were used to construct a network of individuals with nodes that
represent authors of Tweets, and edges constructing directed links between nodes A
and B that represent node A having retweeted node B.
Prior work has found that the community structure in retweet networks is predic-
tive of community membership, e.g., for political orientation [39]. We, therefore,
used the community structure in our retweet network to form groups of individuals
and their discussions. For each sizable community in the overall retweet network,
we identified the most retweeted Twitter accounts and the most shared hashtags to
discard communities that did not discuss topics relevant to the GLF. As a result,
every tweet in our final dataset was filtered both by content (i.e., keywords and
accounts) and by social interactions (i.e., the author interacts with a group discuss-
ing GLF-related topics). To extract the community structure from this retweet net-
work, we used a label propagation algorithm, which iteratively spreads a node’s
label to its neighbors, and each neighbor adopts a label based on majority voting.
Table 1 Data collection streams, timeframes, and number of collected Tweets
Stream Description Timeframe Tweets
1 GLF Nairobi 2018 Promoted Hashtags and @GlobalLF 21 August–15 September 19,770
2 Tweets geolocated to Nairobi, Kenya 20 August–15 September 175,819
3 Accounts from the Global Restoration Council, Global 21 August–15 September 710,004
Partnership on Forest and Landscape Restoration,
GLF partners, and GLF-promoted organizations as
well as African conference voices and youth leaders
4 High-confidence dictionary of 143 keywords 21 August–15 September 109,867
5 Low-confidence and foreign language dictionary 21 August–15 September 90,569
13Journal of Computational Social Science (2020) 3:167–188 173
For tractability concerns, prior to running label propagation, we removed nodes with
fewer than 2 edges and only stored communities with 100 or more users.
We identified four communities with over 100 users with discussions relevant to
the GLF: One community centered on the hashtags “restoration”, “climate action”,
and “climate change”, the second focused on the hashtag “#Plant4Pakistan”, the
third community was composed of UN agencies, and the fourth community focused
on the Mongabay account/climate change. These four communities contained
17,752 unique Twitter accounts and 188,675 tweets.
Identifying important individuals in social network data
We identified three types of central users among the restoration-related commu-
nities: authoritative users, users with the furthest “reach”, and users that connect
different communities. These types of individuals correspond to three centrality
metrics common in social network analysis: PageRank, closeness centrality, and
betweenness centrality. An individual’s PageRank score is proportional to the likeli-
hood of encountering that individual after an infinite random walk through the net-
work, which we interpret as “authority.” Closeness centrality measures the average
shortest path to each node, so individuals with high closeness centrality can rap-
idly distribute information. Lastly, betweenness centrality is a measure of how many
shortest paths between all pairs of nodes traverse a given node, corresponding to
“bridges” between otherwise disconnected communities. In addition to measuring
central users in the social network with centrality measures, we also analyze the
“loudest” users, measured by the total relative volume of tweets for each user in the
network.
Quantifying influence through effects on followership
To understand how an organization or an individual can influence the conversa-
tion on a social network, we measured the effect that an influential account has on
driving other individuals to new content by measuring how the number of Twit-
ter followers of other accounts changes over time. This metric operates under the
assumption that significant increases in follower count indicate that an influential
account pushed many of its followers to follow a new account. In the context of the
GLF Nairobi, this metric also provides insight into whether the event itself leads
to greater exposure. That is, if the population taking part in the GLF was already
densely connected, one would expect little change in followership for promoted or
advertised accounts. If, on the other hand, the GLF engaged new individuals, we
would expect increases in followership among promoted and central accounts par-
ticipating in the GLF discussion. We measure these increases in followership by
absolute increase and multiple increase. The former relates to the absolute change
in Twitter followers from the beginning to the end of data collection, while the latter
is the multiple between the maximum and minimum number of followers for each
account during the study period.
13174 Journal of Computational Social Science (2020) 3:167–188
Identifying demographics and locations from twitter data
A stated goal of the GLF Nairobi was to promote African voices in the restoration
movement. To get a sense of the demographics of individuals participating in the
GLF discussion on social media, we estimated the age, gender, race, and geographic
origin of Twitter profiles using a combination of self-reported location data, com-
puter vision of social media photographs, natural language processing, and inferen-
tial statistics of U.S. Census and Wikipedia data.
Self-reported locations on Twitter profiles were mapped to countries using the
pigeo Python library [44], which is a machine learning-based classifier trained to
infer a user’s city and country from a given location string. To compare user loca-
tions between the GLF Nairobi and the previous GLF in Bonn, we compared the
distribution of user locations in our Twitter datasets for both Nairobi and Bonn. A
wide residual network [45] was used to estimate the age and gender of individu-
als in Twitter photographs. The pre-trained network was originally trained on over
50,000 photographs labeled by age and gender derived from a number of sources,
including Wikipedia, social media, and Flickr [33]. The reported validation error
for age was 3.96 years and for gender was 12%. We modified the architecture in
[33] to automatically identify and disregard Twitter handles that do not have pro-
file pictures containing faces. When there was more than one face, the Twitter han-
dle was assigned the age and gender most likely to belong to the name associated
with the handle. Individuals’ first names were compared with gender distributions
obtained from historical U.S. census data to add robustness to the gender prediction
[46]. The name-based and photograph-based gender identification matched in 96%
of sample cases, and non-matching samples were dropped. While we are unable to
report a validation F1-score for the combined computer vision and name classifica-
tion approach due to a lack of labeled response data, it is likely that combining these
two metrics and subsetting data to positively matched samples increase the robust-
ness of the classification.
Race was classified into four groups (Asian, African, White, and Hispanic) using
a character-level recurrent neural network of first and last names using the archi-
tecture put forth by [32]. Asian-classified names included those which were East
Asian, Japanese, and Indian as well as Asian registered voters (as identified by the
U.S. Census), African names included Greater African and Muslim names and black
registered voters, White names included non-Hispanic European names (including
British, East European, Jewish, French, Germanic, Italian, and Nordic) and white
registered voters, and Hispanic included Hispanic European names as well as Latino
registered voters.
A number of computer vision approaches to estimating race were tested, but name-
based approaches consistently had higher validation accuracy. The method employed
by [32] uses over 12 million names in the Florida voting registration database and over
130,000 unique names from Wikipedia articles. The original paper reports a validation
F1-score, measured as the harmonic mean of precision and recall, of 0.83. Because the
original model generalizes US voting data to non-US regions, we improve the robust-
ness of our approach by analyzing results based on a binary white/non-white metric, for
which the model reports a 0.90 F1-score. We also compared results using the methods
13Journal of Computational Social Science (2020) 3:167–188 175
in [32] with the location metrics described above, for which all demographics matched
within 2%. Twitter accounts that did not list both their first and last name, as well as
those that listed other words than proper nouns, were removed from consideration in
the data cleaning stage. After removing Twitter profiles with no photographs or pho-
tographs with no identifiable individuals, and Twitter profiles with non-identifiable
names, this ensemble approach enabled the automated identification of demograph-
ics for 72% (12,744) of the 17,752 Twitter handles within our dataset, representing
135,512 Tweets.
Identifying topics in Twitter data
Tweets are typically difficult to analyze with natural language processing, owing to
their frequent grammatical and spelling errors, presence of hashtags and emoticons,
and short text length. We used the Python module “ekphrasis” to clean Twitter text
data, which exploits a character-level recurrent neural network trained on over 1 bil-
lion Tweets from 2017 and 2018 [47]. This enabled us to automatically correct spell-
ing errors and elongated words, separate hashtags into constituent phrases, and con-
vert user mentions and other common Tweet structures into a single unique token. To
model the semantic and topical structure of Tweets, a number of recent natural lan-
guage processing approaches were tested. These include latent Bayesian approaches
such as latent Dirichlet allocation [25], structured topic models [48], biterm topic mod-
els [26], as well as neural embedding approaches including Word2vec [27], Tweet2vec
[49], MUSE [50], and the Universal Sentence Encoder [30]. The Universal Sentence
Encoder (USE) performed better than the other tested approaches when qualitatively
evaluated on sentence similarity and topic coherence.
The Universal Sentence Encoder uses transfer learning to learn task-invariant sen-
tence representations. The pre-trained model uses the transformer architecture [51] to
jointly learn tasks including sentiment, subjectivity, and polarity analysis as well as
question classification and semantic similarity. This generalizability makes it a strong
candidate for representing the topics and meanings of Tweets, which vary widely in
diction and prose. 138,512 Tweets from 12,744 unique handles were encoded with the
pretrained USE model and clustered with K-nearest neighbors (KNN) clustering. Clus-
ter amounts ranging from 50 to 250 were tested by reading random stratified subsam-
ples of 20 randomly chosen topics. KNN with k = 200 was selected for final analysis
based on this manual validation method. Each of the 200 topics was manually labelled
by reading 50 random Tweets in each topic. The age, gender, and racial distribution of
each topic were calculated by joining the topic number to the demographic data set,
and differences in demographic engagement within topics were calculated with a Chi-
square test. Analyses were performed in the R environment for statistical computing
[52], as well as Python 3.6 with TensorFlow 1.4 [53].
13176 Journal of Computational Social Science (2020) 3:167–188 Fig. 1 Reactions to GLF-promoted links on Facebook (red) and Tweets about the GLF (blue) during the study period. The days shaded in gray correspond to the GLF Nairobi event Table 2 Most frequent, Retweeted, and Central Accounts Rank Loudest Retweeted PageRank Closeness Betweenness 1 OlumideIDOWU UNEnvironment UNFCCC UNFCCC GlobalLF 2 RichardMunang UNFCCC UNEnvironment UNEnvironment OlumideIDOWU 3 GlobalLF BBCAfrica ErikSolheim UN UNEnvironment 4 estherclimate WorldBank BBCAfrica antonioguterres ClimateWed 5 ClimateWed ErikSolheim AfDB_Group ErikSolheim estherclimate 6 EWestaway AfDB_group PEspinosaC GlobalLF RnfrstAlliance 7 msimire GlobalLF WorldBank BBCAfrica ErikSolheim 8 wandieville rnfrstalliance GlobalLF RnfrstAlliance RichardMunang 9 Individual account RichardMunang antonioguterres WorldBank AfDB_Group 10 africa_ci ClimateWed JoyceMsuya UNYouthEnvoy choi_afdb Results Overall engagement Engagement with GLF event links on Facebook was highest in the days leading up to the conference, while Tweets about the GLF peaked during the event but main- tained longer engagement both during the weeks before and after the event (Fig. 1). Overall, GLF-related links were shared on Facebook 14,314 times, representing about 7.5% of the overall monitored social media engagement. Identifying influential Twitter accounts Measured with graph theory methods, many of the most influential Twit- ter accounts were international organizations or their representatives (e.g., UN 13
Journal of Computational Social Science (2020) 3:167–188 177
Environment, UNFCCC, Erik Solheim), development banks, and news channels
(Table 2). To preserve the privacy of individual Twitter accounts, the names of
accounts that are not verified, organizations, or public figures (e.g., journalists,
activists, spokespeople, celebrities, and major figures of international organiza-
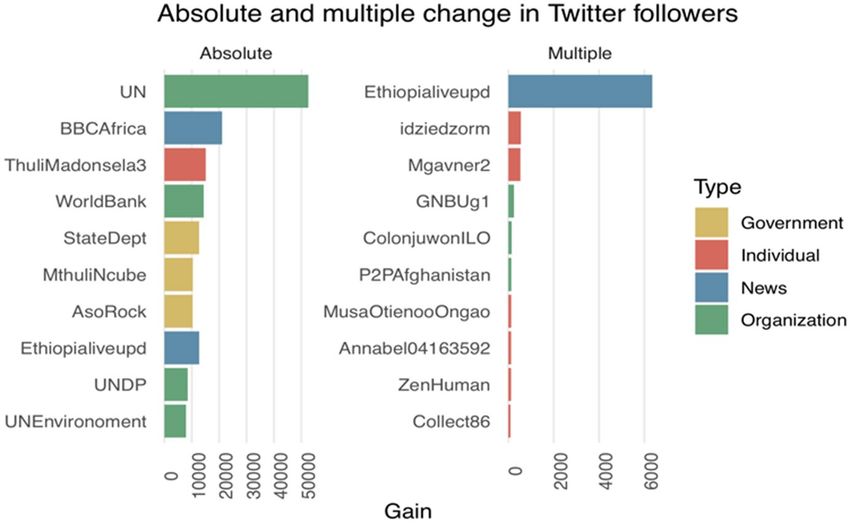
tions) have been masked. Governments and organizations had the highest over-
all increase in Twitter followers, while individuals and smaller organizations
saw large multiplicative increases (Fig. 2). African individuals ranked high in
the table with prominent activists, government leaders, and reporters: OlumideI-
DOWU, a Nigerian climate activist and youth leader, was the loudest user. Rich-
ardMunang, a public communicator on environmental issues, estherclimate, a
climate action blogger at the UN, msimire, an urban planner and journalist, and
wandieville, a journalist who covers agriculture, followed closely behind.
Comparing demographics of the GLF Bonn and the GLF Nairobi
Figure 3 compares the distributions of continental origins for the Twitter accounts
taking part in both the GLF Bonn 2017 and GLF Nairobi 2018. The social media
community engaging with the GLF Nairobi contained a significantly higher per-
centage of individuals from Africa than did the GLF Bonn community. The most
common user origins by country at the GLF Nairobi were (in descending order)
the United States of America, the United Kingdom, Kenya, Nigeria, and South
Africa. In contrast, the GLF Bonn’s participants most commonly came from the
United States of America, the United Kingdom, India, Kenya, and Canada.
Fig. 2 Absolute (left) and multiple (right) change in Twitter followers during the study period colored by
the type of Twitter user
13178 Journal of Computational Social Science (2020) 3:167–188 Fig. 3 Continental distribution of studied Twitter users during the Bonn and Nairobi GLF, determined by geolocating user locations from Twitter profiles Demographic differences in topic engagement The most discussed topic on Twitter during GLF Nairobi was retweets of cov- erage of the latest research, innovation, and publications. Among the top topics were also conversations about the costs of climate change inaction, conference- related event information, gender awareness and women in restoration, statements by country governments, and success stories in restoration. The demographics of profiles interacting with all climate-related topics on Twitter during the GLF Nairobi conference was 59% men, 41% women, 25% African, 16% Asian, 52% White, and 7% Hispanic (Fig. 4). The average age was 30 years, and only 2.5% were under 24 years of age. There was significant vari- ability in demographic-level engagement with the 200 identified topics. Women engaged significantly more with conversations on natural disasters, endangered species, animal rights, food security, and success stories (Chi-sq = 4573, p < 0.01; Fig. 4). Men engaged significantly more with conversations on supply chains, data and statistics, and illegal activities and corruption. White profiles engaged with conversations on policy, data, research, and the United Nations signifi- cantly more than other demographics (Chi-sq = 15,510, p < 0.01). African profiles engaged significantly more with conversations about youth initiatives, women’s rights, industrial pollution, restoration in the supply chain and global market, and the role of technology platforms and apps in tree planting and restoration (Chi- sq = 15,510, p < 0.01; Fig. 4). 13
Journal of Computational Social Science (2020) 3:167–188                                               179

Fig. 4  Top left: demographic breakdown of study Twitter profiles by age, gender, and race. Sample size
for gender and age is lower than that of race because the latter does not require a photograph of the user.
Top right: topics with disproportionate gender representation. Bottom left: topics with disproportionate
race representation. Bottom right: topics with disproportionate youth representation

   Youth engagement was significantly higher for viral topics during the event,
such as “plogging”—a combination of jogging and picking up litter, news arti-
cles about attaching air pollution monitors to Google Street view cars, and
“the long swim”—an endurance swim by the UN Patron of the Oceans to raise
awareness on ocean pollution (Fig. 4; Table 3). Youth innovation, centering on
the youth activities organized by the GLF, had the highest engagement of youth
profiles among all identified topics, suggesting that the event increased youth
engagement. On the other hand, young people interacted significantly less with
conversations on statistics, agricultural technology, and political unrest than
older demographics.

                                                                                              13
180 Journal of Computational Social Science (2020) 3:167–188
Table 3 Overview of demographic differences in topic engagement on Twitter
Demographic Women White Youth
More engagement + Natural disasters + Policy + Viral topics
+ Endangered species + Data
+ Animal rights + Research
+ Food security + United Nations
+ Success stories
Less engagement − Supply chains − Youth initiatives − Statistics
− Data and statistics − Women’s rights − Agricultural technology
− Illegal activities and corruption − Industrial pol- − Political unrest
lution
− Restoration in
the supply chain
− Role of technol-
ogy platforms
Community network structures between GLF Bonn and GLF Nairobi
The 2018 Nairobi conference attracted more individuals to the conversation
(23,132 vs. 9441 accounts), while the 2017 Bonn conference’s smaller net-
work was nearly three times denser (though both networks were quite sparse,
at 3.59e−4 and 1.45e−4, respectively). This difference suggests that Nairobi
attracted both additional individuals and that these individuals were more likely
to engage with less similar and more individuals in the network. Centrality met-
rics like betweenness and PageRank also suggest that the GLF Nairobi network
had more bridges between communities and was less centralized. Recalling that
high betweenness centrality suggests the presence of bridges between communi-
ties, the 95th percentile for the 2017 GLF in Bonn is about 50% larger than the
2018 GLF in Nairobi (7.5e−5 to 5.0e−5, respectively). The PageRank, which
captures the amount of centralization in the network, of the 2017 GLF is more
than double that of the 2018 GLF in Nairobi (1.95e−4 to 8.5e−5, respectively).
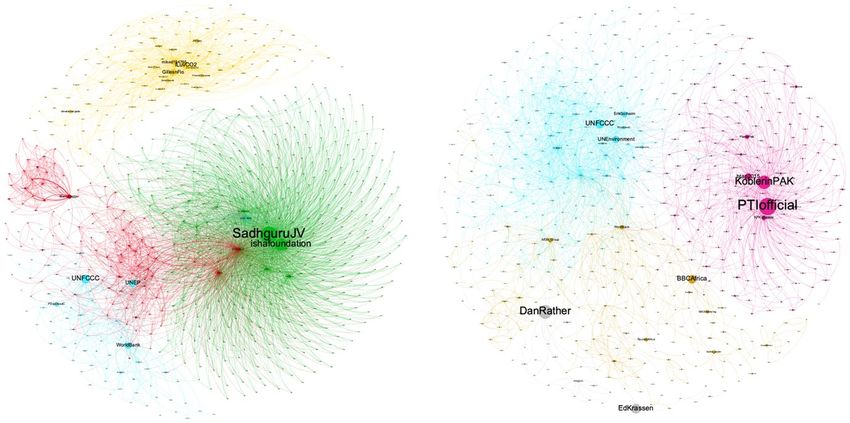
In each GLF dataset, we identified four major communities with more than
100 individuals. For the 2017 GLF in Bonn, these four communities centered
around restoration organizations, United Nations organizations, proponents of
the Rally for Rivers movement, and a conspiracy-theory/anti-climate-change
focused group (Fig. 5). For the 2018 GLF in Nairobi, the four communities
center on UN organizations combined with restoration groups, Africa-centric
organizations, United States politicians/activists, and Pakistani governmental
organizations and representatives. The Nairobi GLF network is visibly less cen-
tralized and has more bridges between communities, in accordance with the cen-
trality metrics. A full list of the top ten most authoritative individuals in each
community is included in the supplementary information.
13Journal of Computational Social Science (2020) 3:167–188 181
Fig. 5 Community networks of GLF Bonn (left) and Nairobi (right) demonstrating a larger presence of
the UNFCC network and a less dense network structure in the Nairobi conference
Discussion
Analyzing social media data can help researchers to understand how inclusive and
influential international events are in real time. The use of machine learning and
artificial intelligence for automated classification expands the utility of this data
stream by providing automated insights into demographics and discussion topics.
For decades, actors in the international environment space have called for increasing
voices from developing countries. For organizations like the GLF, which have the
explicit goal of engaging and learning from diverse and marginalized groups, ana-
lyzing online engagement metrics with machine learning can allow organizers and
researchers to quantitatively assess progress toward this goal.
Our results suggest that holding this GLF in Nairobi, Kenya did indeed lead to
an increase in engagement of African voices. Afrocentric organizations and African
individuals, such as BBC Africa and OlumideIDOWU, identified through location
and demographic analysis as well as by the initial Twitter streams, were “louder”
than during the 2017 GLF in Bonn, Germany. Kenya, Nigeria, and South Africa
featured in the top five countries of origin for the conference. While significant pro-
gress was made to include African voices, white males over 30 remained the largest
demographic of individuals participating in online discussions.
Of the four communities identified, three focused largely on global or regional
agenda, while one community heavily focused on restoration in Pakistan. Although
Pakistan is a part of the global restoration movement with a national commitment to
the Bonn Challenge, more than 80% of all forest and landscape restoration in Paki-
stan is a subnational movement with a specific regional focus [54]. This segmenta-
tion of the subnational restoration movement, the “Billion Tree Tsunami” campaign,
may explain the presence of this Pakistan-specific community.
Less than three percent of Twitter profiles in our dataset belonged to people under
24, significantly less than the global Twitter average of 16%. The GLF Nairobi
13182 Journal of Computational Social Science (2020) 3:167–188 hosted a 4-week “Youth in Landscapes Initiative” before and during the conference that was designed to amplify the voices of youth actors in restoration. Our results also suggest that this focus on youth presence at the conference and in online inter- actions likely increased youth engagement levels on social media, with youth inno- vation being the top topic that young people interacted with in our dataset. Our results show that youth engaged significantly more with viral topics and significantly less with politics and statistics, indicating that framing communications strategies in ways that appeal to targeted audiences is increasingly important as online conver- sations continue to fracture. A reactive and adaptive communications strategy that aims to incorporate current trends into messaging could engage more young people. Users with different demographic characteristics engaged with different topics on Twitter. Our machine learning approach to analyzing social media data allows researchers to monitor how certain messages resonate with specific audiences and can be used to help craft messages that are most likely to resonate with diverse audi- ences. The strategy of building separate messages aimed at different social groups is successfully used in commercial marketing and advertising [55] and in campaigns that are part of grassroots social movements. In NGO and international organiza- tions, however, it is often not prioritized. Our results demonstrate that the explicit consideration and monitoring of demographic-level engagement metrics may help craft communications strategies that foster increased levels of diversity and inclusion. Conclusion To accelerate restoration throughout Africa, the Global Landscapes Forum brought together a diverse group of practitioners and policymakers at its 2018 event in Nai- robi. The GLF succeeded in generating substantial online conversation, reaching over 52 million people on social media surrounding their Nairobi event [56]. Ana- lyzing the conversation on Twitter using machine learning and artificial intelligence for automated classification helps us to understand whose messages and which top- ics came to the forefront. However, future research is necessary to identify whether the use of online platforms over- or under-estimates offline engagement among dif- ferent demographic groups based on their access to technology and differing societal norms. While the present paper disambiguates general topics by demographics, the topic of a communications material is often fixed. Future research should consider how to disambiguate demographic engagement within the same topic, for instance by major emotional themes or by verbosity. This would allow communications mes- saging on a set topic to be tailored to the interests and perspectives of each audience. Our research shows that choosing to locate the conference in Nairobi did encour- age greater participation from youth and local African voices. This finding supports the argument that the GLF must consider location and theme when looking to bring new voices to the conversation. The decision to host a GLF in Accra, Ghana in 2019 is a promising sign. For those looking to encourage greater youth and African par- ticipation, our research also highlights concrete steps that communicators can take. Young people, for example, have a strong preference for viral moments or messages 13
Journal of Computational Social Science (2020) 3:167–188                                                    183

about technology. A diverse communications strategy is necessary to reach groups
that are often sidelined in online conversation and can contribute to a more diverse
and inclusive movement.
   When considering restoration in Africa, the lack of universal access to electricity
and the Internet, especially in the rural areas where those who restore land live, com-
plicates the aspiration for an inclusive African restoration movement. Over 40% of
Africans own a mobile phone, and 725 million will have a smartphone by 2020 [10],
but only 37.3% percent of the population is online [11]. Engaging African audiences
online is part of the solution, but we cannot forget the other 60% of Africans. There
is also significant disparity in Internet access between African countries. Kenya has
one of the Africa’s most developed media and telecommunications landscapes. In
poorer countries, like Malawi, with less developed communications tools but where
landscape restoration is also at the top of the national agenda, it is significantly more
difficult to include local people in the global conversation. Communication strate-
gies must go beyond the digital to ensure that these audiences, often building their
own local restoration movements, feel heard and included in decision-making.

Compliance with ethical standards

Conflict of interest On behalf of all authors, the corresponding author states that there is no conflict of
interest.

Open Access This article is licensed under a Creative Commons Attribution 4.0 International License
(https://creativecommons.org/licenses/by/4.0/), which permits use, sharing, adaptation, distribution and
reproduction in any medium or format, as long as you give appropriate credit to the original author(s) and
the source, provide a link to the Creative Commons licence, and indicate if changes were made.The images
or other third party material in this article are included in the article’s Creative Commons licence, unless
indicated otherwise in a credit line to the material. If material is not included in the article’s Creative Com-
mons licence and your intended use is not permitted by statutory regulation or exceeds the permitted use,
you will need to obtain permission directly from the copyright holder. To view a copy of this licence, visit
http://creativecommons.org/licenses/by/4.0/.

Appendix

See Tables 4, 5, 6 and 7.

                                                                                                  13
184 Journal of Computational Social Science (2020) 3:167–188
Table 4 GLF Nairobi 2018 URLs Tracked on Facebook
Page name URL
GLF Homepage https://www.globallandscapesforum.org
GLF Nairobi 2018 Home Page https://events.globallandscapesforum.org/nairo
bi-2018/
GLF Nairobi 2018 About Page https://events.globallandscapesforum.org/nairo
bi-2018/about/
GLF Nairobi 2018 Agenda https://events.globallandscapesforum.org/nairo
bi-2018/agenda/
GLF Nairobi 2018 Theme https://events.globallandscapesforum.org/nairo
bi-2018/concept-note/
Online Survey for GLF Audience https://events.globallandscapesforum.org/nairo
bi-2018/have-your-say/
GLF Nairobi 2018 Online Streams https://events.globallandscapesforum.org/nairo
bi-2018/join-online/
GLF Nairobi 2018 Photo Competition https://events.globallandscapesforum.org/nairo
bi-2018/photo-competition/
GLF Nairobi 2018 Quiz https://events.globallandscapesforum.org/nairo
bi-2018/quiz-landscape-restoration-africa/
GLF Nairobi 2018 Resources for Getting Involved https://events.globallandscapesforum.org/nairo
bi-2018/shape-the-conversation/
GLF Nairobi 2018 Speakers https://events.globallandscapesforum.org/nairo
bi-2018/speakers/
GLF Nairobi 2018 You Leaders https://events.globallandscapesforum.org/nairo
bi-2018/youth-leaders-at-glf-nairobi-2018/
GLF Nairobi 2018 News https://news.globallandscapesforum.org
AFR100 Announcement http://afr100.org/content/3rd-afr100-annual-partn
ership-meeting
AFR100 Announcement for the GLF http://afr100.org/content/global-landscapes-forum
-nairobi-2018
AFR100 Homepage http://afr100.org/content/home
AFR100 Announcement http://www.nepad.org/content/3rd-afr100-annua
l-partnership-meeting
AFR100 Twitter Account https://twitter.com/Afr100_Official
GLF Twitter Account https://twitter.com/GlobalLF
GLF Instagram Account https://www.instagram.com/globallandscapesforum
GLF YouTube Channel https://www.youtube.com/GlobalLandscapesForum
13Journal of Computational Social Science (2020) 3:167–188 185
Table 5 Highest gains in Rank Gain in followers, absolute Gain in followers, multiple
followers
Account Gain Account Gain
1 UN 52,521 Ethiopialiveupd 6353
2 BBCAfrica 21,052 Individual account 553
3 ThuliMadonsela3 15,094 Individual account 532
4 WorldBank 14,352 Individual account 246
5 Ethiopialiveupd 12,705 Individual account 146
6 StateDept 12,664 P2PAfghanistan 131
7 MthuliNcube 10,381 Individual account 127
8 AsoRock 10,292 MusaOtienoOngao 122
9 UNDP 8511 Individual account 120
10 UNEnvironment 7893 Individual account 95
Table 6 2017 GLF Bonn Communities
Rank Restoration organiza- UN organizations Rally for rivers sup- Conspiracy/anti-climate
tions porters change
1 BiancaJagger UNFCCC SadhguruJV Suspended account
2 GlobalLF UNEnvironment ishafoundation Individual account
3 CIFOR WorldBank dw_environment Individual account
4 restoreforward PEspinosaC IshaTamil Individual account
5 FAOForestry ErikSolheim jmollins Individual account
6 mongabay AfrozShah1 rallyforrivers FriendsOScience
7 Individual account KGeorgieva vishwamTOI climatefrauds
8 Individual account JimYongKim Individual account Individual account
9 FTA_CGIAR WBG_Climate Individual account drwaheeduddin
10 Individual account EmmanuelMacron IshaUSA Individual account
Table 7 2018 GLF Nairobi Communities
Rank UN Organizations Afrocentric coverage US activists Pakistani organizations
1 UNFCCC BBCAfrica DanRather PTIofficial
2 UNEnvironment AfDB_Group Suspended account KoblerinPAK
3 ErikSolheim WorldBank MichaelAvenatti btap2015
4 PEspinosaC ReutersAfrica jeffrey_ventre KPKUpdates
5 GlobalLF BBCMonitoring savebutterflies Plant4Pak
6 antonioguterres burke_jason SenBillNelson Individual account
7 JoyceMsuya WandileSihlobo Individual account Individual account
8 UN USAID Individual account Individual account
9 RichardMunang ITCnews MooreCharitable Individual account
10 RnfrstAlliance Individual account Individual account staoir
13186 Journal of Computational Social Science (2020) 3:167–188
References
1. Global Landscapes Forum. (2018) Forest and Landscape Restoration in Africa: Prospects and Opportu-
nities Forest and Landscape Restoration in Africa: Prospects and Opportunities A Global Landscapes
Forum event Forest and Landscape Restoration in Africa: Prospects and Opportunities A Globa.
2. Gabizon, S. (2016). Women’ s movements’ engagement in the SDGs : lessons learned from the
Women’ s Major Group from the Women’ s Major Group. Gender & Development, 2074(24), 99–110.
3. Carant, J. B. (2017). Unheard voices : A critical discourse analysis of the Millennium Develop-
ment Goals’ evolution into the Sustainable Development Goals Development Goals. Third World
Q., 38(1), 16–41.
4. Atzmueller, M., & Lemmerich, F. (2018). Homophily at academic conferences. In The Web Confer-
ence Companion (pp. 3–4).
5. Lovei, M. Desertification is not fate. [Online]. https://blogs.worldbank.org/nasikiliza/desertification
-is-not-fate. Accessed 6 Jun 2019.
6. Niang, I. et al. (2014). Africa. In Climate change 2014: Impacts, adaptation, and vulnerability (pp.
1199–1265). Cambridge: Cambridge University Press.
7. TARGET 15—Technical Rationale extended. (2012). [Online]. https://www.cbd.int/sp/targets/ratio
nale/target-15/. Accessed 6 Jun 2019.
8. Bonn Challenge. [Online]. http://www.bonnchallenge.org/. Accessed 6 Jun 2019.
9. Yahya, M. Africa’s defining challenge | UNDP in Africa. [Online]. http://www.africa.undp.org/
content/rba/en/home/blog/2017/8/7/africa_defining_challenge.html. Accessed 18 Jun 2019.
10. GMSA. The Mobile Economy—Africa 2016. [Online]. https://www.gsma.com/mobileeconomy/
africa/. Accessed 18 Jun 2019.
11. Africa Internet Users. 2019 Population and Facebook Statistics. [Online]. https://www.inter
networldstats.com/stats1.htm. Accessed 18 Jun 2019.
12. Mourdoukoutas, E. The hashtag revolution gaining ground. [Online]. https://www.un.org/afric
arenewal/magazine/april-2018-july-2018/hashtag-revolution-gaining-ground. Accessed 18 Jun
2019.
13. Nkomo, S., Wafula, A. Strong public support for ‘watchdog’ role backs African news media
under attack|Afrobarometer. [Online]. https://afrobarometer.org/publications/ad85-media_in_
africa_world_press_freedom_day_2016. Accessed 18 Jun 2019.
14. Ramaswamy, A. The big picture: Technology to meet the challenges of media fragmentation.
[Online]. https://www.nielsen.com/us/en/insights/reports/2017/the-big-picture-technology-to-
meet-the-challenges-of-media-fragmentation.html. Accessed 18 Jun 2019.
15. Heine, B., & Derek, N. (2000). African languages: An introduction. Cambridge: Cambridge Uni-
versity Press.
16. Wolff, E. (2000). Language and society. In African languages—An introduction (p. 317). Cam-
bridge: CUP.
17. Outcome Statement of the 2016 Global Landscapes Forum: Climate Action for Sustainable
Development—Global Landscapes Forum. [Online]. https://www.globallandscapesforum.org/
publication/outcome-statement-2016-global-landscapes-forum-climate-action-sustainable-devel
opment/. Accessed 6 Jun 2019.
18. Youth in Landscapes Initiative—Nairobi Leadership Program—Global Landscapes Forum
Events. [Online]. https://events.globallandscapesforum.org/nairobi-2018/youth-leaders-at-glf-
nairobi-2018/. Accessed 6 Jun 2019.
19. Kursuncu, U., Gaur, M., Lokala, U., Thirunarayan, K., Sheth, A., & Arpinar, I. B. (2019). Pre-
dictive analysis on Twitter: Techniques and applications (pp. 67–104)., Lecture notes in social
networks Cham: Springer.
20. Balasuriya, L., Wijeratne, S., Doran, D., Sheth, A. (2016). Finding street gang members on Twit-
ter. In 2016 IEEE/ACM International Conferences on Advances in Social Network Analysis and
Mining (pp. 685–692).
21. Bollen, J., Mao, H., & Zeng, X. (2011). Twitter mood predicts the stock market. Journal of Com-
putational Science, 2(1), 1–8.
22. Tumasjan, A., Sprenger, T.O., Sandner, P.G., & Welpe, I.M. (2010) Predicting elections with
Twitter: What 140 characters reveal about political sentiment. In Proceedings of the Fourth
International AAAI Conference on Weblogs and Social Media (pp. 178–185).
13Journal of Computational Social Science (2020) 3:167–188 187
23. An, X., Ganguly, A. R., Fang, Y., Scyphers, S. B., Hunter, A. M. & Dy, J. G. (2014) Tracking
climate change opinions from Twitter Data. In KDD (pp. 1–5).
24. Cody, E. M., Reagan, A. J., Mitchell, L., Dodds, P. S., & Danforth, C. M. (2015). Climate change
sentiment on Twitter: An unsolicited public opinion poll. PLoS One, 10(8), 1–18.
25. Blei, D. M., Ng, A. Y., & Jordan, M. (2003). Latent dirichlet allocation. Journal of Machine
Learning Research, 3, 993–1022.
26. Yan, X., Guo, J., Lan, Y. & Cheng, X. (2013) A biterm topic model for short texts. In Proceed-
ings of the International World Wide Web Conference (pp. 1445–1455).
27. Mikolov, T., Chen, K., Corrado, G.S. & Dean, J. (2013) Distributed representations of words and
phrases and their compositionality. In: Proceedings of the 26th International Conference on Neu-
ral Information Processing Systems (pp. 1–9).
28. Pennington, J., Socher, R. & Manning, C. (2014) GloVe: Global vectors for word representation.
29. Fang, A., Macdonald, C., Ounis, I. & Habel, P. (2016). Using word embedding to evaluate the
coherence of topics from Twitter Data. In Special Interest Group on Information Retrieval.
30. Cer, D. et al. (2018). Universal sentence encoder. arXiv preprint arXiv:1803.11175.
31. Li, H., Caragea, D., Li, X. & Caragea, C. (2018) Comparison of word embeddings and sentence
encodings as generalized representations for crisis Tweet classification tasks. In Proceedings of
the ISCRAM Asian Pacific 2018 Conference (pp. 1–13).
32. Sood, G., & Laohaprapanon, S. (2018). Predicting race and ethnicity from the sequence of char-
acters in a name. arXiv preprint arXiv:1805.02109.
33. Rothe, R., Timofte, R., & Van Gool, L. (2016) DEX: Deep expectation of apparent age from a
single image. In 2015 IEEE International Conference on Computer Vision Workshop. Santiago,
Chile.
34. Dhomne, A., Kumar, R., & Bhan, V. (2018). Gender recognition through face using deep learn-
ing. International Conference on Computational Intelligence and Data Science, 132, 2–10.
35. Cesare, N., Grant, C., Hawkins, J. B., Brownstein, J. S. and Nsoesie, E. O. (2017). Demograph-
ics in social media data for public health research: Does it matter? In Bloomberg Data for Good
Exchange Conference.
36. Cesare, N., Grant, C., Nguyen, Q., Lee, H. & Nsoesie, E.O. (2017) How well can machine learn-
ing predict demographics of social media users?.
37. Murthy, D., Gross, A., & Pensavalle, A. (2016). Urban Social Media demographics: An explora-
tion of Twitter use in major American cities. Journal of Computer-Mediated Communication, 21(1),
33–49.
38. Nijbroek, R., & Wangui, E. (2018). What women and men want: Considering gender for successful,
sustainable land management programs. Colombo, Sri Lanka: CGIAR Research Program on Water,
Land and Ecosystems (WLE).
39. Conover, M.D., Gonçalves, B., Ratkiewicz, J., Flammini, A. & Menczer, F. (2011) Predicting the
political alignment of Twitter users. In 2011 IEEE Third Int’l Conference on Privacy, Security, Risk
and Trust and 2011 IEEE Third Int’l Conference on Social Computing, pp. 192–199.
40. Compton, R., Jurgens, D., & Allen D. (2014). Geotagging one hundred million Twitter accounts
with total variation minimization. In 2014 IEEE International Conference on Big Data, Washington
DC, USA.
41. Preoţiuc-Pietro, D., Volkova, S., Lampos, V., Bachrach, Y., & Aletras, N. (2015). Studying user
income through language, behaviour and affect in social media. PLoS One, 10(9), e0138717.
42. Volkova, S. & Yarowsky, D. (2014). Improving gender prediction of social media users via weighted
annotator rationales. In NIPS 2014 Workshop on Personalization, Montreal, Canada.
43. GLF. GLF Nairobi: Social Media Toolkit [Online]. https://events.globallandscapesforum.org/nairo
bi-2018/social-media-toolkit/. Accessed 6 June 2019.
44. Rahimi, A., Cohn, T., & Baldwin, T. (2016). Pigeo: A python geotagging tool. In Proceedings of
the 54th Annual Meeting of the Association for Computational Linguistics. (pp. 127–132), Berlin,
Germany.
45. Zagoruyko, S. and Komodakis, N. (2016). Wide residual networks.
46. Mullen, L., Blevins, C. & Schmidt, B. (2018) gender: Predict Gender from Names Using Historical
Data. R package version 0.5.2.
47. Joulin, A., Grave, E., Bojanowski, P., & Mikolov, T. (2016). Bag of tricks for efficient text classifica-
tion. In Proceedings of the 15th Conference of the European Chapter of the Association for Compu-
tational Linguistics, 2(1), 427–431. Valencia, Spain.
13You can also read