Identification of potential and novel target genes prolactinoma by bioinformatics analysis
←
→
Page content transcription
If your browser does not render page correctly, please read the page content below
AIMS Neuroscience, 8(2): 254–283.
                                                                   DOI: 10.3934/Neuroscience.2021014
                                                                   Received: 05 November 2020
                                                                   Accepted: 29 January 2021
                                                                   Published: 07 February 2021
http://www.aimspress.com/journal/aimsph

Research article

Identification of potential and novel target genes in pituitary

prolactinoma by bioinformatics analysis

Vikrant Ghatnatti1, Basavaraj Vastrad2, Swetha Patil3, Chanabasayya Vastrad4,* and
Iranna Kotturshetti5

1
    Department of Endocrinology, J N Medical College, Belagavi and KLE Academy of Higher
    Education & Research 590010, Karnataka, India
2
    Department of Biochemistry, Basaveshwar College of Pharmacy, Gadag, Karnataka 582103, India
3
    Department of Obstetrics and Gynaecology, J N Medical College, Belagavi and KLE Academy of
    Higher Education & Research 590010, Karnataka, India
4
    Biostatistics and Bioinformatics, Chanabasava Nilaya, Bharthinagar, Dharwad 580001,
    Karanataka, India
5
    Department of Ayurveda, Rajiv Gandhi Education Society’s Ayurvedic Medical College, Ron
    562209, Karanataka, India

* Correspondence: Email: channu.vastrad@gmail.com; Tel: 919480073398.

Abstract: Pituitary prolactinoma is one of the most complicated and fatally pathogenic pituitary
adenomas. Therefore, there is an urgent need to improve our understanding of the underlying
molecular mechanism that drives the initiation, progression, and metastasis of pituitary prolactinoma.
The aim of the present study was to identify the key genes and signaling pathways associated with
pituitary prolactinoma using bioinformatics analysis. Transcriptome microarray dataset GSE119063
was downloaded from Gene Expression Omnibus (GEO) database. Limma package in R software
was used to screen DEGs. Pathway and Gene ontology (GO) enrichment analysis were conducted to
identify the biological role of DEGs. A protein-protein interaction (PPI) network was constructed
and analyzed by using HIPPIE database and Cytoscape software. Module analyses was performed. In
addition, a target gene‐miRNA regulatory network and target gene‐TF regulatory network were
constructed by using NetworkAnalyst and Cytoscape software. Finally, validation of hub genes by
receiver operating characteristic (ROC) curve analysis. A total of 989 DEGs were identified,
including 461 up regulated genes and 528 down regulated genes. Pathway enrichment analysis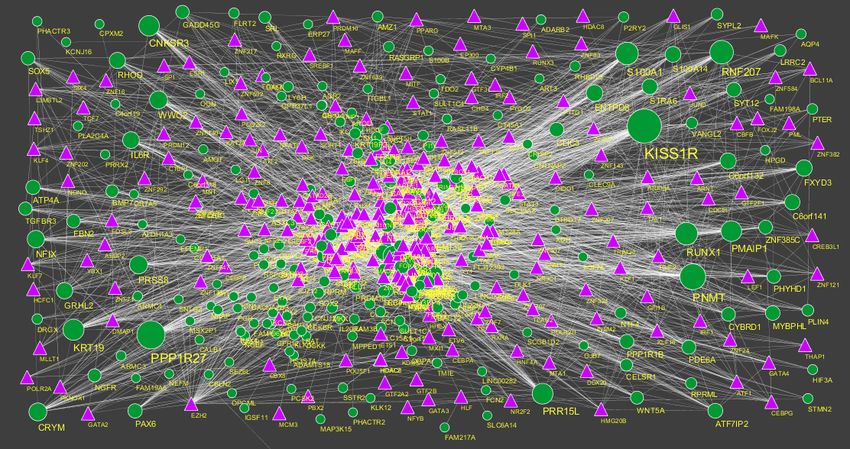
255

showed that the DEGs were significantly enriched in the retinoate biosynthesis II, signaling
pathways regulating pluripotency of stem cells, ALK2 signaling events, vitamin D3 biosynthesis, cell
cycle and aurora B signaling. Gene Ontology (GO) enrichment analysis showed that the DEGs were
significantly enriched in the sensory organ morphogenesis, extracellular matrix, hormone activity,
nuclear division, condensed chromosome and microtubule binding. In the PPI network and modules,
SOX2, PRSS45, CLTC, PLK1, B4GALT6, RUNX1 and GTSE1 were considered as hub genes. In
the target gene‐miRNA regulatory network and target gene‐TF regulatory network, LINC00598,
SOX4, IRX1 and UNC13A were considered as hub genes. Using integrated bioinformatics analysis,
we identified candidate genes in pituitary prolactinoma, which might improve our understanding of
the molecular mechanisms of pituitary prolactinoma.

Keywords: pituitary prolactinoma; differentially expressed genes; gene ontology; pathway
enrichment analysis; protein-protein interactions

Abbreviations: BioGRID: Biological General Repository for Interaction Datasets; BP: biological
process; CC: cellular component; DEGs: Differentially Expressed Genes; GEO: Gene Expression
Omnibus; GO: Gene ontology; HIPPIE; Human Integrated Protein-Protein Interaction rEference;
KEGG: Kyoto Encyclopedia of Genes and Genomes; MF: molecular function; SMPDB: Small
Molecule Pathway Database

1. Introduction

     Prolactinoma is named as prolactin secreting pituitary adenoma seen more frequently in women and
is characterized by irregular menstrual, erectile dysfunction, eye problems and loss of sexual function [1].
Signs and symptoms include amenorrhoea, glactorrhoea, headache, anaemia and hypertension [2].
Prolactinoma involves 20.7% among other pituitary adenomas [3]. Although treatment methods,
including surgery [4], chemotherapy [5] and radiotherapy [6] are improving, overall survival rate remains
lower. Consequently, elucidating the molecular mechanism associated in the pituitary prolactinoma is
essential for the improvement of efficacious diagnosis and treatment strategies.
     Presently, a wealth of previous studies has been enforced to advance a better understanding of
the molecular mechanisms of pituitary prolactinoma. One study showed that allelic loss of DRD2
was responsible for development of pituitary prolactinoma [7]. Elevated expression of HMGA1 and
HMGA2 were responsible for progression of pituitary prolactinoma [8,9]. BMP4 was associated with
progression of pituitary prolactinoma [10]. FGF4 was responsible for improvement of pituitary
prolactinoma through invasion and cell proliferation [11]. Alteration in oncogene GNAS was
important for progression of pituitary prolactinoma [12]. Stimulation of Raf/MEK/ERK and
PI3K/Akt/mTOR signaling pathways were linked with development of prolactinoma [13]. Abnormal
expression of CTNNB1 was involved in progression of prolactinoma [14]. Epigenetic inactivation of
CDKN2A was responsible for advancement of prolactinoma [15]. AIP play key role in pathogenesis
of pituitary prolactinoma [16]. Hence, searching for specific and sensitive molecular marker as well
as some core genes or proteins will benefit the diagnosis and treatment of pituitary prolactinoma.

AIMS Neuroscience                                                                 Volume 8, Issue 2, 254–283.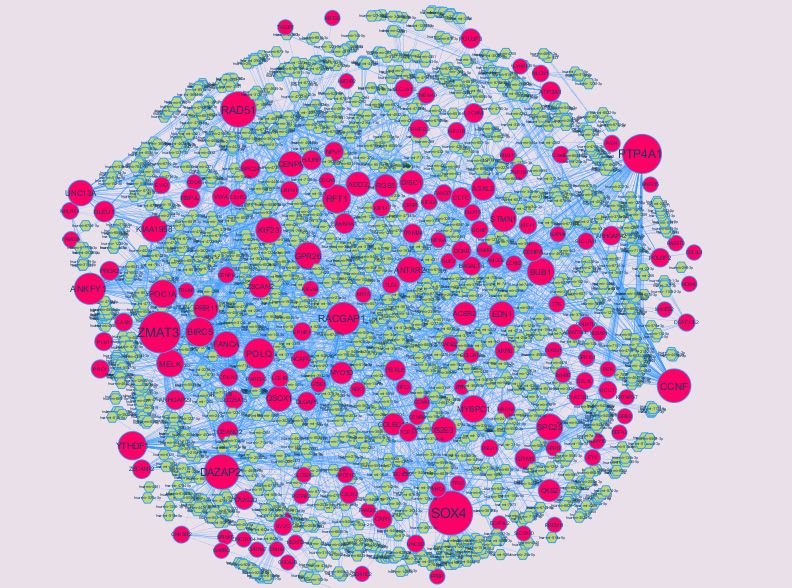
256

     At current study, microarray analyses have been applied for medical research [17]. In this
analysis, we chose GSE119063 dataset from Gene Expression Omnibus (GEO) (http://
www.ncbi.nlm.nih.gov/geo/) and used limma bioconductor package to find the differentially
expressed genes (DEGs). Subsequently, we made pathway enrichment and gene ontology (biological
process (BP), molecular function (MF), cellular component (CC) analyses were performed. In
addition, we constructed and analyzed PPI network of the DEGs and selected core genes with a high
degree of connectivity, high betweenness centrality, high stress centrality, high closeness centrality
and low clustering coefficient, and modules analysis were performed. Moreover, miRNA-target gene
regulatory network and TF-target gene regulatory network were constructed and analyzed. Finally, hub
genes are validated by receiver operating characteristic (ROC) curve analysis. Briefly, this study would
provide novel targets for diagnosis, prognosis and treatment of pituitary prolactinoma.

2.   Materials

2.1. Microarray data

     We chose a gene expression profile of GSE119063 from GEO database. GSE119063 was based on
the Agilent GPL13607 platform (Agilent-028004 SurePrint G3 Human GE 8x60K Microarray (Feature
Number version). The GSE119063 dataset included 9 samples, containing 5 pituitary prolactinoma
samples and 4 normal pituitaries samples. Besides, we downloaded the Series Matrix File of GSE119063
from GEO database.

2.2. Data preprocessing

     The raw data used in this study were downloaded. The raw GSE119063 data was preprocessed by
the Limma package (http://www.bioconductor.org/packages/release/bioc/html/limma.html) [18] in
Bioconductor. The data preprocessing included background correction and quantile normalization. Probe
identities (IDs) are mapped to gene IDs using the corresponding platform files.

2.3. Identification of DEGs

      The Limma package was subsequently used for identifying DEGs. P < 0.05 and absolute fold
change ≥0.93 for up regulated gene and fold change ≥−0.29 for down regulated gene [19] were
considered as the cutoff values for DEG screening using the Benjamini & Hochberg procedure. R
software was used to produce heat maps of common significant differentially expressed genes between
pituitary prolactinoma samples and normal pituitaries samples. Genes are ordered according to the fold
change in the expression values. This information was presented as a heat map and a volcano plot.

2.4. Pathway enrichment analysis of DEGs

     BIOCYC (https://biocyc.org/) [20], Kyoto Encyclopedia of Genes and Genomes (KEGG)
(http://www.genome.jp/kegg/pathway.html) [21], Pathway Interaction Database (PID)
(https://wiki.nci.nih.gov/pages/viewpage.action?pageId=315491760)  [22],    REACTOME

AIMS Neuroscience                                                              Volume 8, Issue 2, 254–283.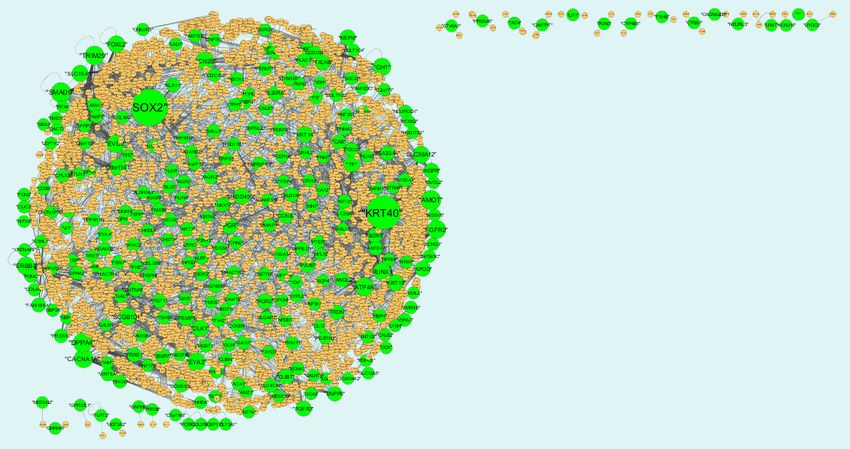
257

(https://reactome.org/) [23], GenMAPP (http://www.genmapp.org/) [24], MSigDB C2 BIOCARTA
(http://software.broadinstitute.org/gsea/msigdb/collections.jsp)          [25],         PantherDB
(http://www.pantherdb.org/)                  [26],                Pathway                 Ontology
(http://www.obofoundry.org/ontology/pw.html) [27] and Small Molecule Pathway Database
(SMPDB) (http://smpdb.ca/) [28] were a collection of databases which helps to handle genomes,
biological     pathways,      diseases,   chemical      substances,    and      drugs.   ToppGene
(https://toppgene.cchmc.org/enrichment.jsp) is a web-based online bioinformatics resource that
aims to provide tools for the functional interpretation of large lists of genes or proteins [29]. P
value < 0.05 is regarded as the cutoff criterion. We could visualize the pathways among those
DEGs using ToppGene.

2.5. Gene Ontology (GO) enrichment analysis of DEGs

     Gene ontology (GO) (http://www.geneontology.org/) enrichment analysis served as a useful
approach to annotate genes and gene products and also analyze characteristic biological attributing to
high-throughput         genome          or        transcriptome         data        [30].       ToppGene
(https://toppgene.cchmc.org/enrichment.jsp) is a web-based online bioinformatics resource that aims to
provide tools for the functional interpretation of large lists of genes or proteins [29]. P value < 0.05 is
regarded as the cutoff criterion. We could visualize the core biological process (BP), molecular function
(MF) and cellular component (CC) among those DEGs using ToppGene.

2.6. PPI network construction and topology analysis

      The Human Integrated Protein-Protein Interaction rEference (HIPPIE) (http://cbdm.uni-
mainz.de/hippie/) is an online tool providing experimental and predicted PPI information [31]
through interfacing different data bases such as IntAct Molecular Interaction Database
(https://www.ebi.ac.uk/intact/) [32], Biological General Repository for Interaction Datasets
(BioGRID) (https://thebiogrid.org/) [33], The Human Protein Reference Database (HPRD)
(http://www.hprd.org/)       [34],    the      Molecular      INTeraction       database       (MINT)
(https://mint.bio.uniroma2.it/) [35], The Biomolecular Interaction Network Database (BIND)
(http://baderlab.org/BINDTranslation) [36], MIPS (http://mips.helmholtz-muenchen.de/proj/ppi/) [37]
and DIP (http://dip.doe-mbi.ucla.edu/dip/Main.cgi) [38]. In this study, the HIPPIE [31] was used to
analyze the PPIs among the proteins encoded by the DEGs, then the PPI networks for the up-
regulated and the down-regulated genes are separately visualized by Cytoscape version 3.5.1
software (http://www.cytoscape.org/) [39]. The degree of a gene in a PPI network is equal to the
number of edges containing that node [40]. Betweenness centrality of a gene which is located on the
shortest path between two other genes has most influence over the “information transfer” between
them [41]. Stress centrality is number of genes in the shortest path between two other genes [42].
Closeness centrality is an inverse of the average length of the shortest paths to/from all the other
genes in the PPI network [43]. Cluster coefficient measures the density of interactions in the network
neighborhood of a gene [44].

AIMS Neuroscience                                                                Volume 8, Issue 2, 254–283.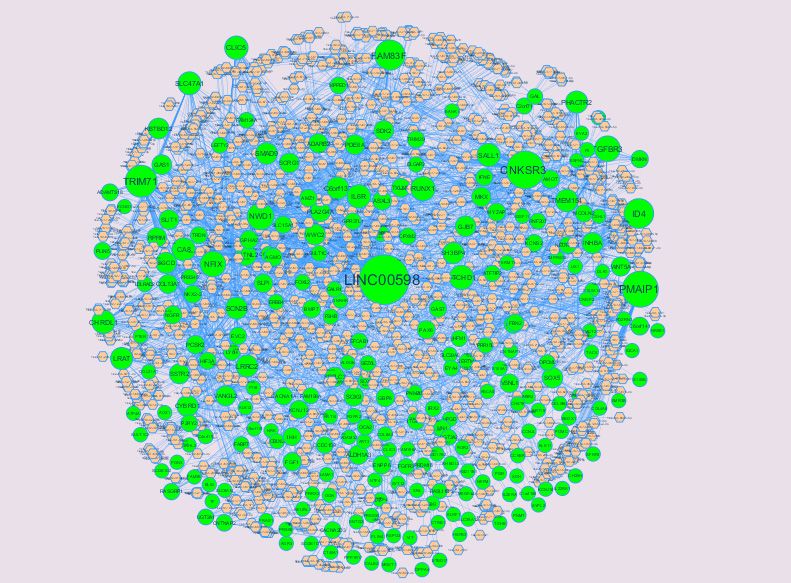
258

2.7. Module analysis

     In PPI networks, genes in the same module typically show the same or similar function and work
together to implement their biological function. To visualize the network and identify the modules in the
network, PEWCC1 java plug-in [45] on the Cytospace software (www.cytoscape.org/) [39] was used.
The parameters were set as follows: Degree cutoff ≥ 10 (degrees of each node in module were at least
larger than 2), K‐core ≥ 2 (subgraphs of each node in module were at least 2 and more than 2).

2.8. Construction of the target gene-miRNA regulatory network

     The NetworkAnalyst (http://www.networkanalyst.ca/) is a online tool available comprehensive
resource containing the predicted and the experimentally validated target gene-miRNA interaction
pairs [46]. The DEGs‐associated predicted miRNA were selected when they were included two
TarBase (http://diana.imis.athena-innovation.gr/DianaTools/index.php?r=tarbase/index) [47] and
miRTarBase (http://mirtarbase.mbc.nctu.edu.tw/php/download.php) [48]. Subsequently, the
overlapping target genes were identified and the gene-miRNA pair was selected. The target
gene‐miRNA regulatory network was constructed and visualized using the Cytoscape version 3.5.1
software (http://www.cytoscape.org/) [39].

2.9. Construction of the target gene-regulatory TF network

     The DEGs and transcription factors (TFs) that potentially regulated the DEGs are predicted
using     Overrepresentation      Enrichment    Analysis      (ORA)       in   NetworkAnalyst
(http://www.networkanalyst.ca/) [49]. The DEGs‐associated predicted TF were selected when they
were included database such as ENCODE (http://cistrome.org/BETA/) [50]. Then target gene-
regulatory TF network was constructed and visualized using version 3.5.1 software
(http://www.cytoscape.org/) [39].

2.10. Receiver operating characteristic (ROC) curve analysis

     Receiver operating characteristic (ROC) curve analysis was executed to calculate the sensitivity and
specificity of the DEGs for pituitary prolactinoma diagnosis using the pROC package in R software [51].
An area under the curve (AUC) value was calculated and used to designate the ROC effect.

3.   Results

3.1. Identification of DEGs

     After data preprocessing, the raw data of nine samples is proved to be eligible (Figure 1). The
GSE119063 expression profile data from GEO was investigated to screen for DEGs between the
prolactinoma and normal groups. Under the threshold of FDR < 0.05, and fold change ≥0.93 for up
regulated gene and fold change ≥−0.29 for down regulated gene. Comparison of prolactinoma with
normal pituitaries identified total of 989 DEGs, including 461 up regulated genes and 528 down

AIMS Neuroscience                                                               Volume 8, Issue 2, 254–283.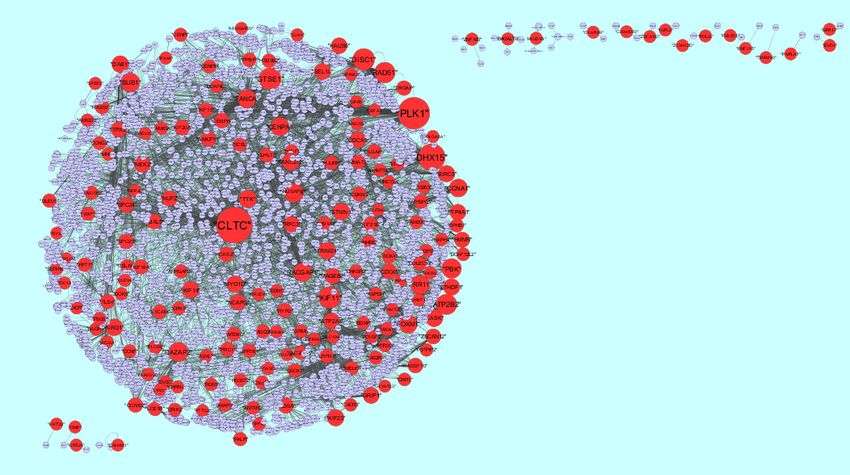
259

regulated genes, were revealed (Table 1, see the supplementary). A corresponding heat map is shown
in Figure 2 and Figure 3. All the DEGs were presented by volcano plot in the study (Figure 4).

3.2. Pathway enrichment analysis of DEGs

     Several significant enriched pathways are acquired through BIOCYC, KEGG, PID,
REACTOME, GenMAPP, MSigDB C2 BIOCARTA, PantherDB, Pathway Ontology and SMPDB
pathway enrichment analysis (Table 2 and Table 3, see the supplementary). The top enriched
pathways for up regulated genes included retinoate biosynthesis II, retinoate biosynthesis I, signaling
pathways regulating pluripotency of stem cells, neuroactive ligand-receptor interaction, ALK2
signaling events, BMP receptor signaling, peptide hormone biosynthesis, glycoprotein hormones,
tyrosine metabolism, androgen and estrogen metabolism, ensemble of genes encoding extracellular
matrix and extracellular matrix-associated proteins, genes encoding secreted soluble factors, adenine
and hypoxanthine salvage pathway, 5-Hydroxytryptamine biosynthesis, melanocortin system,
androgen and estrogen metabolic, tryptophan metabolism and xanthine dehydrogenase deficiency
(Xanthinuria). Meanwhile, down regulated DEGs strikingly enriched in vitamin D3 biosynthesis, cell
cycle, pancreatic secretion, aurora B signaling, FOXM1 transcription factor network, mitotic
prometaphase, resolution of sister chromatid cohesion, role of ran in mitotic spindle regulation, Eph
kinases and ephrins support platelet aggregation, inflammation mediated by chemokine and cytokine
signaling pathway, o-glycans biosynthetic, ganglioside biosynthetic, eptifibatide pathway and
ticlopidine pathway.

      Figure 1. Box plots of the gene expression data before and after normalization.
      Horizontal axis represents the sample symbol and the vertical axis represents the gene
      expression values. The black line in the box plot represents the median value of gene
      expression. (A1, A2, A3, A4 = normal pituitaries samples; B1, B2, B3, B4, B5 = 5
      pituitary prolactinoma).

AIMS Neuroscience                                                             Volume 8, Issue 2, 254–283.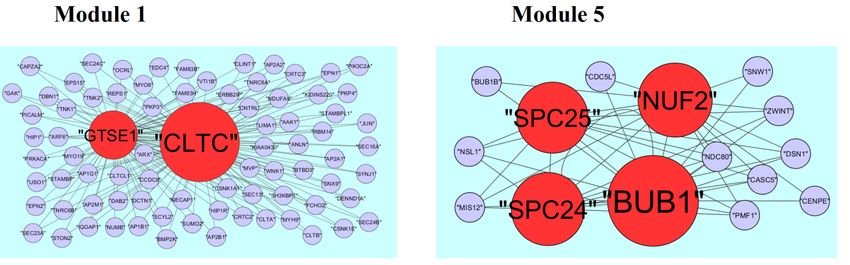
260

      Figure 2. Heat map of up regulated differentially expressed genes. Legend on the top left
      indicate log fold change of genes. (A1, A2, A3, A4 = normal pituitaries samples; B1, B2,
      B3, B4, B5 = 5 pituitary prolactinoma).

AIMS Neuroscience                                                           Volume 8, Issue 2, 254–283.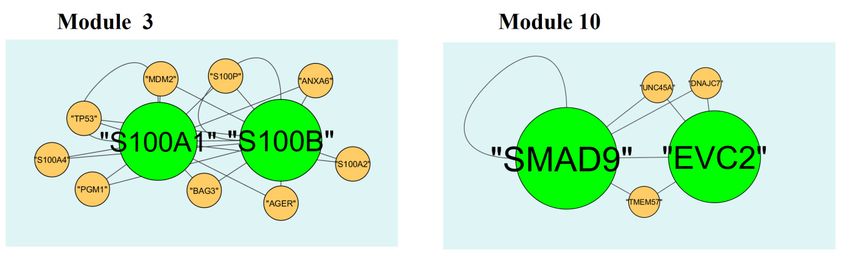
261

      Figure 3. Heat map of down regulated differentially expressed genes. Legend on the top
      left indicate log fold change of genes. (A1, A2, A3, A4 = normal pituitaries samples; B1,
      B2, B3, B4, B5 = 5 pituitary prolactinoma).

      Figure 4. Volcano plot of differentially expressed genes. Genes with a significant change
      of more than two-fold were selected.

AIMS Neuroscience                                                            Volume 8, Issue 2, 254–283.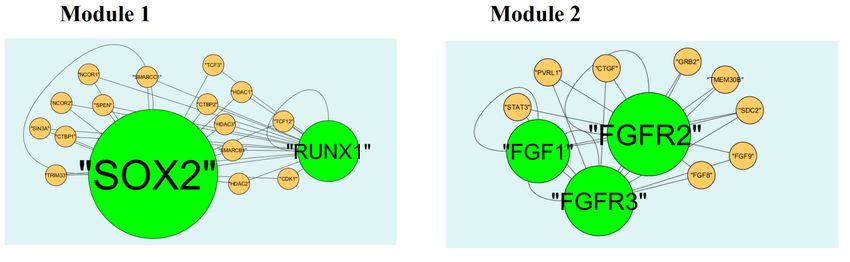
262

3.3. Gene Ontology (GO) enrichment analysis of DEGs

     All significant DEGs were divided into up regulated genes and down regulated genes. GO
categories analyses are conducted for these 2 lists of genes, respectively. Results of GO categories
are presented by 3 functional groups, which are group BP, CC, and MF (Table 4 and Table 5, see the
supplementary). In group BP, up and down regulated DEGs are significantly enriched in sensory
organ morphogenesis, embryonic organ morphogenesis, nuclear division and organelle fission. For
group CC, up and down regulated DEGs mainly enriched in extracellular matrix and extracellular
space, condensed chromosome and kinetochore. In addition, GO results of group MF showed that up
and down regulated DEGs mainly enriched in hormone activity, signaling receptor binding,
microtubule binding and microtubule motor activity.

3.4. PPI network construction and topology analysis

     PPI networks were constructed on the basis of HIPPIE online tool. We also analyzed the
network properties such as node degree, betweenness centrality, stress centrality, closeness centrality
and cluster coefficient. The PPI network for up regulated DEGs is shown in Figure 5, which has
4005 nodes and 5562 interactions. The top 5 nodes with greater degrees are listed in Table 6 (see the
supplementary), including SOX2 (degree = 355), KRT40 (degree = 313), SMAD9 (degree = 114),
AMOT (degree = 111) and DPPA4 (degree = 105). R square and correlation coefficient are 0.776
and 0.966, respectively (Figure 6A). Top 5 up regulated genes with high betweenness centrality are
SOX2 (betweeness = 0.20715558), KRT40 (betweeness = 0.15884752), SMAD9 (betweeness =
0.07865032), AMOT (betweeness = 0.06814966) and TRIM29 (betweeness = 0.0613444) shown in
Table 6. R square and correlation coefficient are 0.474 and 0.098, respectively (Figure 7A). Top 5 up
regulated high stress genes are SOX2 (stress = 37524600), KRT40 (stress = 22565808), AMOT
(stress = 13889668), C6orf141 (stress = 9207512) and TRIM29 (stress = 9041322) shown in Table
6. R square and correlation coefficient are 0.088 and 0.072, respectively (Figure 7B). Top 5 up
regulated gene with high closeness centrality are SOX2 (closeness = 0.31817447), KRT40
(closeness = 0.30482897), SMAD9 (closeness = 0.30309326), TRIM29 (closeness = 0.2975525)
and FGFR2 (closeness = 0.29117386) shown in Table 6. R square and correlation coefficient are
0.036 and 0.082, respectively (Figure 7C). Top 5 up regulated gene with low clustering coefficient
are PRSS45 (clustering coefficient = 0), CARTPT (clustering coefficient = 0), TAC4 (clustering
coefficient = 0), CT45A1 (clustering coefficient = 0) and PON3 (clustering coefficient = 0) shown
in Table 6. R square and correlation coefficient are 0.616 and 0.882, respectively (Figure 7D).
     The PPI network for down regulated DEGs is shown in Figure 8, which has 5441 nodes and
9866 interactions. The top 5 nodes with grater degrees are listed in Table 6, including CLTC
(degree = 333), PLK1 (degree = 276), DHX15 (degree = 208), GTSE1 (degree = 141) and DISC1
(degree = 138). R square and correlation coefficient are 0.756 and 0.955, respectively (Figure 6B).
Top 5 down regulated genes with high betweenness centrality are CLTC (betweeness = 0.17279707),
PLK1 (betweeness = 0.16393694), DHX15 (betweeness = 0.09387272), KIF11 (betweeness =
0.05972209) and ATP2B2 (betweeness = 0.0557287) shown in Table 6. R square and correlation
coefficient are 0.596 and 0.119, respectively (Figure 9A). Top 5 down regulated genes with high
stress genes are CLTC (stress = 59969246), DHX15 (stress = 39966314), PLK1 (stress = 39488508),

AIMS Neuroscience                                                             Volume 8, Issue 2, 254–283.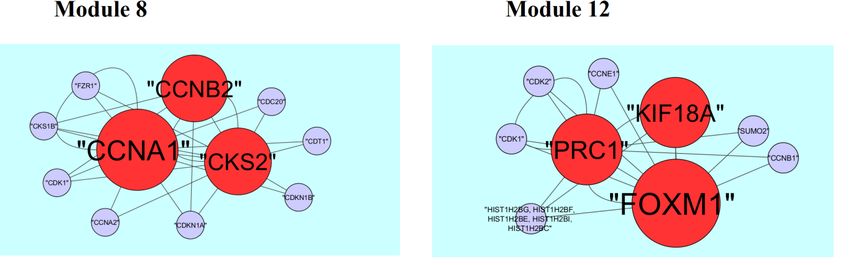
263

ATP2B3 (stress = 23062588) and KIF11 (stress = 17181634) shown in Table 6. R square and
correlation coefficient are 0.371 and 0.004, respectively (Figure 9B). Top 5 down regulated genes
with high closeness centrality are PLK1 (closeness = 0.35244041), CLTC (closeness = 0.34583256),
ATP2B4 (closeness = 0.33762233), ATP2B8 (closeness = 0.32332523) and DHX15 (closeness =
0.32084733) shown in Table 6. R square and correlation coefficient are 0.081 and 0.144, respectively
(Figure 9C). Top 5 up regulated gene with low clustering coefficient are B4GALT6 (clustering
coefficient = 0), ZNF160 (clustering coefficient = 0), HIGD1B (clustering coefficient = 0), CCL3L3
(clustering coefficient = 0) and C20orf203 (clustering coefficient = 0) shown in Table 6. R square
and correlation coefficient are 0.569 and 0.860, respectively (Figure 9D).

3.5. Module analysis

     A total of 332 modules are identified in up regulated PPI network, among which the best are
module 1, module 2, module 3 and module 10 (Figure 10). Module 1 is composed of 17 nodes and
33 edges. The hub proteins in this module such as RUNX1 (degree = 79) and SOX2 (degree = 355)
are involved in module 1. Module 2 is composed of 11 nodes and 23 edges. The hub proteins in this
module such as FGFR2 (degree = 93), FGF1 (degree = 27) and FGFR3 (degree = 49) are involved in
module 2. Module 3 is composed of 11 nodes and 21 edges. The hub proteins in this module such as
S100B (degree = 33) and S100A1 (degree = 23) are involved in module 3. Module 10 is composed
of 5 nodes and 8 edges. The hub proteins in this module such as SMAD9 (degree = 114) and EVC2
(degree = 86) are involved in module 10.
     A total of 425 modules are identified in down regulated PPI network, among which the best are
module 1, module 5, module 8 and module 12 (Figure 11). Module 1 is composed of 80 nodes and
157 edges. The hub proteins in this module such as CLTC (degree = 333) and GTSE1 (degree = 141)
are involved in module 1. Module 5 is composed of 15 nodes and 43 edges. The hub proteins in this
module such as NUF2 (degree = 44), BUB1 (degree = 95), SPC24 (degree = 41) and SPC25
(degree = 35) are involved in module 5. Module 8 is composed of 11 nodes and 23 edges. The hub
proteins in this module such as CKS2 (degree = 36), CCNB2 (degree = 36) and CCNA1 (degree =
83) are involved in module 8. Module 12 is composed of 9 nodes and 17 edges. The hub proteins
in this module such as KIF18A (degree = 27), FOXM1 (degree = 80) and PRC1 (degree = 29) are
involved in module 12.

3.6. Construction of the target gene‐miRNA network

     The miRNAs that may control the DEGs are diagnosed based on the up and down regulation
expressions (Figure 12 and Figure 13). Top 5 up regulated targeted genes such as LINC00598
regulated by 209 miRNAs, CNKSR3 regulated by 138 miRNAs, PMAIP1 regulated by 128 miRNAs,
TRIM71 regulated by 104 miRNAs and FAM83F regulated by 94 miRNAs are given in Table 7 (see
the supplementary). Top 5 down regulated targeted genes such as SOX4 regulated by 160 miRNAs,
ZMAT3 regulated by 145 miRNAs, PTP4A1 regulated by 132 miRNAs, RAD51 regulated by 113
miRNAs and DAZAP2 regulated by 109 miRNAs are given in Table 7.

AIMS Neuroscience                                                           Volume 8, Issue 2, 254–283.
264
3.7. Construction of the target gene‐TF network
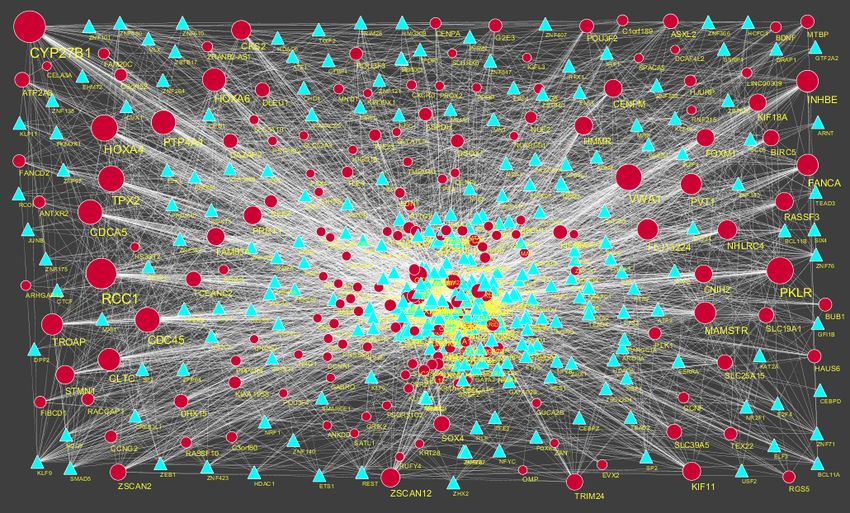
The TFs for target up and down regulated genes are shown in Figure 14 and Figure 15,
respectively. Top 5 up regulated targeted genes such as IRX1 regulated by 73 TFs, CACNA2D3
regulated by 30 TFs, VSNL1 regulated by 29 TFs, BMP7 regulated by 28 TFs and DACT2 regulated
by 27 TFs are given in Table 8 (see the supplementary). Top 5 down regulated targeted genes such as
UNC13A regulated by 43 TFs, CCNF regulated by 35 TFs, BDNF regulated by 34 TFs, POU3F4
regulated by 34 TFs and AKAP3 regulated by 31 TFs are given in Table 8.
3.8. Receiver operating characteristic (ROC) curve analysis
As these 10 hub genes are prominently expressed in pituitary prolactinoma, we performed a
ROC curve analysis to evaluate their sensitivity and specificity for the diagnosis of pituitary
prolactinoma. As shown in Figure 16, SOX2, PRSS45, CLTC, PLK1, B4GALT6, RUNX1, GTSE1,
SOX4, IRX1 and UNC13A achieved an AUC value of >0.9, demonstrating that these genes have
high sensitivity and specificity for pituitary prolactinoma diagnosis. The results suggested that SOX2,
PRSS45, CLTC, PLK1, B4GALT6, RUNX1, GTSE1, SOX4, IRX1 and UNC13A can be used as
biomarkers for the diagnosis of pituitary prolactinoma.
Figure 5. Protein-protein interaction network of differentially expressed genes (DEGs).
Green nodes denotes up regulated genes.
AIMS Neuroscience Volume 8, Issue 2, 254–283.265
Figure 6. Node degree distribution (A: Up regulated genes; B: Down regulated genes).
Figure 7. Regression diagrams for up regulated genes (A: Betweenness centrality; B:
Stress centrality; C: Closeness centrality; D: Clustering coefficient).
AIMS Neuroscience Volume 8, Issue 2, 254–283.266
Figure 8. Protein-protein interaction network of differentially expressed genes (DEGs).
Red nodes denotes up regulated genes.
Figure 9. Regression diagrams for down regulated genes (A: Betweenness centrality; B:
Stress centrality; C: Closeness centrality; D: Clustering coefficient).
AIMS Neuroscience Volume 8, Issue 2, 254–283.267
Figure 10. Modules in PPI network. The green nodes denote the up-regulated genes.
Figure 11. Modules in PPI network. The red nodes denote the down-regulated genes.
AIMS Neuroscience Volume 8, Issue 2, 254–283.268
Figure 12. The network of up-regulated DEGs and their related miRNAs. The green
circles nodes are the up regulated DEGs and pinkiamond nodes are the miRNAs.
Figure 13. The network of up-regulated DEGs and their related miRNAs. The pink
circles nodes are the up regulated DEGs and yellow diamond nodes are the miRNAs.
AIMS Neuroscience Volume 8, Issue 2, 254–283.269
Figure 14. TF-gene network of predicted target up regulated genes. (Purple triangle-TFs
and green circles-target up regulated genes).
Figure 15. TF-gene network of predicted target up regulated genes. (Sky blue triangle-
TFs and red circles-target up regulated genes).
AIMS Neuroscience Volume 8, Issue 2, 254–283.270
Figure 16. ROC curve analyses of hub genes. A) SOX2; B) PRSS45; C) CLTC; D)
PLK1; E) B4GALT6; F) RUNX1; G) GTSE1; H) SOX4; I) IRX1; J) UNC13A.
4. Discussion
A molecular understanding of pituitary prolactinoma is particularly essential to eventually
improve effective approaches for its control, treatment, and prevention. In the present study,
important candidate genes of pituitary prolactinoma were identified by bioinformatics analysis. We
downloaded the gene expression data from GSE119063 and obtained 461 up regulated and 528 down
regulated genes in pituitary prolactinoma. SALL1 action as a tumor suppressor and epigenetic
inactivation of this gene is responsible for development of cancer [52], but this gene might be liable
for pituitary prolactinoma. Wang et al. [53] showed that expression of homeodomain transcription
factor NKX2-2 is linked with progression of neuro endocrine tumor, but this gene might be the key
for progression of pituitary prolactinoma. High expression of pleiotropic signaling molecule BMP7
controls proliferation, migration, and invasion of cancer cells [54], but this gene might be linked with
proliferation, migration, and invasion of pituitary prolactinoma cells. Cipriano et al. [55] identified
that ontogeny FAM83F is associated with epithelial cell transformation in cancer, but involvement of
this gene might be responsible for advancement of pituitary prolactinoma. Oncogene GRHL2 is a
transcriptional controller of proliferation and differentiation in epithelial cells, both during
progression and tumor development, but this gene might be linked with proliferation of pituitary
prolactinoma cells [56]. TRIM24 play key role in proliferation and invasion of cancer cells [57], but
high expression of this gene might be responsible for invasion of pituitary prolactinoma cells.
Kaistha et al. [58] describe that high expression of dual specificity kinase TTK shows proliferative
potential of cancer cells, but this gene might be linked with proliferation of pituitary prolactinoma
cells. Over expression of TOP2A is responsible for growth of cancer [59], but increase expression of
this gene might associate with growth of pituitary prolactinoma. Potential role KIF18A is associated
with cell division and checkpoint activation in cancer progression [60], but this gene might be
responsible for cell division and checkpoint activation in pituitary prolactinoma. Over expression of
microtubule associated protein TPX2 stimulates the cell cycle in cancer [61], but this gene might be
activates cell cycle in pituitary prolactinoma. Genes such as FGFR2 [62], SOX2 [63], POMC
AIMS Neuroscience Volume 8, Issue 2, 254–283.271
(proopiomelanocortin) [64], FSHB (follicle stimulating hormone beta subunit) [65], EFEMP1 [66],
SFRP2 [67], CSH2 [68], IHH (indian hedgehog) [69], GH1 [70], PTTG2 [71], CCNB2 [72],
RACGAP1 [73], CXCR2 [74], CXCR3 [75], FOXL2 [76], RUNX2 [77], TF (transferrin) [78], CCK
(cholecystokinin) [79], DPPA4 [80], RUNX1 [81] and BDNF (brain derived neurotrophic factor) [82]
are associated with progression of pituitary prolactinoma.
In present study indicated that retinoate biosynthesis II is the most significant BIOCYC
pathway for up regulated genes. XDH and RBP4 are novel biomarkers for pathogenesis of pituitary
prolactinoma. Signaling pathways regulating pluripotency of stem cells is the most significant
KEGG pathway for up regulated genes. Alteration in FGFR3 is responsible for progression of
bladder cancer [83], but this gene might be important for development of pituitary prolactinoma.
WNT5A was linked with invasion of cancer cells [84], but this gene might be involved in invasion of
pituitary prolactinoma cells. ID4 is potential tumor suppressor and epigenetic inactivation of this
gene linked with progression of prostate cancer [85], but loss gene this might be liable for
advancement of pituitary prolactinoma. High expression of INHBA (inhibin beta A subunit) linked
with cell proliferation in lung adenocarcinoma [86], but this gene might be associated with cell
proliferation in pituitary prolactinoma. Epigenetic inactivation of PAX6 gene was liable for
progression of breast cancer [87], but loss this gene might be culpable for progression of pituitary
prolactinoma. LEFTY2 and SMAD9 are novel biomarkers for pathogenesis of pituitary prolactinoma.
ALK2 signaling events are the most significant PID pathway for up regulated genes. Peptide
hormone biosynthesis is the most significant REACTOME pathway for up-regulated genes. CGB3
and TSHB are novel biomarkers for pathogenesis of pituitary prolactinoma. Tyrosine metabolism
was the most significant GenMAPP pathway for up regulated genes. Duan et al. [88] showed that
ALDH1A3 play a regulatory role in the initiation and development of cancer, but this gene might be
linked with pathogenesis of pituitary prolactinoma. PNMT and AOX1 are novel biomarkers for
pathogenesis of pituitary prolactinoma. Ensemble of genes encoding extracellular matrix and
extracellular matrix-associated proteins is the most significant MSigDB C2 BIOCARTA pathway for
up regulated genes. S100A14 is a modulator of HER2 signaling pathway in breast cancer [89], but
this gene might be responsible for development of pituitary prolactinoma. DeRycke et al. [90] found
that high expression of S100A1 is identified with ovarian cancer, but this gene might be important
for progression of pituitary prolactinoma. Harpio and Einarsson [91] identified that high level of
S100B is answerable for development of melanoma, but this gene might be identified with pituitary
prolactinoma. Methylation inactivation of FBN2 was associated with invasion and metastasis of non-
small cell lung cancer [92], but loss of this gene might be involved in pathogenesis of pituitary
prolactinoma. Yoshimura et al. [93] reported that FGF1 is an inducer of angiogenesis in breast cancer,
but this gene might associated with angiogenesis in pituitary prolactinoma. SLIT1 is tumor
suppressor gene and epigenetic suppression of this gene is associated with cancer progression [94],
but loss of this gene might be culpable for development pituitary prolactinoma. ADAMTS18 and
CHRDL1 are putative tumor suppressor genes and epigenetic silencing of these genes diagnosed
with various cancer types [95-96], but inactivation of these genes might be linked with progression
of pituitary prolactinoma. VIT, MFAP4, FCN2, SBSPON, SPON1, ITIH6, COL4A6, COL8A2,
FRAS1, COL13A1, ITLN1, ADAM32, CSH1, CSHL1, SLPI, IFNE, MEGF11, LAMA1, ITIH2,
GH2, COL21A1, CLEC9A, NTF4, OGN, RSPO3, MEGF6, CBLN2 and LGI1 are novel biomarkers
for pathogenesis of pituitary prolactinoma. Adenine and hypoxanthine salvage pathway is the most
AIMS Neuroscience Volume 8, Issue 2, 254–283.272
significant PantherDB pathway for up-regulated genes. Melanocortin system is the most significant
Pathway Ontology for up-regulated genes. PCSK2 is novel biomarker for pathogenesis of pituitary
prolactinoma. Tryptophan metabolism is the most significant PantherDB pathway for up-regulated
genes. TDO2 and TPH1 are novel biomarkers for pathogenesis of pituitary prolactinoma. Vitamin
D3 biosynthesis is the most significant BIOCYC pathway for down-regulated genes. Polymorphisms
of CYP27B1 is responsible for progression of colon cancer [97], but this polymorphic gene might be
responsible for growth of pituitary prolactinoma. Cell cycle is the most significant KEGG pathway
for down-regulated genes. PLK1 is linked with proliferation of cancer cells [98], but this might be
gene is liable for proliferation of pituitary prolactinoma. Mitotic spindle checkpoint gene BUB1 is
linked with proliferation of gastric cancer cells [99], but this gene might be responsible for
proliferation of pituitary prolactinoma cells. Epigenetic inactivation of CCNA1 is responsible for
advancement of cervical cancer [100], but silencing of this gene might be responsible for progression
of pituitary prolactinoma. CDC45 is novel biomarker for pathogenesis of pituitary prolactinoma.
Aurora B signaling is the most significant PID pathway for down-regulated genes. KIF23 plays key
role in progression of lung cancer [101], but this gene might play crucial role in pituitary
prolactinoma. BIRC5 play key role in cell division and proliferation of liver cancer cells [102], but
this gene might be linked with cell division and proliferation in pituitary prolactinoma. NCAPG
associated with cell proliferation and migration of liver cancer cells [103], but this gene might be
linked with cell proliferation and migration of pituitary prolactinoma cells. Nie et al. [104] suggest
that STMN1 play essential role in the control of cellular division and proliferation in non-small cell
lung cancer, but this gene might be linked with cellular division and proliferation in pituitary
prolactinoma. KIF20A is associated with progression of pancreatic cancer [105], but this gene might
be play key role in progression of pituitary prolactinoma. CENPA and KLHL13 are novel
biomarkers for pathogenesis of pituitary prolactinoma. Mitotic prometaphase is the most significant
REACTOME pathway for down-regulated genes. SPC24 and SPC25 are associated with genomic
instability and disrupted regulation of cell cycle in lung cancer, but this gene might be responsible
for progression of pituitary prolactinoma [106]. Cell cycle marker CENPH pay key role in
proliferation of gastric cancer cells [107], but this gene might be involved in proliferation of
pituitary prolactinoma. NUF2 activates tumor growth and inhibits cell apoptosis [108], but this gene
might be liable for pathogenesis of pituitary prolactinoma. CENPM, CENPI, CDCA5 and CENPU
are novel biomarkers for pathogenesis of pituitary prolactinoma. Role of Ran in mitotic spindle is the
most significant MSigDB C2 BIOCARTA pathway for down-regulated genes. RCC1 and KIF15 are
novel biomarkers for pathogenesis of pituitary prolactinoma. Inflammation mediated by chemokine
and cytokine signaling pathway is the most significant PantherDB pathway for down-regulated genes.
PF4-active platelet accumulation in cancer is crucial because platelets can modulate cancer cells and
the cancer microenvironment to stimulate lung cancer outgrowth [109], but this gene might be
answerable for development of pituitary prolactinoma. VWF, CCL3L3, CASK and PLCD4 are novel
biomarkers for pathogenesis of pituitary prolactinoma. O-glycans biosynthetic is the most significant
Pathway Ontology for down-regulated genes. B4GALT6 is novel biomarker for pathogenesis of
pituitary prolactinoma. Eptifibatide pathway is the most significant SMPDB pathway for down-
regulated genes. RYR2 is novel biomarker for pathogenesis of pituitary prolactinoma.
In present study, sensory organ morphogenesis is the most significant GO BP term for up-
regulated genes. Epigenetic inactivation of tumor suppressor genes EYA4 and GAS1 are associated
AIMS Neuroscience Volume 8, Issue 2, 254–283.273
with progression of various cancer types, but silencing of these genes might associate with
progression of pituitary prolactinoma [109–111]. Expression of SOX9 enhances the invasion and
migration of colorectal cancer cells [112], but this gene might be linked with invasion and migration
of pituitary prolactinoma cellc. ROR2 play a key role as an important mediator of the Wnt signaling
pathway in colorectal cancer [113], but this gene might be involves in pathogenesis of pituitary
prolactinoma through activation of Wnt signaling pathway. CLIC5, TMIE, CLRN1, PRRX2, SDK2,
CELSR1, STRA6, CALB1 and VANGL2 are novel biomarkers for pathogenesis of pituitary
prolactinoma. Extracellular matrix is the most significant GO CC term for up-regulated genes.
FLRT2, CPXM2, LAD1 and TGFBR3 are novel biomarkers for pathogenesis of pituitary
prolactinoma. Hormone activity is the most significant GO MF term for up-regulated genes.
CARTPT, GPHA2 and GAL are novel biomarkers for pathogenesis of pituitary prolactinoma.
Nuclear division is the most significant GO BP term for down-regulated genes. NUSAP1 was linked
with proliferation and invasion of prostate cancer cells [114], but this gene might be responsible for
proliferation and invasion of pituitary prolactinoma cells. Cell cycle regulatory protein CKS2 is
culpable for advancement of gastric cancer [115], but this gene might be linked with pathogenesis of
pituitary prolactinoma. PBK is likely to play a crucial role in cell division and cytokinesis in breast
cancer [116], but this gene might be liable for cell division and cytokinesis in pituitary prolactinoma.
Inappropriate expression of NEK2 interfere with mitotic processes results in breast cancer
development [117], but this gene might be play key role in pathogenesis of pituitary prolactinoma.
Oncogene KIF14 play crucial role in cancer development [118], but this gene might be associates
with progression of pituitary prolactinoma. Wong et al. [119] and Loveday et al. [120] demonstrated
that modification of normal DNA repair function of RAD51 and RAD51D might lead to genomic
instabilities that eventually contribute to development of various cancer types, but gene might be
identify with progression of pituitary prolactinoma. CCNG2 deeply involved in progression of
pancreatic cancer via cell proliferation, invasion, chemoresistance, and differentiation [121], but this
gene might be responsible for cell proliferation, invasion, chemoresistance, and differentiation in
pituitary prolactinoma. FANCA, FANCD2, CLTC, MTBP, HAUS6, DLGAP5, RAD21L1, PTTG3P,
KIF11, PRC1, EDN1 and CCNF are novel biomarkers for pathogenesis of pituitary prolactinoma.
Condensed chromosome is the most significant GO CC term for down-regulated genes. HJURP is
novel biomarker for pathogenesis of pituitary prolactinoma. Microtubule binding is the most
significant GO MF term for down-regulated genes. KIF21B and KIF26A are novel biomarkers for
pathogenesis of pituitary prolactinoma.
In present study, SOX2, KRT40, SMAD9, AMOT and DPPA4 were identified as hub proteins
(up regulated DEGs) in the PPI network. AMOT control of the Hippo/LATS pathway in the
processes of cell proliferation, motility, and differentiation in cancer [122], but this might be linked
with cell proliferation, motility, and differentiation in pituitary prolactinoma. SOX2, KRT40,
SMAD9, AMOT and TRIM29 are the hub proteins (up regulated DEGs) with highest betweenness
centrality in the PPI network. TRIM29 is important in differentiation, proliferation, and development
of gastric cancer [123], but this gene might be responsible for differentiation and proliferation in
pituitary prolactinoma. SOX2, KRT40, AMOT, C6orf141 and TRIM29 are the hub proteins (up
regulated DEGs) with highest stress centrality in the PPI network. C6orf141 is novel biomarkers for
pathogenesis of pituitary prolactinoma. SOX2, KRT40, SMAD9, TRIM29 and FGFR2 are the hub
proteins (up regulated DEGs) with highest closeness centrality in the PPI network. PRSS45,
AIMS Neuroscience Volume 8, Issue 2, 254–283.274
CARTPT, TAC4, CT45A1 and PON3 are the hub proteins (up regulated DEGs) with lowest
clustering coefficient in the PPI network. Shang et al. [124] reported that proto-oncogene CT45A1
play key role in invasion of cancer cell, but this gene might be linked with invasion of pituitary
prolactinoma cells. PRSS45, TAC4 and PON3 are novel biomarkers for pathogenesis of pituitary
prolactinoma. CLTC, PLK1, DHX15, GTSE1 and DISC1 are identified as hub proteins (down
regulated DEGs) in the PPI network. DHX15 play key role in cancer progression through activating
AR activity through Siah2-mediated ubiquitination independent of its ATPase activity [125], but this
gene might be liable for development of pituitary prolactinoma. Subhash et al. [126] shown that
GTSE1 is affecting apoptosis in gastric cancer, but this gene might be answerable for development of
pituitary prolactinoma. DISC1 is novel biomarker for pathogenesis of pituitary prolactinoma. CLTC,
PLK1, DHX15, KIF11 and ATP2B2 are the hub proteins with highest betweenness centrality in the
PPI network for down regulated DEGs. ATP2B2 is novel biomarker for pathogenesis of pituitary
prolactinoma. CLTC, DHX15, PLK1, ATP2B3 and KIF11 are the hub proteins with highest stress
centrality in the PPI network for down regulated DEGs. ATP2B3 is novel biomarker for
pathogenesis of pituitary prolactinoma. PLK1, CLTC, ATP2B4, ATP2B8 and DHX15 are the hub
proteins with highest closeness centrality in the PPI network for down regulated DEGs. ATP2B4 and
ATP2B8 are novel biomarkers for pathogenesis of pituitary prolactinoma. B4GALT6, ZNF160,
HIGD1B, CCL3L3 and C20orf203 are the hub proteins with lowest clustering coefficient in the PPI
network for down regulated DEGs. ZNF160, HIGD1B and C20orf203 are novel biomarkers for
pathogenesis of pituitary prolactinoma.
Modules are extracted from the PPI network for up and down regulated DEGs. RUNX1, SOX2,
FGFR2, FGF1, FGFR3, S100B, S100A1, SMAD9 and EVC2 are the hub genes (up regulated DEGs
with high degree) in all four modules in the PPI network. EVC2 is novel biomarker for pathogenesis
of pituitary prolactinoma. CLTC, GTSE1, NUF2, BUB1, SPC24, SPC25, CKS2, CCNB2, CCNA1,
KIF18A, FOXM1 and PRC1 are the hub genes (down regulated DEGs with high degree) in all four
modules in the PPI network. FOXM1 play roles in cancer related processes, such as invasion and
metastasis [127], but this might be linked with invasion and metastasis of pituitary prolactinoma.
LINC00598, CNKSR3, PMAIP1, TRIM71 and FAM83F are identified as up regulated target
genes with high degree of connectivity in target gene-miRNA-regulatory network. LINC00598,
CNKSR3, PMAIP1 and TRIM71 are novel biomarkers for pathogenesis of pituitary prolactinoma.
SOX4, ZMAT3, PTP4A1, RAD51 and DAZAP2 are identified as down regulated target genes with
high degree of connectivity in target gene-miRNA regulatory network. Oncogene SOX4 plays an
essential role in prostate cancer progression [128], but this gene might be associated with progression
of pituitary prolactinoma. PTP4A1 play key role in cancer cell growth and invasion of breast cancer
cells [129], but this gene might be responsible for improvement of pituitary prolactinoma. ZMAT3
and DAZAP2 are novel biomarkers for invasion of pituitary prolactinoma.
IRX1, CACNA2D3, VSNL1, BMP7 and DACT2 are identified as up regulated target gene with
high degree of connectivity in TFs-target gene regulatory network. CACNA2D3 and DACT2 are
tumor suppressor genes and epigenetic inactivation of these genes are linked with progression of
various cancer types [130,131], but suppression of these genes might be identified with progression
of pituitary prolactinoma. IRX1 and VSNL1 are novel biomarkers for pathogenesis of pituitary
prolactinoma. UNC13A, CCNF, BDNF, POU3F4 and AKAP3 are identified as down regulated
AIMS Neuroscience Volume 8, Issue 2, 254–283.275
target genes with high degree of connectivity in TFs-target gene regulatory network. UNC13A,
POU3F4 and AKAP3 are novel biomarkers for pathogenesis of pituitary prolactinoma.
5. Conclusions
We use bioinformatics analysis of pituitary prolactinoma to investigate the biological and
clinical value genes. Finally, using a series of particular conditions we screened crucial genes from
DEGs. These findings may improve our understanding of the etiology, pathology, and the potential
molecular mechanisms and gene targets of pituitary prolactinoma, which may be beneficial for the
identification of diagnostic biomarkers and treatment methods for pituitary prolactinoma.
Nevertheless, lacking of experimental verification is a limitation of this study. Further molecular
biological experiments in vivo and in vitro are required to confirm the function of the identified
genes in pituitary prolactinoma.
Acknowledgement
I thank Ni Li, Institute of Health Sciences, Shanghai Institute for Biological Sciences, Chinese
Academy of Sciences, China, very much, the author who deposited their microarray dataset,
GSE119063, into the public GEO database.
Ethical approval
This article does not contain any studies with human participants or animals performed by any
of the authors.
Author contributions
Vikrant Ghatnatti: Methodology and validation; Basavaraj Vastrad: Writing original draft,
investigation, and review and editing; Swetha Patil: Formal analysis and validation; Chanabasayya
Vastrad: Software and investigation; Iranna Kotturshetti: Supervision and resources.
Availability of data and materials
The datasets supporting the conclusions of this article are available in the GEO (Gene
Expression Omnibus) (https://www.ncbi.nlm.nih.gov/geo/) repository. [(GSE119063)
(https://www.ncbi.nlm.nih.gov/geo/query/acc.cgi?acc=GSE119063)].
Conflict of interest
The authors declare that they have no conflict of interest.
AIMS Neuroscience Volume 8, Issue 2, 254–283.276
References
1. Thorner MO, Martin WH, Rogol AD, et al. (1980) Rapid regression of pituitary prolactinomas
during bromocriptine treatment. J Clin Endocrinol Metab 51: 438–445.
2. Doumith R, Gennes JL, Cabane JP, et al. (1982) Pituitary prolactinoma, adrenal aldosterone-
producing adenomas, gastric schwannoma and colonic polyadenomas: a possible variant of
multiple endocrine neoplasia (MEN) type I. Acta Endocrinol (Copenh) 100: 189–195.
3. Oruçkaptan HH, Senmevsim O, Ozcan OE, et al. (2000) Pituitary adenomas: results of 684
surgically treated patients and review of the literature. Surg Neurol 53: 211–219.
4. Cho DY, Liau WR (2002) Comparison of endonasal endoscopic surgery and sublabial
microsurgery for prolactinomas. Surg Neurol 58: 371–375.
5. Murakami M, Mizutani A, Asano S, et al. (2011) A mechanism of acquiring temozolomide
resistance during transformation of atypical prolactinoma into prolactin-producing pituitary
carcinoma: case report. Neurosurgery 68: E1761–E1767.
6. Tsang RW, Laperriere NJ, Simpson WJ, et al. (1993) Glioma arising after radiation therapy for
pituitary adenoma. A report of four patients and estimation of risk. Cancer 72: 2227–2233.
7. Friedman E, Adams EF, Höög A, et al. (1994) Normal structural dopamine type 2 receptor gene
in prolactin-secreting and other pituitary tumors. J Clin Endocrinol Metab 78: 568–574.
8. Fedele M, Pentimalli F, Baldassarre G, et al. (2005) Transgenic mice overexpressing the wild-
type form of the HMGA1 gene develop mixed growth hormone/prolactin cell pituitary
adenomas and natural killer cell lymphomas. Oncogene 24: 3427–3435.
9. Finelli P, Pierantoni GM, Giardino D, et al. (2002) The High Mobility Group A2 gene is
amplified and overexpressed in human prolactinomas. Cancer Res 62: 2398–2405.
10. Paez-Pereda M, Giacomini D, Refojo D, et al. (2003) Involvement of bone morphogenetic
protein 4 (BMP-4) in pituitary prolactinoma pathogenesis through a Smad/estrogen receptor
crosstalk. Proc Natl Acad Sci USA 100: 1034–1039.
11. Shimon I, Hinton DR, Weiss MH, et al. (1998) Prolactinomas express human heparin-binding
secretory transforming gene (hst) protein product: marker of tumour invasiveness. Clin
Endocrinol (Oxf) 48: 23–29.
12. Lania AG, Ferrero S, Pivonello R, et al. (2010) Evolution of an aggressive prolactinoma into a
growth hormone secreting pituitary tumor coincident with GNAS gene mutation. J Clin
Endocrinol Metab 95: 13–17.
13. Dworakowska D, Wlodek E, Leontiou CA, et al. (2009) Activation of RAF/MEK/ERK and
PI3K/AKT/mTOR pathways in pituitary adenomas and their effects on downstream effectors.
Endocr Relat Cancer 16: 1329–1338.
14. Semba S, Han SY, Ikeda H, et al. (2001) Frequent nuclear accumulation of beta-catenin in
pituitary adenoma. Cancer 91: 42–48.
15. Seemann N, Kuhn D, Wrocklage C, et al. (2001) CDKN2A/p16 inactivation is related to
pituitary adenoma type and size. J Pathol 193: 491–497.
16. Ozfirat Z, Korbonits M (2010) AIP gene and familial isolated pituitary adenomas. Mol Cell
Endocrinol 326: 71–79.
17. Lock C, Hermans G, Pedotti R, et al. (2002) Gene-microarray analysis of multiple sclerosis
lesions yields new targets validated in autoimmune encephalomyelitis. Nat Med 8: 500–508.
AIMS Neuroscience Volume 8, Issue 2, 254–283.277
18. Diboun I, Wernisch L, Orengo CA, et al. (2006) Koltzenburg, M. Microarray analysis after
RNA amplification can detect pronounced differences in gene expression using limma. BMC
Genomics 7: 252.
19. Reiner-Benaim A (2007) FDR control by the BH procedure for two-sided correlated tests with
implications to gene expression data analysis. Biom J 49: 107–126.
20. Caspi R, Billington R, Ferrer L, et al. (2016) The MetaCyc database of metabolic pathways
and enzymes and the BioCyc collection of pathway/genome databases. Nucleic Acids Res 44:
D471–D480.
21. Kanehisa M, Sato Y, Furumichi M, et al. (2019) New approach for understanding genome
variations in KEGG. Nucleic Acids Res 47: D590–D595.
22. Schaefer CF, Anthony K, Krupa S, et al. (2009) PID: the Pathway Interaction Database. Nucleic
Acids Res 37: D674–D679.
23. Fabregat A, Jupe S, Matthews L, et al. (2018) The Reactome Pathway Knowledgebase. Nucleic
Acids Res 46: D649–D655.
24. Dahlquist KD, Salomonis N, Vranizan K, et al. (2002) GenMAPP, a new tool for viewing and
analyzing microarray data on biological pathways. Nat Genet 31: 19–20.
25. Subramanian A, Tamayo P, Mootha VK, et al. (2005) Gene set enrichment analysis: a
knowledge-based approach for interpreting genome-wide expression profiles. Proc Natl Acad
Sci USA 102: 15545–15550.
26. Mi HY, Huang XS, Muruganujan A, et al. (2017) PANTHER version 11: expanded annotation
data from Gene Ontology and Reactome pathways, and data analysis tool enhancements.
Nucleic Acids Res 45: D183–D189.
27. Petri V, Jayaraman P, Tutaj M, et al. (2014) The pathway ontology—updates and applications. J
Biomed Semantics 5: 7.
28. Jewison T, Su Y, Disfany FM, et al. (2014) SMPDB 2.0: big improvements to the Small
Molecule Pathway Database. Nucleic Acids Res 42: D478–D484.
29. Chen J, Bardes EE, Aronow BJ, et al. (2009) ToppGene Suite for gene list enrichment analysis
and candidate gene prioritization. Nucleic Acids Res 37: W305–W311.
30. Ashburner M, Ball CA, Blake JA, et al. (2000) Gene ontology: tool for the unification of
biology. The Gene Ontology Consortium. Nat Genet 25: 25–29.
31. Alanis-Lobato G, Andrade-Navarro MA, Schaefer MH (2017) HIPPIE v2.0: enhancing
meaningfulness and reliability of protein-protein interaction networks. Nucleic Acids Res 45:
D408–D414.
32. Orchard S, Ammari M, Aranda B, et al. (2014) The MIntAct project—IntAct as a common
curation platform for 11 molecular interaction databases. Nucleic Acids Res 42: D358–D363.
33. Chatr-Aryamontri A, Oughtred R, Boucher L, et al. (2016) The BioGRID interaction database:
2017 update. Nucleic Acids Res 45: D369–D379.
34. Keshava Prasad TS, Goel R, Kandasamy K, et al. (2009) Human Protein Reference Database—
2009 update. Nucleic Acids Res 37: D767–D772.
35. Licata L, Briganti L, Peluso D, et al. (2012) MINT, the molecular interaction database: 2012
update. Nucleic Acids Res 40: D857–D861.
36. Isserlin R, El-Badrawi RA, Bader GD (2011) The Biomolecular Interaction Network Database
in PSI-MI 2.5. Database (Oxford) 2011: baq037.
AIMS Neuroscience Volume 8, Issue 2, 254–283.278
37. Pagel P, Kovac S, Oesterheld M, et al. (2005) The MIPS mammalian protein-protein interaction
database. Bioinformatics 21: 832–834.
38. Salwinski L, Miller CS, Smith AJ, et al. (2004) The Database of Interacting Proteins: 2004
update. Nucleic Acids Res 32: D449–D451.
39. Shannon P, Markiel A, Ozier O, et al. (2003) Cytoscape: a software environment for integrated
models of biomolecular interaction networks. Genome Res 13: 2498–2504.
40. Przulj N, Wigle DA, Jurisica I (2004) Functional topology in a network of protein interactions.
Bioinformatics 20: 340–348.
41. Joy MP, Brock A, Ingber DE, et al. (2005) High-betweenness proteins in the yeast protein
interaction network. J Biomed Biotechnol 2005: 96–103.
42. Lehtinen S, Marsellach FX, Codlin S, et al. (2013) Stress induces remodelling of yeast
interaction and co-expression networks. Mol Biosyst 9: 1697–1707.
43. Hsu CW, Juan HF, Huang HC (2008) Characterization of microRNA-regulated protein-protein
interaction network. Proteomics 8: 1975–1979.
44. Stelzl U, Worm U, Lalowski M, et al. (2005) A human protein-protein interaction network: a
resource for annotating the proteome. Cell 122: 957–968.
45. Zaki N, Efimov D, Berengueres J (2013) Protein complex detection using interaction reliability
assessment and weighted clustering coefficient. BMC Bioinformatics 14: 163.
46. Xia JG, Benner MJ, Hancock RE (2014) NetworkAnalyst—integrative approaches for protein-
protein interaction network analysis and visual exploration. Nucleic Acids Res 42: W167–W174.
47. Vlachos IS, Paraskevopoulou MD, Karagkouni D, et al. (2015) DIANA-TarBase v7.0: indexing
more than half a million experimentally supported miRNA: mRNA interactions. Nucleic Acids
Res 43: D153–D159.
48. Chou CH, Shrestha S, Yang CD, et al. (2018) miRTarBase update 2018: a resource for
experimentally validated microRNA-target interactions. Nucleic Acids Res 46: D296–D302.
49. Zhou G, Soufan O, Ewald J, et al. (2019) NetworkAnalyst 3.0: a visual analytics platform for
comprehensive gene expression profiling and meta-analysis. Nucleic Acids Res 47: W234–W241.
50. Wang S, Sun H, Ma J, et al. (2013) Target analysis by integration of transcriptome and ChIP-seq
data with BETA. Nat Protoc 8: 2502–2515.
51. Robin X, Turck N, Hainard A, et al. (2011) pROC: an open-source package for R and S+ to
analyze and compare ROC curves. BMC Bioinformatics 12: 77.
52. Ma C, Wang F, Han B, et al. (2018) SALL1 functions as a tumor suppressor in breast cancer by
regulating cancer cell senescence and metastasis through the NuRD complex. Mol Cancer. 17: 78.
53. Wang YC, Gallego-Arteche E, Iezza G, et al. (2009) Homeodomain transcription factor NKX2.2
functions in immature cells to control enteroendocrine differentiation and is expressed in
gastrointestinal neuroendocrine tumors. Endocr Relat Cancer 16: 267–279.
54. Alarmo EL, Pärssinen J, Ketolainen JM, et al. (2009) BMP7 influences proliferation, migration,
and invasion of breast cancer cells. Cancer Lett 275: 35–43.
55. Cipriano R, Miskimen KL, Bryson BL, et al. (2014) Conserved oncogenic behavior of the
FAM83 family regulates MAPK signaling in human cancer. Mol Cancer Res 12: 1156–1165.
56. Quan YJ, Xu M, Cui P, et al. (2015) Grainyhead-like 2 Promotes Tumor Growth and is
Associated with Poor Prognosis in Colorectal Cancer. J Cancer 6: 342–350.
AIMS Neuroscience Volume 8, Issue 2, 254–283.You can also read