HOW MUCH HIGHER CAN TREASURY YIELDS GO? - December 27, 2021
←
→
Page content transcription
If your browser does not render page correctly, please read the page content below
December 27, 2021
                              HOW MUCH HIGHER CAN TREASURY YIELDS
                              GO?
                              Lawrence Gillum, CFA, Fixed Income Strategist, LPL Financial
                              Ryan Detrick, CMT, Chief Market Strategist, LPL Financial

    We expect interest rates to move modestly higher in 2022 based on near-term inflation
    expectations above historical trends and improving growth expectations once the impact of
    COVID-19 variants recede. Our year-end 2022 forecast for the 10-year Treasury yield is
    1.75–2.00%. An aging global demographic that needs income, higher global debt levels, and
    an ongoing bull market in equities may keep interest rates from going much higher.

Most of this content was taken from Outlook 2022: Passing the Baton

Coming into 2021, we expected Treasury yields to move higher from their very low levels and
they did. Higher inflation expectations, less involvement in the bond market by the Federal
Reserve (Fed), and a record amount of Treasury issuance were all reasons we thought
interest rates could end 2021 between 1.50% and 1.75%. For 2022, near-term inflation
expectations above historical trends and improving growth expectations once the COVID-19
variants recede are reasons why we believe interest rates could move moderately higher from
current levels. In 2022, we expect the 10-year Treasury yield to end the year between 1.75%
and 2.00%. However, an aging global demographic that needs income, higher global debt
levels, and an ongoing bull market in equities (which potentially means more frequent
rebalancing into fixed income) may keep interest rates from going much higher in 2022. While
we don’t expect interest rates to move much higher next year, because starting yields for core
fixed income are still low by historical standards, returns are likely to be flat to the low single
digits in 2022. Not a great year, but we should see an improvement over the negative fixed
income returns we have seen in 2021.

The role of fixed income
With long-term interest rates close to what we think will be cycle highs, it’s important to revisit
the case for fixed income within a broader asset allocation. Core bonds have historically
provided capital preservation, diversification, and liquidity to portfolios, which we think are
important portfolio construction objectives and help clients remain committed to their
investment goals. With the economy likely transitioning to mid-cycle, the need for high-quality
bonds increases in our view. Moreover, the need to offset potential equity market volatility
remains an important role for core fixed income.

Bonds, particularly core bonds, have been less volatile than stocks and have historically
provided ballast to portfolios during equity market drawdowns, which as we know, are normal
occurrences from time to time. The maximum drawdown for bonds, in any given month, has

1    Member FINRA/SIPC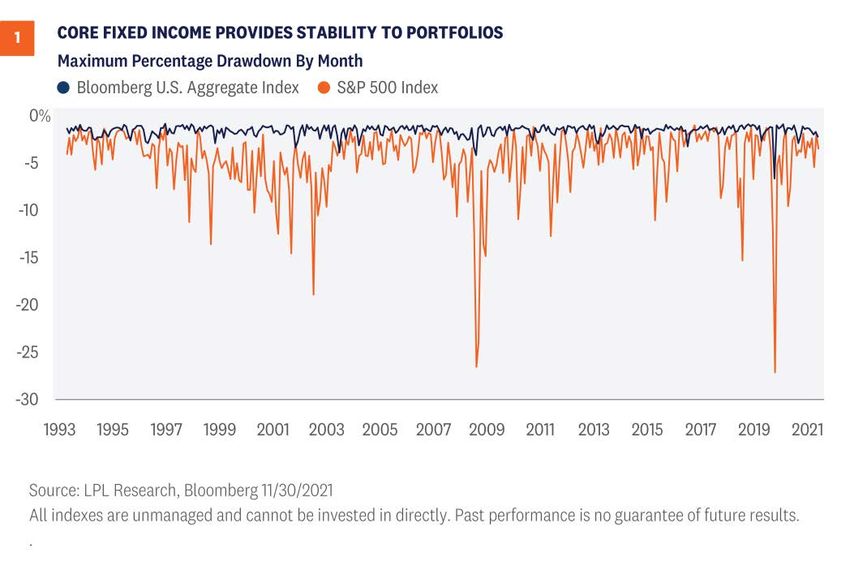
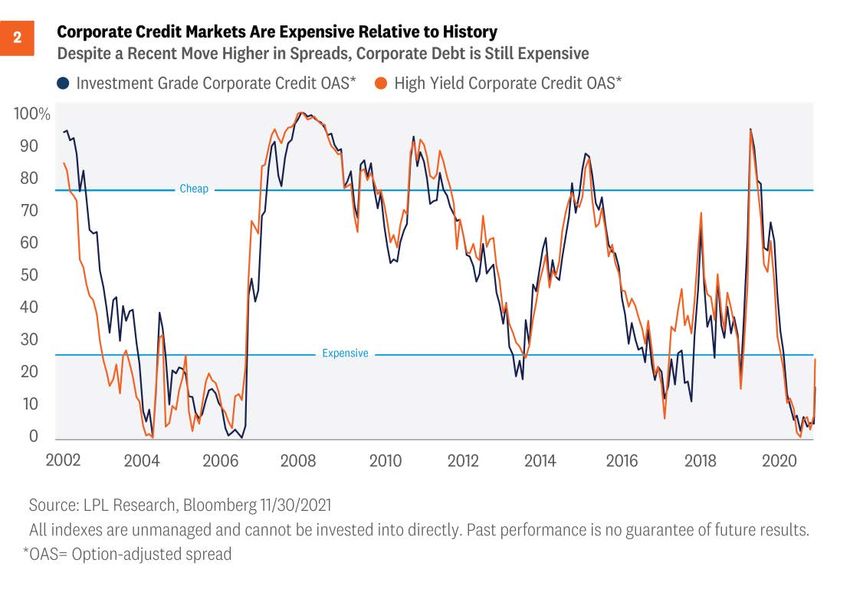
been dramatically less severe than stocks [Figure 1]. While the worst drawdown in a month for
equities was -28%, the worst bonds have done during a month was down 6%, and those
losses were quickly reversed. So, when combined with equities, bonds help reduce total
portfolio volatility, which makes for a smoother investment experience for investors.

What’s next for credit?
As interest rates increased during 2021, investment-grade corporate debt was negatively
impacted as the sector, perhaps surprisingly, is among the most interest rate sensitive fixed
income asset classes. U.S. high-yield investors, however, were rewarded for owning riskier
debt. During the year, credit risk was rewarded as opposed to interest rate risk. As the
economy transitions into mid-cycle, credit investors need to be more cognizant of downside
risks. While the economy should still be conducive to credit risk and corporate balance sheets
generally remain in good shape, credit spreads are among the lowest they’ve been in years,
which means compensation for the added risk of corporates is low.

Both investment-grade corporate credit spreads and high-yield credit spreads are in the bottom
25% compared to history, which means valuations have been cheaper 75% of the time over
the past 20 years [Figure 2]. Corporate credit markets, both investment grade and high yield,
are currently priced near perfection, so any unforeseen event—either related to the economy
or at the corporate level—could negatively impact credit markets. We remain neutral on
investment-grade corporate credit, but we think equities continue to offer better upside return
potential than high-yield bonds, where we remain underweight. For income-oriented investors
willing to take on more risk, we think bank loans still make sense, where appropriate.

2   Member FINRA/SIPC
The Fed takes a step back
Since March 2020, the Fed has supported the economy and financial markets by purchasing
$120 billion in Treasury and mortgage securities each month and by keeping short-term
interest rates near zero. As the economy continues to recover, however, the need for
continued monetary support wanes. The Fed recently announced accelerated plans to end
its bond buying programs in March 2022 to provide optionality to raise interest rates should
inflationary pressures remain elevated. As such, due to the Fed’s recent pivot, we think the
Fed could start to raise short-term interest rates as early as June 2022 but acknowledge that
an earlier timetable is possible.

More importantly, is how high the Fed tries to raise interest rates and how quickly it tries to
get there. A slow deliberate pace of rate hikes, regardless of when liftoff takes place, will
likely lead to a better outcome for the economy, and thus markets, than an overly aggressive
one. The Fed is certainly aware of the risk of hiking interest rates higher than markets are
anticipating. So, as it stands now, we think the Fed will likely tread lightly after the first few
rounds of interest rate hikes next year.

3   Member FINRA/SIPC
IMPORTANT DISCLOSURES

This material is for general information only and is not intended to provide specific advice or recommendations for any
individual. There is no assurance that the view s or strategies discussed are suitable for all investors or w ill yield positiv e
outcomes. Investing involves risks including possible loss of principal. Any economic forecasts set forth may not develop as
predicted and are subject to change.

References to markets, asset classes, and sectors are generally regarding the corresponding market index. Indexes are
unmanaged statistical composites and cannot be invested into directly. Index performance is not indicative of the performance
of any investment and do not reflect fees, expenses, or sales charges. All performance referenced is historical a nd is no
guarantee of future results.

Any company names noted herein are for educational purposes only and not an indication of trading intent or a solicitation of
their products or services. LPL Financial doesn’t provide research on individual equities.

All information is believed to be from reliable sources; how ever, LPL Financial makes no representation as to its completenes s
or accuracy.

US Treasuries may be considered “safe haven” investments but do carry some degree of risk including interest rat e, credit,
and market risk. Bonds are subject to market and interest rate risk if sold prior to maturity. Bond values w ill decline as in terest
rates rise and bonds are subject to availability and change in price.

The Standard & Poor’s 500 Index (S&P500) is a capitalization-w eighted index of 500 stocks designed to measure performance
of the broad domestic economy through changes in the aggregate market value of 500 stocks representing all major
industries.

The PE ratio (price-to-earnings ratio) is a measure of the price paid for a share relative to the annual net income or profit
earned by the firm per share. It is a financial ratio used for valuation: a higher PE ratio means that investors are paying more
for each unit of net income, so the stock is more expensive compared to one w ith low er PE ratio.

Earnings per share (EPS) is the portion of a company’s profit allocated to each outstanding share of common stock. EPS
serves as an indicator of a company’s profitability. Earnings per share is generally considered to be the single most important
variable in determining a share’s price. It is also a major component used to calculate the price-to-earnings valuation ratio.

All index data from FactSet.

This research material has been prepared by LPL Financial LLC.

Securities and adv isory services offered through LPL Financial (LPL), a registered inv estment advisor and broker -dealer (member
FINRA/SIPC). Insurance products are offered through LPL or its licensed affiliates. To the extent you are receiving investment advice from
a separately registered independent investment advisor that is not an LPL affiliate, please note LPL makes no representation with respect to
such entity.

     Not Insured by FDIC/NCUA or Any Other Gov ernment Agency                              Not Bank/Credit Union Guaranteed
             Not Bank/Credit Union Deposits or Obligations                                           May Lose Value

RES-988800-1221 | For Public Use | Tracking # 1-05225134 (Exp. 12/22)

4     Member FINRA/SIPC
You can also read