Home Textiles Sector Initiating Coverage - Welspun India
←
→
Page content transcription
If your browser does not render page correctly, please read the page content below

Home Textiles Sector
Initiating Coverage

January 6, 2019        Vikas Jain (vikas.jain@equirus.com, 7574885492), Maulik Patel (maulik@equirus.com)
Home Textiles Sector
                                                                                          Promising Textures
      © 2018 Equirus All rights reserved
                                                                                                                                                   Initiation note

Significant labor cost advantages over other countries,             Rising consumer preference for the online platform prodded      actions and changes to business model. With a set vision of
leadership positions in key markets and favorable government        many retailers to make significant changes in their business    Welspun 2.0 & nearing-end of the capex cycle leading to
policies give Indian manufacturers a strong edge in the global      models — ranging from becoming more aggressive on their         strong cashflow generation, we expect growth to return with
home textiles space which is growing at 8% CAGR and is              online channels and trimming down non-profitable stores to      12%/22% revenue/PAT CAGR and a ~360/380bps expansion
expected to reach $67bn in 2020. The fundamental strength           shifting entirely to e-commerce sales and shutting down all     in ROE/core ROIC over FY18-FY21E. We initiate coverage on
of India’s textile industry is its strong production base of a      retail operations.                                              the stock with LONG and a Mar’20 TP of Rs 77.
wide range of fiber/yarns from natural fibers (cotton, jute,        Efforts pay off — US sales recover in late 2018                 Himatsingka Seide — Initiate with LONG; Mar’20 TP Rs 282
silk) and wool-to-synthetic/man-made fibers (polyester, viscose,
                                                                    While the dip in the exports to US was seen across Indian       HSS is a vertically integrated player with a global footprint,
nylon, acrylic), and ready cotton availability.
                                                                    players, aligning their business models led to a recovery in    and focuses on manufacturing, retailing and distribution of
US — India’s key export market                                      sales to the US from latter half of 2018. With the impact of    home textiles. With recent expansion of sheeting capacity,
India’s major export market is the US (homogenous                   destocking subsuming and restocking happening, the              new brand acquisitions and new terry plant commencing
consumption market, attractive to target) — one of the              demand for home textile products started increasing, with a     operations from H2FY20, it should deliver a 12% revenue CAGR
largest home textile markets in the world. While India does         positive uptick and yoy improvement in sales at both country    over FY18-FY21. Rising utilization of new spinning plant and
export to the EU too, the market’s heterogeneous nature             and company levels.                                             operating synergies will drive 285/100bps expansion in
and preferential tariffs to competing nations like Pakistan,        Additional tailwinds offer growth visibility                    EBITDA/PAT margins over FY18-21E.
and Bangladesh make it difficult to target. According to the        Cotton prices have declined to Rs 122/kg in Nov’18 from the
                                                                                                                                    Recommendation snapshot
Office of Textiles and Apparels (OTEXA) US, India supplied          peak levels of Rs 130/kg; also, INR depreciation stood at
                                                                                                                                                                                  Himatsingka
~39% of cotton towel imports into the US in CY17, up from           ~10% in CY18, which should aid Indian exporters.                 Particulars                 Welspun India
                                                                                                                                                                                     Seide
30% in CY09. Even in cotton sheets, India supplied ~50% of          Furthermore, the increase in duty drawback rates of up to
                                                                                                                                     Revenue CAGR (FY18-21E)          12%              12%
total imports to the US in CY17, nearly doubling from 27% in        0.6% across major home textile products and extension of
CY09. This was driven by market share gains from China                                                                               EBITDA CAGR (FY18-21E)           13%              17%
                                                                    MEIS at 4% beyond Jun’18 for an indefinite period will boost
(down 8-9% in cotton sheets & 2-3% in terry products) &             the growth in home textile exports. With demand returning        EPS CAGR (FY18-21E)              22x              16%
Pakistan (down 8-9% in cotton sheets & ~2% in terry                 to normalcy and favorable tailwinds kicking in, we expect        P/E (FY20E)                      11x             8.5x
products) over 2009-17 & rising manufacturing costs in              strong revenue growth for integrated and specialized home        P/B (FY20E)                      1.8x            1.3x
competing countries.                                                textile exports of India, with players such as Welspun and
                                                                                                                                     EV/EBITDA (FY20E)                6.5x             7x
Higher online purchases disrupt US exports, force                   Himatsingka Seide at the forefront.
                                                                                                                                     ROE (FY20E)                      18%              17%
business model transformations
                                                                    Welspun India — Initiate with LONG; Mar’20 TP Rs 77              Rating                          LONG             LONG
The US home textiles market has been under pressure over
last two years led by sluggish demand conditions and                Increasing penetration in the US market through a wide           Target EV/EBITDA multiple        7.5x             8x
customer purchases shifting to the online channel, forcing          range of quality products has made Welspun (WLSI) one of         Target Price (Rs)                77               282
some retailers to make major changes in their business              the preferred suppliers to global retailers. Post the revenue
                                                                                                                                     Upside                           27%              31%
models, including cutting down order sizes and destocking           decline caused by traceability issues & changing buying
existing inventory so as to prevent any inventory losses.           patterns, WLSI has emerged strong with several corrective

  January 6, 2019                                Analysts: Vikas Jain (vikas.jain@equirus.com, 7574885492), Maulik Patel (maulik@equirus.com)                                     Page 1 of 10
                                                               Before reading this report, you must refer to the disclaimer on the last page.
Home Textiles Sector                                                                        OVERWEIGHT

Global textile & apparel market — Key dynamics                                                Exhibit 2: US & Europe — Major end markets comprising one-third share each
Exports dominated by developing nations                                                                                   Global Home Textile Market Composition

According to WTO data, global textile trade touched US$ 748bn in 2017, of which clothing
and apparels trade stood at US$ 456bn (~61%) and textiles trade at US$ 292bn (~39%). China
and developing countries like India, Vietnam and Bangladesh lead textile and apparel
exports globally, with major manufacturing activities concentr0ated in these regions.                                           US                        Europe
                                                                                                                                34%                        33%

 Exhibit 1: China dominated most of the exports from developing nations

                                                                  China, 35%

                                                                  EU-28, 24%
                                                                                                                                            RoW
                                                                  India, 5%                                                                 33%

                                                                  Vietnam, 4%
                                                                                              Source: Welspun Investor Presentation, Equirus Securities
                                                                  Bangladesh, 4%

                                                                  Turkey, 3%
                                                                                             US market — Multiple growth levers driving overall consumption
                                                                  US, 2%
                                                                                             The US home textile market is valued at ~US$ 17bn with cotton home textile products
                                                                  Pakistan, 2%               accounting for more than 2/3rd of the market. Home textile imports of the US constitute
                                                                  RoW, 20%                   ~24% of global home textile imports, making it the most important markets for home textile
                                                                                             manufacturers in the world.
 Source: WTO.org, Equirus Securities
                                                                                             US markets displayed considerable strength in 2017 with improving economic indicators like
The global home textile market is currently valued at ~US$ 50bn at the wholesale level,      consumer confidence, employment statistics and personal consumption. This led to a ~3.5%
largely dominated by Asian players with India and China having a market share of 11% and     increase in overall retail sales from US$ 4.82tn in 2016 to US$ 4.99tn in 2017, with further
35% respectively. With strong improvement in overall macro indicators, the global home       growth of >3% over the next three years (Exhibit 03). Favourable macro conditions and rising
textile market is expected to reach US$ 67bn in 2020, at an 8.3% CAGR over 2015-2020.        personal consumption will maintain dominance of the US market in global textile trade.

Key consumption markets of home textile products

US and Europe are the major end markets, comprising a third each of the home textile
market. US, being a homogenous market, is very attractive to target and explains the high
concentration of Indian players there. While Europe is also an equally big market,
heterogeneity in consumption due to sharp differences in buying habits make it a difficult
market to cater to. Additionally, preferential tariffs given to competing countries like
Pakistan and Bangladesh by Europe put Indian players at a disadvantage.

January 6, 2019                            Analysts: Vikas Jain (vikas.jain@equirus.com, 7574885492), Maulik Patel (maulik@equirus.com)                                Page 2 of 10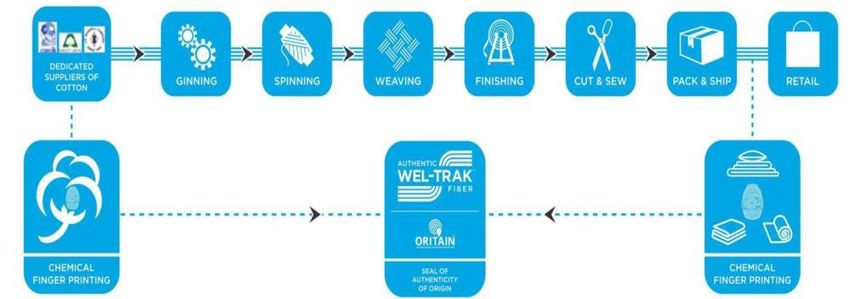
Home Textiles Sector OVERWEIGHT
Exhibit 3: Rising confidence of US consumers signals expectations of a pickup in economy Exhibit 5: ... strong growth in disposable income which in turn will boost consumption
US Consumers' Confidence Index (%) Real Personal Disposable Income (In Bn USD)
102
15,000
101 14,500
100 14,000
13,500
99
13,000
98 12,500
97 12,000
96 11,500
11,000
95
10,500
94 10,000
May-08
Oct-08
Mar-09
Aug-09
Jan-10
Apr-11
Dec-12
May-13
Oct-13
Mar-14
Aug-14
Jan-15
Apr-16
Dec-17
May-18
Oct-18
Nov-15
Nov-10
Sep-11
Feb-12
Sep-16
Feb-17
Jun-10
Jun-15
Jul-12
Jul-17
Aug-09
Dec-09
Aug-10
Dec-10
Aug-11
Dec-11
Aug-12
Dec-12
Apr-13
Aug-13
Dec-13
Aug-14
Dec-14
Aug-15
Dec-15
Aug-16
Dec-16
Aug-17
Dec-17
Aug-18
Apr-10
Apr-11
Apr-12
Apr-14
Apr-15
Apr-16
Apr-17
Apr-18
Source: Consumer Confidence Index (CCI) OECD 2018 Source: Bureau of Economic Analysis
Exhibit 4: Increasing employment in US population is leading to… Exhibit 6: Rising employment, disposable income has led to a pick-up in US home sales
US Population Employment Ratio (%) US House Sales (In 000 units)
61% 60.6% 700
613 620
61% 60.1% 600 561
59.9% 501
60% 59.7% 485
500 437
59.3% 429
60% 375 368
400
58.8% 323 306
59% 58.6%
58.5% 58.4%
58.3% 300
59%
200
58%
58% 100
57% 0
Jan'10 Jan'11 Jan'12 Jan'13 Jan'14 Jan'15 Jan'16 Jan'17 Jan'18 Nov'18 2008 2009 2010 2011 2012 2013 2014 2015 2016 2017 10M18
Source: US Consensus Bureau
Source: US Bureau of labour statistics
January 6, 2019 Analysts: Vikas Jain (vikas.jain@equirus.com, 7574885492), Maulik Patel (maulik@equirus.com) Page 3 of 10
Home Textiles Sector                                                                            OVERWEIGHT

 Exhibit 7: Consistent growth in US retail sales for last 8 years                               Exhibit 8: Pakistan & Turkey command a major part of Europe’s home textile imports

                                        US Retail Sales (In tn $)                                                            EU's Home Textile Market Composition
  6.0
                                                                                    5.48                                                        China
  5.5                                                                       5.32
                                                                    5.16                                                                         18%
                                                             4.99
                                                  4.82                                                                             Turkey                   India
  5.0
                              4.63      4.7                                                                                         19%                      12%
                    4.53
  4.5     4.35                                                                                                                                                         Bangladesh
                                                                                                                                                                          6%
                                                                                                                                                            RoW
  4.0                                                                                                                                                        7%
                                                                                                                                            Pakistan
  3.5                                                                                                                                         38%

  3.0
          2012      2013      2014      2015      2016       2017   2018E   2019E   2020E
                                                                                                Source: Welspun Investor Presentation, Equirus Securities
 Source: Welspun Investor Presentation, Equirus Securities
                                                                                               Exhibit 9: EU’s preferential duty structure benefits select countries
Europe — Preferential duty access restricts exporters to target aggressively                    Countries                                                           Import Duty Structure

Europe’s home textile market is heterogeneous in nature with different cultures leading to      India                                                                       6-9%
wide range of preferences for home textile products. This makes EU a difficult market to        Pakistan                                                                  Duty Free
serve. Additionally, there is preferential access given to some countries like Pakistan and
                                                                                                Bangladesh                                                                Duty Free
Bangladesh, which makes imports from these countries duty-free. Heterogeneity and
preferential duty access have marred Indian and Chinese exporters from aggressively             Turkey                                                                    Duty Free
pursuing the European market for gaining market share.                                         Source: Equirus Securities

                                                                                               Preferential duty access has enabled Pakistan to consistently gain market share in Europe’s
                                                                                               overall imports. With market share increasing from 26% in CY09 to 38% in CY17, Pakistan is
                                                                                               the largest home textile exporter to EU. EU and Turkey are linked by a Customs Union
                                                                                               Agreement which makes imports and exports from Turkey to Europe exempt from import
                                                                                               duties.

                                                                                               India’s share in EU’s home textile imports have remained largely constant at 12-13%, mainly
                                                                                               due to higher landing costs of Indian goods to the European market. This has resulted in
                                                                                               Indian manufacturers competing only in premium categories. While India is in discussion
                                                                                               with the EU for an FTA which would reduce these duties significantly, the timeline for
                                                                                               conclusion of the agreement remains uncertain.

January 6, 2019                                 Analysts: Vikas Jain (vikas.jain@equirus.com, 7574885492), Maulik Patel (maulik@equirus.com)                                        Page 4 of 10
Home Textiles Sector                                                                          OVERWEIGHT

India — A big player in global home textiles market                                              production. FY18 saw a higher-than-expected rise in cotton acreage at 19% and a
                                                                                                 consequent 11% increase in crop production; however, due to the pink bollworm attack in
Unmatched advantage in cotton home textiles
                                                                                                 some parts of the country, stock available for sale in the market was lower. The year started
India commands a significant position (11% market share) in the global home textile              with high cotton prices of Rs 43,000-44,000 per candy, which corrected to
industry, particularly in cotton-based home textile products. This is largely due to a myriad    Rs 38,000-39,000 per candy with the start of the cotton season; nevertheless, it again shot
of competitive advantages that India has over its competitors, which put it in a unique spot     up to Rs 40,000-41,000 per candy in Dec’17 and Jan’18 as the crop loss due to pink bollworm
over other competing nations like Pakistan, Bangladesh and Vietnam.                              became evident.

 Exhibit 10: Key factors that give competitive edge to India over others                         Exhibit 11: FY18 Cotton Balance Sheet (In mn meters)
                                                                                                                 Opening                                                                          Ending
                                                                                                  Country                          Output        Import       Consumption         Exports
                                                                                                                   Stock                                                                           Stock
                                                                                                  World             18.9             26.7             NA                 26.3         NA            19.2
              Cotton Availability                                                                 US                  0.6             4.6               -                 0.7          3.4             1
                                                                                                  India               2.4             6.2             0.4                 5.3           1            2.7
                                                                                                  China              10.5               6             1.1                 8.7               -        8.9
                                                                                                  Pakistan            0.5             1.8             0.6                 2.3               -        0.6
                    Competitive Costs
                                                                                                 Competitive cost
                                                                                                 India provides a cost-effective model of manufacturing for textile players. As compared to
                                                                                                 key competing countries, India has one of the lowest labor costs at US$ 160-180/month,
                    Socio-Economic Factors
                                                                                                 power cost of US$ 0.10-0.12/KWH and water cost at US cents 16-20/m3. Higher finance
                                                                                                 costs vis-à-vis competing countries is partly mitigated through various government policies.
                                                                                                 Thus, Indian manufacturers get a competitive edge in terms of cost over other countries
              Supportive Govt. Policies                                                          manufacturing home textiles.

                                                                                                 Exhibit 12: India’s cost advantage over other cotton-producing countries
                                                                                                  Cost Element              Unit              India         Bangladesh             China        Vietnam
 Source: Equirus Securities
                                                                                                  Labour Cost      US $/ month              160-180            100-110           550-600         170-190

Cotton availability                                                                               Power Cost           US$/kwh         0.10-0.12             0.09-0.12          0.15-0.16       0.08-0.10
India is one of the largest producers of cotton in the world as well as a net exporter of         Lending Rate                %             11-12%              12-14%              5-6%            6-7%
cotton and cotton yarn. It has the distinction of having the world’s largest area under cotton
                                                                                                  Water Cost       US Cents/m3                16-20              20-22             55-60           50-80
cultivation. India’s closest competitor in terms of production is China, which is a net
importer of cotton (Exhibit xx). Ready availability of cotton gives domestic home textiles
                                                                                                 Socio-economic contribution
players an edge in form of quick raw material supply and lower cotton prices.
                                                                                                 The textile industry is an integral part of India’s development because of its role in earning
                                                                                                 foreign exchange and generating employment. It works on the fundamental strength of a
India’s advantage of being the largest producer of cotton is expected to continue as the
                                                                                                 strong production base of a wide range of fiber/yarns from natural fibers like cotton, jute,
country’s India’s cotton yield at present is 504 KG/HA, much lower that overall global
                                                                                                 silk and wool to synthetic/man-made fibers like polyester, viscose, nylon and acrylic. The
average of 596 KG/HA. This indicates a huge growth potential in terms of cotton yield and
January 6, 2019                              Analysts: Vikas Jain (vikas.jain@equirus.com, 7574885492), Maulik Patel (maulik@equirus.com)                                             Page 5 of 10
Home Textiles Sector                                                                                 OVERWEIGHT

industry is also labor-intensive and one of the largest employers (~40mn workers directly,     India — Second largest home textile exporter after China
60mn workers indirectly). It contributes 14% to the country’s manufacturing, 4% to the GDP
                                                                                               The world’s top-10 importing nations contribute to around 80% of the home textiles market
and 13% to the country’s export earnings. With significant employment generation and
                                                                                               with EU-28 comprising 36% of overall imports and US ~24%. To these importing nations,
contribution to exports earnings, the textile industry occupies an important space in
                                                                                               China is the largest supplier with a market share of 35% followed by India with exports close
framing the economic and policy decisions of the country.
                                                                                               to US $5bn and a market share of 11% (2017).
Supportive Government policies
                                                                                               EU-28, being a difficult market to serve, is less preferred by India’s home textile exporters
India’s textile industry, being an integral part of the country’s development, foreign         while US being a homogenous and easy-to-serve market is most preferred. Main products
exchange earnings and employment generation, benefits from central and state                   which are currently supplied to US markets include cotton sheets, cotton towels,
government policies which are conducive for industry growth. Various policies devised by       bedspreads and cotton pillow cases.
Indian government to boost the growth of India’s textile sector are as follows:
                                                                                               Rising dominance of Indian goods in US bed sheet and towel market
•   Amended Technology Upgradation Fund Scheme (ATUFS): Under this scheme,
                                                                                               According to the Office of Textiles and Apparels (OTEXA) US, India supplied about 39% of
    government provides credit linked capital investment subsidy with an objective of
                                                                                               cotton towel imports into the US in CY17, up significantly from the levels of 30% in CY09.
    augmenting investment, productivity and employment in textile sector. The
                                                                                               Even in the cotton sheets segment, India supplied about 50% of total imports to the US in
    percentage of subsidy depends upon the type of machinery purchased.
                                                                                               CY17, nearly doubling from 27% in CY19.

•   Merchandise export scheme (MEIS): This scheme was started to offset the
    infrastructural inefficiencies & associated cost of exporting products produced in India
                                                                                                Exhibit 13: India has a dominant position in US towel market
    which can generate employment and enhance India’s competitiveness in the world
    market. In this, 2% of FOB value of exports is paid to the manufacturer on quarterly                                 India           China              Pakistan             ROW
    basis. This rate has been doubled to 4% to increase India’s competitiveness as compared      45%
    to other nations.                                                                                                                                    38%                     39%
                                                                                                 40%                             36%
                                                                                                 35%
•   Duty Drawback: This involves refund of duties paid to government like excise duty and                30%
                                                                                                 30%                                   26%
    others. Before GST, this was at ~7-8% which has been reduced to 2% post GST. But due                                 25%                                   25%                     24%
                                                                                                 25%           23% 22%                       22%                     22%
    to falling textile exports across categories, this has recently been increased by upto                                                                                                   21%
    0.6% across categories.                                                                      20%                                               16%                                             16%
                                                                                                                                                                           15%
                                                                                                 15%
•   Rebate on State Levies (ROSL): In the ROSL scheme, the Central Govt. provides rebate         10%
    of State levies comprising of State VAT/CST on inputs including packaging, fuel, duty         5%
    on electricity generation and duties and charges on purchase of grid power as
                                                                                                  0%
    accumulated through the stages of production from yarn to finished made-ups. ROSL is                       CY2009                  CY2012                  CY2015                  CY2017
    currently provided at ranging from 1.5-2.2% for textile products.
                                                                                                Source: Welspun Investor Presentation, Equirus Securities

January 6, 2019                             Analysts: Vikas Jain (vikas.jain@equirus.com, 7574885492), Maulik Patel (maulik@equirus.com)                                          Page 6 of 10
Home Textiles Sector                                                                                               OVERWEIGHT

 Exhibit 14: One out of every two sheets imported by US is manufactured in India                                         Home textile includes products such as bedsheets, pillow cases, blankets, terry towels,
                                                                                                                         upholstery, table clothes, carpets and rugs. Because of superior product quality, Indian
                           India                 China               Pakistan                     ROW
                                                                                                                         home textile manufacturers have gained sizeable market share in global home textile
  60%
                                                                                                  50%                    market over the last few years. However, India still accounts for only 7% of the global home
                                                                   48%
  50%                                    45%                                                                             textile trade, leaving significant headroom for growth, which would be driven by market
  40%                                                                                                                    share gains. Growth in domestic home textiles would be supported by favourable
             27% 29% 26%                                                                                                 demographics, increasing household income, rising population and growth in end-use
  30%                                                                    23%
                                               22%                                                      20%              sectors like housing, hospitality and healthcare.
                           18%                       18%                       16%
  20%                                                      15%                       13%                      15% 15%
                                                                                                                         India’s home textile industry stood at US$ 4.7bn in 2014 and is expected to grow at 8.3%
  10%
                                                                                                                         CAGR during 2014-21 to reach US$ 8.2bn in 2021. India is the third largest home textile
   0%                                                                                                                    market in the Asia-Pacific region. Around 70% of the domestic home textile market is
                 CY2009                        CY2012                    CY2015                         CY2017
                                                                                                                         unorganized in nature which offers a great opportunity for big and organized players to
 Source: Welspun Investor Presentation, Equirus Securities                                                               capture some market share. Bed linen is the largest product category constituting almost
                                                                                                                         half of India’s home textile market, followed by bath linen and other products like flooring,
India Home Textile Industry — A big market in itself                                                                     and upholstery.

The Indian textile industry has a noteworthy presence in both the Indian economy and in
                                                                                                                          Exhibit 16: Indian Home textile industry to grow at 8.3% CAGR over CY14-21E
the international textile economy. The fundamental strength of India’s textile industry is
its strong production base of wide range of fiber/yarns from natural fibers like cotton, jute,                                                               Indian Home textile Industry (US $ Bn)
silk and wool-to-synthetic/man-made fibers like polyester, viscose, nylon and acrylic. The                                     9.0
country’s domestic and apparel Industry has grown at a 10% CAGR over 2009-17 and stood                                         8.0
at US$ 150bn in 2017. It is further expected to reach US $200bn by 2019.
                                                                                                                               7.0

 Exhibit 15: Indian Textile industry has grown at 10% CAGR over last 8 years                                                   6.0
                                                                                                                               5.0
                                          Indian Textile Industry (In Bn USD)
     250                                                                                                                       4.0
                                                                                                                               3.0
     200                                                                                                                       2.0
                                                                                                                               1.0
     150                                                                                                                                       4.70                          5.50                     8.20
                                                                                                                               0.0
                                                                                                                                               2014                         2016P                     2021E
     100
                                                                                                                          Source: IBEF, Equirus Securities
        50
               70      78           89          92           96     99         108         137          150       200
        0
              2009    2010         2011        2012         2013   2014        2015        2016     2017         2020E
 Source: Wazir Analysis, Equirus Securities

January 6, 2019                                              Analysts: Vikas Jain (vikas.jain@equirus.com, 7574885492), Maulik Patel (maulik@equirus.com)                                                     Page 7 of 10
Home Textiles Sector                                                                      OVERWEIGHT

    Exhibit 17: Bed linen products are almost half of Indian home textile industry               •   Changing retail trends

                                 Product Mix of Indian Home textile Industry                     The rapidly expanding Indian e-commerce industry is expected to surpass the US to become
                                                                                                 the second-largest e-commerce market in the world by 2034. Rising internet penetration is
                                                                                                 expected to lead growth in e-commerce and this sales channel is likely to be a major growth
                                                    Bath Linen
                                                                                                 driver of the industry.
                                                       18%

                                                                                                 US Home Textile Market: Disruption & recovery
                                                                            Others (Floor,
                                                                           Upholstery, etc)      The US home textiles market has been under pressure from 2017-beginning led by sluggish
                   Bed Linen                                                     33%             demand conditions and customer purchases shifting to the online channel, forcing some
                     49%
                                                                                                 retailers to make major changes in their business models (some who did not change had to
                                                                                                 close down).

                                                                                                 Higher online buying forces industry players to transform business models
                                                                                                 The advent of aggressive marketing & promotions by giant online players along with the
    Source: IBEF, Equirus Securities                                                             convenience of getting the product delivered to the doorstep has led to a major shift in
                                                                                                 buying patterns of buyers across the globe. This trend gathered momentum with an influx
Growth drivers of Indian Home Textile Industry                                                   of online startups coming up with offerings in segments like electronics, kids wear, toys,
                                                                                                 and menswear.
•      Rising supply, but overall pie also increasing
                                                                                                 Preference for online shopping due to its ease and convenience was further boosted by a
Despite a demand pickup in both domestic and global markets, there is still a vacuum to
                                                                                                 series of discounts and offers conducted by online retailers like Amazon and others,
supply more goods as most home textile units are not operating at their full capacities.
                                                                                                 attracting many customers to purchase goods online.
Further, investment in newer technologies and processes, and benchmarking these with
global units will help Indian home textile manufacturers to gain market share in both            While a significant shift was seen in some industries like electronics, books and apparels,
domestic and global markets.                                                                     (some saw ~70% of sales moving online), the home textile industry was not impacted to a
•      Premiumization, branding to boost demand growth                                           great extent given the element of touch & feel present for making purchase decisions.
                                                                                                 According to industry estimates, 10-15% of home-textile sales have shifted to the online
The preference for branded and premium products has increased over the years. This has
                                                                                                 platform. This was partly contributed by new online startups offering attractive discounts
led to home textile companies going aggressive in branding their products, resulting in
                                                                                                 and also due to lower footfalls in stores of big retailers as most other products were
improved sales for branded home textile products. There is a supply glut in the lower-end
                                                                                                 purchased online.
of the pyramid with a high supply of basic goods. Players able to differentiate their products
are able to gain the market share.                                                               Rising consumer preference for the online platform prodded many retailers to make
•      Constant innovation, R&D to lead to high demand                                           significant changes in their business models — ranging from becoming more aggressive on
                                                                                                 their online channels and trimming down their non-profitable stores to shifting entirely to
In similar lines to the clothing and apparel industry, the home textile market faces a           e-commerce sales and shutting down all retail operations. Exhibit 17 shows many of the
continuous change in designs and fashions. Companies that are able to cater to the rapidly       retail stores chains downsizing operations because of lower footfalls in their stores.
changing needs typically dominate the market.

January 6, 2019                                   Analysts: Vikas Jain (vikas.jain@equirus.com, 7574885492), Maulik Patel (maulik@equirus.com)                            Page 8 of 10
Home Textiles Sector                                                                                      OVERWEIGHT

 Exhibit: 18: List of some prominent retailers downsizing with online channels eating away                There were a series of actions taken by retailers to deal with the changing trends. Some
 sales and reducing footfalls                                                                             players who found difficult to adjust with the changing buying patterns had to forcefully
                                                                                                          close down stores and move to the online channel only, while some became more aggressive
   •   J.C. Penney: The department store chain closed 138 stores last year while restructuring its
       business to meet shifting consumer tastes.                                                         with their online presence while continuing with their retail operations. The first action
                                                                                                          taken by most retailers to deal with this uncertainty was to cut down order sizes and destock
   •   Michael Kors: With same-store sales plunging, the upscale fashion retailer said it would close     the existing inventory so as to prevent any inventory losses. This led to a sharp dip in sales
       as many as 125 stores to adapt to a difficult, promotional sales environment.
                                                                                                          of most home textile exporters. Exhibit 18 shows the dip in sales of leading home textile
   •   Sears/Kmart: Sears Holdings is one of the most prominent traditional retailers to suffer in a
                                                                                                          companies of India due to the destocking exercise of retailers.
       tough sales environment. The brand shuttered 35 Kmart locations and 8 Sears stores last July
       and has closed more than 300 locations last year amid pressure from ecommerce outlets.             Exhibit 19: Most peers saw their revenues affected due to a shift in buying patterns in
                                                                                                          FY18
   •   Abercrombie & Fitch: Facing declining sales, the once-prominent fashion brand announced             YoY Revenues (Growth/Decline) %           1QFY18        2QFY18        3QFY18        4QFY18
       last March that it would close 60 of its U.S. stores with expiring leases during its 2017 fiscal
       year. The chain has closed hundreds of store locations over the last few years while placing        Welspun                                      -3.3%        -10.2%         -6.9%        -14.3%
       an increased emphasis on online sales.                                                              Trident                                       1.2%         -2.3%         -0.1%         -7.5%

   •   The Limited: After a brutal holiday season in 2016, the clothing chain closed all 250 of its        Indocount                                   -16.2%        -18.1%         -8.4%        -13.2%
       physical stores last January as part of a bid to focus on ecommerce. The closures reportedly        Himatsingka Seide                             6.5%         10.0%          8.8%         -3.6%
       resulted in the loss of about 4,000 jobs.
                                                                                                          Source: Equirus Securities
   •   Aerosoles: The New Jersey-based women’s footwear company filed for bankruptcy last year
       and announced plans to move forward with a “significant reduction” in its retail locations.        Efforts pay off with recovery seen across product categories
                                                                                                          The impact of destocking was largely seen from 2018-beginning on all major exporting
   •   Bebe: The women’s apparel chain closed all of its remaining 168 stores by last May, days
                                                                                                          countries to US like India, China and Pakistan. For the first six months of 2018, cotton sheets
       after it said it was exploring “strategic alternatives for the company” amid plunging sales.
                                                                                                          saw a 3% decline in volumes and 7% decline in value while terry towels saw an 18% decline
   •   Bon-Ton Stores Inc.: The struggling department store filed for Chapter 11 bankruptcy,              in volume and 17% decline in value. Pillow cases too saw a decline of 7% in volumes and 14%
       according to court papers filed in February. The chain, which operates 256 stores in 23 states,    in value for the same period. The market share fall was also observed in some categories
       also announced it plans to close 42 stores in 2018 as part of a restructuring plan.
                                                                                                          with low unit costs as importing from nearby countries saved on logistics costs. Other
                                                                                                          exporting countries like China and Pakistan too saw a decline in their exports to the US.
   •   The Children’s Place: A fixture at shopping malls, the children’s clothing retail said it will
       close hundreds of store locations by 2020 as part of a shift toward digital commerce.
                                                                                                          While the dip in the exports to US was seen across Indian players, aligning their business
   •   Gymboree: The kids clothing retailer confirmed last July that it would close 350 of its more       models that suited the changing needs of US customers led to a recovery in sales to the US
       than 1,200 store locations to streamline its business and achieve “greater financial               from latter half of 2018. With the impact of destocking subsuming and restocking
       flexibility,” according to CEO Daniel Griesemer.
                                                                                                          happening, the demand for the home textile products started increasing at a gradual rate
                                                                                                          and is expected to restore to normal levels. This was visible in the export numbers which
 Source: FoxBusiness
                                                                                                          saw a positive uptick and year-on-year improvement in sales at both country and company
                                                                                                          levels (Exhibit 19). The decline in volumes in the first-half is expected to be be made up in
                                                                                                          the second half, resulting in either flat or some market share gains for India.

January 6, 2019                                  Analysts: Vikas Jain (vikas.jain@equirus.com, 7574885492), Maulik Patel (maulik@equirus.com)                                         Page 9 of 10
Home Textiles Sector OVERWEIGHT
Exhibit 20: Sales pick-up in latter half made up for sharp decline in first half; 2018 to Exhibit 22: India’s terry towel exports to US recovered in H2, leading to flat market share
end with either marginal decline or flat sales
India China Pakistan Rest of World
Value Growth – YoY Jan-Jun'18 Jul-Oct'18 10M2018
100%
Cotton Sheets 16.2% 15.1% 15.6% 14.9% 15.1% 15.0% 15.7% 16.4%
90%
World -5% 4% -3% 80%
24.4% 22.4% 23.2% 22.7% 22.0% 22.0% 21.5% 20.1%
India -7% 7% -1% 70%
Terry Towels 60%
50% 26.2% 25.7% 25.8% 24.7% 23.1% 24.0% 24.8%
World -8% 9% -3% 24.8%
40%
India -17% 19% -5%
30%
Pillowcases 20% 38.3% 39.9% 38.8% 38.7%
34.6% 36.4% 35.6% 36.5%
World -7% 3% -3% 10%
India -14% 6% -6% 0%
2011 2012 2013 2014 2015 2016 2017 10M2018
Bedspreads
Market Share of countries in US's terry towels market
World 8% 14% 11%
Source: Otexa, Equirus Securities
India 17% 2% 10%
Source: Otexa, Equirus Securities
As seen in the exports data and also mentioned by managements of India’s top exporting
companies, the impact of destocking is coming to an end with retailers restocking to normal
Exhibit 21: India’s cotton sheets exports to US picked up in H2 resulting in some levels and demand picking up gradually. This is further supported by a decline in cotton
market share gains prices which stood at Rs 122/kg in Nov’18 from the peak levels of Rs 130/kg, and INR
India China Pakistan Rest of World depreciation at ~10.5% YTD-CY18. Furthermore, the increase in duty drawback rates of up
100% to 0.6% across major home textile products and extension of MEIS at 4% beyond Jun’30 for
16.0% 14.9% 12.7% 13.2% 12.5% 13.9% 14.1% 12.3% an indefinite period will further boost the recovery in the exports of home textile products.
90%
80% 16.8% 17.1% With demand returning to normalcy and favourable tailwinds kicking in, we expect strong
18.5% 17.7% 16.9% 15.9% 15.8%
70% 22.7% revenue growth for integrated and specialized home textile exports of India.
60% 23.7% 23.3% 23.0% 21.6% 20.3% 20.8%
21.7%
50% 23.4%
40%
30%
44.9% 45.9% 46.6% 47.8% 48.7% 49.7% 49.8%
20% 37.8%
10%
0%
2011 2012 2013 2014 2015 2016 2017 10M2018
Market share of countries in US's cotton sheets market
Source: Otexa, Equirus Securities
January 6, 2019 Analysts: Vikas Jain (vikas.jain@equirus.com, 7574885492), Maulik Patel (maulik@equirus.com) Page 10 of 10Welspun India Ltd.
Absolute : LONG
Relative : Overweight
Initiating Note Regular Coverage 23% ATR in 15 Months
Continued resilience in US market – Initiate with LONG Textiles
© 2018 Equirus All rights reserved Increasing penetration in the US market through a wide range of quality products has Consolidated Financials
Rating Information made Welspun (WLSI) one of the most preferred suppliers to global retailers. Post the Rs. Mn YE Mar FY18A FY19E FY20E FY21E
Price (Rs) 61 revenue decline caused by traceability issues & changing buying patterns, WLSI has Sales 60,506 65,649 74,183 85,310
Target Price (Rs) 77 emerged strong with several corrective actions and changes to business model. With EBITDA 11,234 11,177 14,021 16,294
Target Date 31st Mar' 2020 a set vision of Welspun 2.0 & nearing-end of the capex cycle leading to strong cashflow Depreciation 5,042 4,472 5,365 5,870
Target Set On 6th Jan'2019 generation, we expect growth to return with 12%/22% revenue/PAT CAGR and a Interest Expense 1,408 1,438 1,588 1,355
Implied yrs of growth (DCF) 15 ~380/385bps expansion in ROE/core ROIC over FY18-FY21E. We initiate coverage on
Other Income 812 796 891 941
Fair Value (DCF) 83 the stock with LONG and a Mar’20 TP of Rs 77.
Reported PAT 3,850 4,359 5,570 7,007
Fair Value (DDM) 27 Leading home textile player, well-poised to benefit from changing industry Recurring PAT 3,850 4,359 5,570 7,007
Ind Benchmark SPBSMIP dynamics: WLSI is India’s leading home textile exporter to the US to the extent that Total Equity 26,057 29,102 33,584 39,140
Model Portfolio Position NA every 5th towel and every 10th sheet sold in the US is made by Welspun. WLSI has been Gross Debt 32,807 34,607 30,807 25,307
proactive in adjusting its business model to cotton traceability issues and changing Cash 2,661 2,771 3,292 5,033
Stock Information
customer buying patterns. With a series of steps taken to respond to changing industry Rs. Mn YE Mar FY18A FY19E FY20E FY21E
Market Cap (Rs Mn) 61,138
dynamics, enhanced focus on increasing revenue share from underpenetrated markets
Free Float (%) 31.52 % Earnings 3.8 4.3 5.5 7.0
and innovative product rollouts, we expect the company to post a 12% revenue CAGR
52 Wk H/L (Rs) 82.5/48.8 Book Value 26 29 33 39
over FY18-FY21E.
Avg Daily Volume (1yr) 25,45,278 Dividends 0.7 0.7 0.9 1.2
Avg Daily Value (Rs Mn) 156 Three pillars to next phase of growth: WLSI has carved out its vision Welspun 2.0 which FCFF 3.2 0.8 6.6 10.1
Equity Cap (Rs Mn) 1,005 articulates strategies for achieving growth. Apart from increasing its market share in the P/E (x) 15.9 14.0 11.0 8.7
Face Value (Rs) 1 US, the company will look at driving revenues by (a) launching new products/channels P/B (x) 2.3 2.1 1.8 1.6
Bloomberg Code WLSI IN (tile carpets, fashion & utility bedding, hospitality & healthcare), (b) entering new EV/EBITDA (x) 8.5 8.7 6.6 5.2
markets and scaling up existing markets (Europe & India) and (c) improving the share of ROE (%) 15 % 16 % 18 % 19 %
Ownership Recent 3M 12M
innovative & branded products (from 37% in FY18 to a target of more than 50% by 2022). Core ROIC (%) 7% 7% 9% 11 %
Promoters 68.5 % 0.0 % -5.0 %
DII 10.1 % 2.4 % 8.6 % Cashflows generated from FY20 to reduce debt levels, boost margins: By installing EBITDA Margin (%) 19 % 17 % 19 % 19 %
FII 7.3 % -0.1 % -4.4 % the flooring plant by FY20, WLSI is expected to end its multi-year capex cycle. Post Net Margin (%) 6% 7% 8% 8%
Public 14.1 % -2.3 % 0.8 % this, cashflows generated from the business will be utilized for debt repayment, which
in turn would boost margins. While EBITDA margins are expected to remain flattish on
Price % 1M 3M 12M
a gradual pickup in flooring operations, debt repayment and lower depreciation should
Absolute 1.0 % 9.5 % -14.5 % aid PAT margins. We have built in an 50bps/185bps expansion in EBITDA/PAT over
Vs Industry -1.9 % 1.4 % 1.7 % FY18-FY21E with a ~380bps /385bps expansion in RoE/RoCE.
Trident 0.2 % 18.4 % -26.0 %
Indocount -6.2 % -6.7 % -53.2 % Initiate with LONG, Mar’20 TP Rs 77: WLSI currently trades at 6.5x FY20 EV/EBITDA
Consolidated Quarterly EPS forecast
and a P/E of 11x FY20E EPS. With uncertainties settling down, volumes picking up and
Rs/Share 1Q 2Q 3Q 4Q debt levels reducing, we expect a strong bounce-back in the stock. Initiate coverage
with LONG and a PT of Rs 77 set at 7.5x Mar’20 EV/EBITDA.
EPS (18A) 1.3 1.0 0.8 0.9
EPS (19E) 1.3 1.2 0.9 0.9
January 6, 2019 Analysts: Vikas Jain vikas.jain@equirus.com (+91-7574885492)/ Maulik Patel maulik@equirus.com(+91-8128694110) Page 1 of 25
Before reading this report, you must refer to the disclaimer on the last page.Welspun India Ltd. Absolute – LONG Relative – Overweight 23% ATR in 15 Months
Company Snapshot Key Triggers
• Quick settlement of uncertainties, strong acceptance of flooring products, rise in
How we differ from Consensus
Comment
penetration in Indian & European markets.
- Equirus Consensus % Diff
FY19E 4.3 4.5 -3 % Debt reduction in FY20 and a pick-up in Sensitivity to Key Variables % Change % Impact on EPS
EPS efficiencies of recently-expanded
FY20E 5.5 5.8 -4 % Revenue 1% 2%
capacities to boost earnings growth
FY19E 65,649 66,560 -1 % EBITDAM 1% 8%
Sales
FY20E 74,183 74,935 -1 %
- - -
FY19E 4,359 4,496 -3 %
PAT DCF Valuations & Assumptions
FY20E 5,570 5,782 -4 %
Rf Beta Ke Term. Growth Debt/IC in Term. Yr
Our Key Investment arguments:
7.4 % 1.3 11.8 % 4.0 % 31.1 %
• Leading home textile exporter to benefit the most from changing industry dynamics.
• The vision of Welspun 2.0 will enable the company to strategize its energies towards
- FY19E FY20E FY21-23E FY24-28E FY29-33E
attaining the next phase of growth.
Sales Growth 9% 13 % 9% 8% 8%
• Capex cycle would end by FY20E, and cash flows generated thereafter would
NOPAT Margin 7% 8% 9% 9% 9%
significantly bring down debt levels.
IC Turnover 0.98 1.11 1.45 1.44 1.30
• Expect RoE/RoIC to expand ~380/ 385bps over FY18-FY21E.
RoIC 7.5 % 9.1 % 13.7 % 14.4 % 12.6 %
• At 6.5x EV/EBITDA and 11x P/E for FY20 EPS, valuations are attractive for a market leader.
Key Assumptions: Years of strong growth 1 2 5 10 15
Particulars FY18 FY19 FY20 FY21 Valuation as on date (Rs) 32 40 67 71 72
Capacity Utilization Valuation as of Mar'20 37 46 76 81 83
Towels 80% 87% 93% 88%
Based on DCF, assuming 15 years of 8% CAGR growth and 13% average ROIC, we derive our
Cotton Sheets 80% 85% 90% 88% current fair value of Rs 72 and our 31 Mar’20 fair value of Rs 83.
Rugs & Carpets 65% 70% 80% 85%
Flooring - - 10% 30% Company Description:
Welspun is India’s largest home textile company with a presence in cotton bedsheets,
Gross Margin (%) 50% 49% 50% 50% towels and rugs & carpets. It is Asia's largest and the world’s 2nd largest terry towel
Capex (In Rs Mn) 2,873 9,000 5,000 2,000 producer. It exports more than 94% of its home textile products to >50 countries, with >68%
Risk to Our View: Extended uncertainty related to customer shift towards the online of production to the US, 23% to Europe and the balance to Middle East, Australia & Japan.
platform, low acceptance of flooring products, sluggish cashflow generation & subsequent It supplies to 17 of the top-30 retail chains in the world.
delay in debt reduction, INR appreciation & rise in cotton prices.
Comparable valuation EPS P/E BPS P/B RoE Div Yield
Mkt Cap Price
Company Reco. CMP Rs. Mn. Target Target Date FY18A FY19E FY20E FY18A FY19E FY20E FY18A FY19E FY18A FY19E FY20E FY18A FY19E
Welspun India LONG 61 61,138 77 31st Mar' 2020 3.8 4.3 5.5 15.9 14.0 11.0 25.9 2.1 15 % 16 % 18 % 1.1 % 1.2 %
Trident NA 67 34,016 NA NA 5.3 7.3 8.4 12.6 9.2 7.9 57.7 1.1 9% 12 % 12 % 0.9 % 1.9 %
Indocount NA 57 11,183 NA NA 6.4 6.0 7.1 8.9 9.5 7.9 48.4 1.1 14 % 11 % 12 % 1.4 % 1.3 %
January 6, 2019 Analysts: Vikas Jain vikas.jain@equirus.com (+91-7574885492)/ Maulik Patel maulik@equirus.com(+91-8128694110) Page 2 of 25Welspun India Ltd. Absolute – LONG Relative – Overweight 23% ATR in 15 Months
Initiate with LONG Exhibit 2: WLSI contributes ~50% of India’s total towel exports to the US
One of Asia’s largest home textile players 55%
50%
WLSI is Asia’s largest home textile company with a presence in cotton bedsheets, towels 50%
and rugs & carpets. The company has a towel manufacturing capacity of 80,000 MTPA, the 45%
41%
second highest after Trident India which has an installed capacity of 90,000MTPA but at a
40%
lower utilization rate (45% in FY18 vs. 80% for WLSI). In bedsheets, WLSI’s installed capacity
stands at 90mn meters similar to Indo Count (90mn meters). 35%
30%
WLSI operates two state-of-the-art manufacturing facilities in Gujarat (Anjar and Vapi)
CY13 CY17
with ~70% integration of its yarn and fabric requirements. It also has a 80MW captive power
plant at Anjar which meets its power requirements. Apart from India, WLSI has warehouses Source: Welspun Investor Presentation, Equirus Securities
in the US, the UK and Germany, which ensure quick delivery to retailers.
Exhibit 3: Every 10th sheet sold in the US is made by WLSI
Almost 85-87% of WLSI’s revenues come from B2B channels with supplies to large retailers 12%
10%
in the US, the UK, Europe and others. The remaining 13-15% of revenues come from B2C 10%
sales under the brands Spaces (domestic market) and Christy (largely UK market).
8% 7%
Lion’s share in world’s largest home textile market 6%
4%
India is the largest home textile player in the US market with a ~38% market share in US
2%
towel market (up from 30% in 2009) and a ~50% market share in the US sheets market (up
from 27% in 2009). Of the current market share of India in the US market, WLSI commands 0%
CY13 CY17
a dominant position with the company contributing ~50%/~21% of India’s towel/bedsheet
exports to the US. Source: Welspun Investor Presentation, Equirus Securities
Exhibit 4: WLSI contributes ~21% of India’s total sheet exports to the US
Exhibit 1: Every 5th towel sold in the US made by WLSI
25%
19% 21%
20%
20%
18% 16%
16% 15% 15%
14% 10%
12% 5%
10%
CY13 CY17 0%
CY13 CY17
Source: Welspun Investor Presentation, Equirus Securities
Source: Welspun Investor Presentation, Equirus Securities
January 6, 2019 Analysts: Vikas Jain vikas.jain@equirus.com (+91-7574885492)/ Maulik Patel maulik@equirus.com(+91-8128694110) Page 3 of 25Welspun India Ltd. Absolute – LONG Relative – Overweight 23% ATR in 15 Months
Exhibit 5: Industry home textile players — A snapshot
Backward Integration Total Revenues Home textile Revenues EBTIDA Margins
Companies Home textile segment & capacity
level (FY18, In Rs Bn) (FY18, In Rs Bn) (FY18)
Bath linen (Towels - 80,000 MT, Bed linen (Sheets - 90mn metres)
Welspun India Largely Integrated 60.5 60.5 (100%) 18-19%
& Rugs - 10mn sq. metres
Trident Bath linen (Towels – 90,000 MT) and Bed linen (Sheets - 43.2mn metres) Largely Integrated 46.7 22.4 (48%) 19-20%
Himatsingka Seide Bed linen (Sheets - 46mn metres), Drapery & Upholstery - 2mn metres Largely Integrated 22.5 22.5 (100%) 17-18%
Indo Count Bed Linen (Sheets - 90 mn meters) Outsourced 19.6 19.6 (100%) 14-15%
Source: Company, Equirus Securities
Over the years, WLSI has increased its market share in the US led by superior products with Egyptian cotton issue a thing of the past, but lessons well learnt
supplies to almost all big retailers which account for majority of home textile sales in the
Egyptian cotton is considered to be the best type of cotton in the world because of its long
US. These market share gains were achieved despite high competition from Chinese players
fiber that makes it softer and stronger. Lack of Egyptian government’s intervention on
in the US and from a number of home textile players in India as well. This was achieved
regulation of cotton and rapidly declining supplies of authentic long-staple quality Egyptian
due to the following:
cotton (1.4mn bales in 2004-05 vs. only 0.18mn bales in 2016-17) has led to its scarcity.
Apart from Egypt, there are many countries (including India, US, Peru, Israel and China)
Factors driving WLSI’s market share gains in the US
who on the basis of technological advancements, are able to produce long-staple cotton
• Wide range of products offered in the home textile segment — bath linen (towels, bath robe),
on similar lines as Egyptian cotton with similar quality and strength. Multiple procurement
bed linen (sheets, basic and fashion bedding) and flooring solutions (carpets & rugs).
sources and large number of suppliers have led to fraudulent varieties making their way
• World class manufacturing facilities capable of serving bigger orders in terms of order sizes
into world markets.
and SKUs at competitive prices.
• High customer satisfaction leading to repeat business from retailers; 80% of WLSI’s orders are
In Aug’16, Target, one of WLSI’s major customers discontinued its entire business with the
replenishment orders.
company, alleging that WLSI used fake Egyptian cotton in bedsheets and pillowcases which
were labelled to be made of ‘100% genuine Egyptian cotton’. The claim was made based
These qualities make WLSI a preferred supplier of home textile products among most of its
on an audit conducted by Target which could not determine the traceability of cotton used
customers, thus leading to a higher wallet share.
in these products.
The Indian textile industry is highly fragmented with several unorganized suppliers
dominating the space. Big companies like WLSI, who have to depend on them for their yarn
requirements, find it difficult to keep a tab on such a large number of unorganized
suppliers. This along with shortage of genuine Egyptian cotton may have led to this issue.
January 6, 2019 Analysts: Vikas Jain vikas.jain@equirus.com (+91-7574885492)/ Maulik Patel maulik@equirus.com(+91-8128694110) Page 4 of 25Welspun India Ltd. Absolute – LONG Relative – Overweight 23% ATR in 15 Months
To deal with the traceability issue of cotton, WLSI developed a complete end-to-end fiber
Series of steps taken to integrate processes post the Egyptian cotton issue tracking process that verified fibers from the origin and at every stage of production,
WLSI took a number of structural, technological, procedural and people steps based on the ensuring rigorous process control of the fiber’s physical parameters. Additionally, WLSI has
recommendations of E&Y — appointed as an individual consultant to improve WLSI’s production and
also tied up with Oritain Global, a world leader in the use of scientific traceability. This
procurement processes. partnership provides independent validation of WLSI’s supply chain by using a method of
chemical fingerprinting to identify the origin of cotton fiber used for its home textile
• Structural steps: Improvement in the procurement process through vertical integration of products. This exclusive tie-up with Oritain’s traceability technology supplements Wel-
manufacturing units (including ancillary units) along with procuring cotton from certified Trak, and demonstrates WLSI’s commitment to full transparency and traceability of its
sources to ensure that only genuine cotton enters into the system via better tracking — right home textile products throughout the supply chain.
from procurement to the finished stage. WLSI also deployed personnel at Egypt to oversee
buying activities. Apart from these production process-related changes, WLSI also carried out a number of
• Technological steps: Using SAP-based of material and usage of RFID to track cotton through steps to reach out to its retailers and address their concerns — ranging from product recalls,
the entire manufacturing process. product replacements, product reviews and product relabeling.
• Procedural steps: Separating planning & verification of Egyptian cotton, keeping buffer Right measures pay off — All customers barring Target retained
stock to manage rush orders, obtaining Gold seal certification from Cotton Egypt Association
With unfolding of the Egyptian cotton issue, along with Target (which contributed ~10% of
(CEA), increasing audits and surprise visits to vendor facilities along with 3rd party DNA
revenues), business from other customers was also impacted to the extent of product
testing.
supplies which were claimed to be fake; this led to an overall impact of ~13% on revenues.
• People steps: Segregating the duties of personnel to avoid any procedural lapse. Barring Target, business from other customers was restored to earlier levels by adopting a
series of corrective steps and addressing their concerns.
Exhibit 6: WEL-TRACKTM: A traceability solution process supplemented by OritainTM is
Well-poised to leverage on changing business dynamics
the most comprehensive end-to-end fiber tracking process
Change in buying patterns impacts overall demand
Aggressive marketing & promotions by giant online players along with convenience of
getting the product delivered to the doorstep has led to a major shift in buying patterns of
buyers. This along with an influx of online startups coming up with offerings in segments
like electronics, kids wear, toys, and menswear has totally changed the buying patterns of
customers in various segments. Additionally, series of discounts and offers conducted by
online retailers like Amazon and others has attracted masses to buy goods online.
The home textiles segment, unlike other industries like electronics, books and apparels
(which saw ~70% of sales moving online) saw relatively lower volumes moving online.
Source: Welspun Investor Presentation, Equirus Securities According to industry estimates, 10-15% of home-textile sales have shifted to the online
platform. This was partly contributed by new online startups offering attractive discounts
and also due to lower footfalls in stores of big retailers as most other products were
purchased online.
January 6, 2019 Analysts: Vikas Jain vikas.jain@equirus.com (+91-7574885492)/ Maulik Patel maulik@equirus.com(+91-8128694110) Page 5 of 25Welspun India Ltd. Absolute – LONG Relative – Overweight 23% ATR in 15 Months
Just like any trend picks up pace in initial stages and gradually wanes with time, we expect WLSI also adjusted its retail model in commensuration with big retailers. For instance,
this trend of online buying picking up from current 10-15% levels to 20-25%, and then some retailers trimmed on inventory levels and pushed manufacturers to carry inventory
stabilizing at those levels. European markets, which are comparatively more mature than on their behalf. Another change included retailers asking manufacturers to ship goods
the US, had experienced similar changes and settled at these levels. Additionally, home directly to customers. WLSI, being a large-scale manufacturer, was able to adopt to such
textile products warrant the element of touch & feel and are totally different from changes as it owns three warehouses in the UK, the US and Germany where it could store
electronics like mobile phones wherein 70-80% of sales can move online. finished goods on behalf of retailers (at an extra carrying cost) while having tie-ups with
Welspun makes amends, effectively takes on the ecommerce challenge! logistics chains that can deliver goods directly to customers (at an added cost to retailers).
Small and unorganized players from India as well as other countries finding it difficult to
WLSI, being the largest exporter of home textile products to the US, was also impacted by
operate with such changing needs will have to curtail business from these retailers, leading
this shift and the subsequent destocking by almost all retailers. In accordance with
to incremental orders to players like WLSI who would gain market share.
retailers, manufacturers like WLSI had to make significant changes in their business models.
Three pillars for next phase of growth
Steps taken by WLSI to tap the ecommerce opportunity
WLSI has a strong growth track record stemming from organic expansion with increasing
• Key ecommerce platforms
Key e-commerce platforms have increased the share of private labels to capture more value,
penetration in the US market through its wide range of quality products. Over time, WLSI
cater to increased volumes and have a better control over products. WLSI is increasing its has changed its offerings as per customer needs, thus remaining a preferred supplier to
focus on being a preferred sourcing partner for private labels of such ecommerce platforms. most of the global retailers for the last three decades. The company’s revenues have grown
at an impressive 21% CAGR over FY11-FY17 (even as FY18 revenues slid due to retailer-
• Big-Box retailers’ website
WLSI has been a preferred supplier to almost all giant retail chains and shared strong
level destocking) with EBITDA margins expanding from ~11% in FY11 to reach a peak of 27%
relationships will them for last many years. With buyers moving online for purchases, these in FY16; margin expansion was the result of a number of steps taken by the company
retailers have turned aggressive in online sales. WLSI as adopted to sell its products with a towards backward integration and enhancing the efficiency of operations.
presence on websites of these retailers. It also includes providing omni-channel support to
retailers on product development, warehousing, pick & pack, drop-ship and analytics. As a preferred supplier to many retailers with a strong track record, WLSI has gained market
Welspun has also signed a deal with Amazon to supply its products under Amazon’s private share in the US (~19% in towels, ~10% in sheets) over the years. While there is further scope
label, Amazon Basics, with shipping to happen in the next 1-2 quarters. for WLSI to grow its revenues by gaining market share in towels, sheets and rugs, this may
• WLSI’s own website, Shopwelspun.com not be sufficient to achieve the next phase of growth in the coming years. In FY16, WLSI
WLSI has become aggressive on its own website to sell branded products. It also tried to worked out its vision for Welspun 2.0 with a financial target to achieve revenue of US$ 2bn
increase its brand presence through its website across key markets. by 2020, which was later revised to 2022 due to many one-off events (duty drawbacks,
• Exclusive online D2C players dealer de-stocking) in FY18.
With online trend picking up, there was an influx of startups coming up in the home textile
market as well as those working on direct-to-customer sales. WLSI has acquired a minority As a part of the vision ‘Welspun 2.0’, WLSI has identified the following three broad areas
stake (for US$ 4mn) in two start-up firms to understand their functioning, strategy and which would drive the next leg of growth:
financials. Learnings gathered will be helpful at the time of launching new brands or a new
a) New products/categories along with new channels
online channel.
b) New markets/scaling up existing markets
c) Improving share of innovative & branded products
January 6, 2019 Analysts: Vikas Jain vikas.jain@equirus.com (+91-7574885492)/ Maulik Patel maulik@equirus.com(+91-8128694110) Page 6 of 25Welspun India Ltd. Absolute – LONG Relative – Overweight 23% ATR in 15 Months
a) Pillar 1: New products/categories along with new channels • Untapped opportunities in bedding category
• Increasing share of flooring products with ongoing capacity expansion Though a large portion of WLSI’s revenues comes from sheets, it does have some
presence in basic and fashion bedding business. As per management, there is a large
WLSI entered into the carpet category in FY14 with an initial capacity of 6mn sq. meters
untapped opportunity in categories like basic bedding, comforters and quilts.
with product offerings in decorative carpets and area rugs. Initially, it invested in
Currently, China dominates this market but with an increase in China’s cost of
building rugs capacity as many customers preferred buying rugs of similar patterns and
production and rising preference for quality, India is gradually making inroads into this
colors as towels, and accordingly retailers also sold towels and rugs in combos. Later, as
segment. WLSI, being the largest player, is expected to benefit from this shift. Bedding
a category extension, WLSI started manufacturing carpets for living areas and under-the-
contributed ~3% of sales (~Rs 1.8bn) in FY18.
table carpets. With good customer response, it increased capacity to 10mn sq. meters
in FY18. The entire flooring segment (carpets & rugs) contributes ~10% of total revenues.
• Technical/advanced textiles: Another big opportunity
As a part of its vision, WLSI has identified the flooring business as an important driver In the past, there has been strong demand growth for technical/advanced textiles with
for revenue growth. Apart from the existing offerings, the company is venturing into specialized applications such as healthcare, fire departments, aerospace, defense,
tile carpets. The domestic market size for tile carpets is estimated to be ~US$ 100mn automobile, railways and others. These products are made with specialized features
with a potential to grow to US$ 500mn. Target customers for its flooring products such as being fire retardants, stain resistant, anti-bacterial, PET resistant and soil
would be both institutional and residential. resistant.
WLSI ventures into tile carpets — the story so far WLSI is gradually expanding its product portfolio in technical/advanced textiles with
products such as Welicate baby care wipes, personal care wipes, household wipes and
• Despite a growing market for tile carpets, there are no big domestic players in this segment
medical wipes. Recently, the company’s products were approved by a major
in India; most home textile players are evolving with a major focus on using existing
automobile company, and its fabric by an airline industry in US and Europe. WLSI also
capacities for bedsheets and towels to serve the global market.
won a contract to supply pillow covers and napkins to Rajdhani trains in India. The
• WLSI, being one of the most evolved players, has identified this space and planned a capex company currently derives ~2% or Rs 1.2bn revenues from this segment, which we
of ~Rs 11bn to set up a carpet manufacturing plant of 27mn sq. meters in Telangana, AP; believe can surely scale up owing to its R&D and product development capabilities.
this was against a ~Rs 6bn capex planned for a 7mn sq. meters capacity at Anjar, Gujarat
earlier, with the shift in plant location stemming from attractive terms offered by the
• New channels: Entering healthcare and hospitality sectors
Telangana government. Construction work for this facility has already started and should be
completed by mid-FY20; a major part of the capex would be incurred in FY19. Revenue Though WLSI has a large customer base operating on a global scale, it has continued to
contribution from this plant should start flowing in from 3QFY20. focus on increasing its market by adding new channels. Apart from traditional channels
for selling products to retailers under private labels, the company has identified
• The new facility will cater to wall-to-wall and tile carpets. In contrast to traditional floor
hospitality and healthcare as new channels to drive revenues.
carpets, tile carpets come in small pieces which offer the convenience to wash only a small
part of the carpet (with stains for instance) vis-à-vis the entire carpet earlier, saving customers
significant time and energy on this tedious job. The US hospitality market is estimated to be ~US$ 1.5bn in size (for towels and sheets)
and is fast expanding with improving standards of living and disposable incomes. WLSI
• In India, a large proportion of tile carpets are imported, which attract 25-30% import duty.
currently earns ~US$ 50mn from this category, indicating huge growth potential. It has
WLSI, being one of the first players to have such a carpet manufacturing facility, would see
tie-ups with hotel chains like Starwood, Hilton and the Taj, and is further looking to
a significant boost to its revenues and margins.
tie up with the Intercontinental Hotel Group (IHG), Accor Group and Marriott
International.
January 6, 2019 Analysts: Vikas Jain vikas.jain@equirus.com (+91-7574885492)/ Maulik Patel maulik@equirus.com(+91-8128694110) Page 7 of 25You can also read