HHS Public Access Author manuscript Environ Res. Author manuscript; available in PMC 2022 April 01.
←
→
Page content transcription
If your browser does not render page correctly, please read the page content below
HHS Public Access
                                Author manuscript
                                Environ Res. Author manuscript; available in PMC 2022 April 01.
Author Manuscript

                    Published in final edited form as:
                     Environ Res. 2021 April ; 195: 110758. doi:10.1016/j.envres.2021.110758.

                    Household low pile carpet usage was associated with increased
                    serum PFAS concentrations in 2005-2006
                    Yachen Zhu1, Annie Ro1, Scott M. Bartell1,2,3
                    1.Program     in Public Health, University of California, Irvine, CA 92697-3957, USA
                    2.Departmentof Environmental and Occupational Health, University of California, Irvine, CA
                    92697-1250, USA
Author Manuscript

                    3.Department      of Statistics, University of California, Irvine, CA 92697-1250, USA

                    Abstract
                         Background: Per- and polyfluoroalkyl substances (PFAS) are ubiquitous in the serum of the
                         general US population. Food, drinking water, consumer products, dust, and air have been assessed
                         as PFAS exposure sources for humans. The effects of various types of carpeting on serum PFAS
                         concentrations have been less studied, despite the known use of PFAS in stain-resistant carpet
                         treatments.

                         Objective: This study aimed to examine the associations between serum PFAS concentrations
                         and type of residential flooring among the general US population aged 12 years and older using
                         the 2005–2006 National Health and Nutrition Examination Survey (NHANES).
Author Manuscript

                         Methods: We used multiple linear regressions adjusted for complex survey design and relevant
                         covariates to analyze the relations between serum PFAS concentrations and type of floor covering
                         (smooth surface, low pile carpet, medium to high pile carpet, and combination of carpet and
                         smooth surface), as well as other potential exposure factors. We used multiple imputation to
                         address missing values.

                         Results: We found significantly higher serum concentrations of perfluorohexane sulfonic acid
                         (PFHxS) and 2-(N-methyl-perfluorooctane sulfonamido) acetic acid (MeFOSAA) in US residents
                         residing in homes with low pile carpeting compared with those residing in homes with smooth
                         surface. We concluded that among US residents aged 12 years and older residing in homes with
                         low pile carpeting in the home in 2005–2006, on average 24% and 19% of the PFHxS and
                         MeFOSAA body burdens, respectively, could be attributed to carpeting. We found associations
Author Manuscript

                         between other types of floor covering (medium to high pile carpet, combination of carpet and

                    Corresponding Author: Scott M. Bartell, Department of Environmental and Occupational Health, Program in Public Health, University
                    of California, Irvine, Irvine, CA 92697-1250, USA, sbartell@uci.edu.
                    CRediT Author Statement
                    Yachen Zhu: Conceptualization, Writing - Original Draft, Methodology, Investigation, Formal Analysis
                    Annie Ro: Methodology, Writing - Review & Editing
                    Scott Bartell: Conceptualization, Methodology, Supervision, Writing - Review & Editing, Funding Acquisition
                    Declaration of competing interest:
                    Scott M. Bartell serves as a compensated expert witness for PFOA medical monitoring lawsuits in New Hampshire. The terms of this
                    arrangement were reviewed and approved by the University of California, Irvine in accordance with its conflict of interest policies.
                    Annie Ro and Yachen Zhu declare no conflicts of interest.
Zhu et al. Page 2
smooth surface) and some PFAS concentrations compared with the smooth surface, but these
Author Manuscript
results were less consistent and generally not statistically significant. Additionally, a group Wald
Chi-squared test showed a significant result for PFOS, indicating different contributions of various
types of flooring to PFOS serum concentration.
Significance: Our results are representative of the general US population at the time of the
survey, and potentially informative regarding ongoing PFAS exposure from a variety of sources
including carpeting.
Keywords
PFAS exposure; carpeting; serum; sampling survey
Introduction
Author Manuscript
Per- and polyfluoroalkyl substances (PFAS) are a group of human-made chemicals that
widely exist in the environment, biota, and humans. Due to the strong single bond between
carbon (C) and fluorine (F), which requires very high energy to dissociate, PFAS have
unique physiochemical characteristics such as stability in extreme temperatures and water
resistance (Faithfull and Weers, 1998). Strong carbon-fluorine bonds also make PFAS
resistant to hydrolysis, microbial degradation, and metabolism by vertebrates (ATSDR,
2018). Therefore, they have been used in a variety of applications, including textiles,
carpeting, food packaging, nonstick cookware, and firefighting foams (Kissa, 2001). They
persist indefinitely in the environment and bioaccumulate in humans and organisms (Buck et
al., 2011). For example, the average half-lives for serum or plasma elimination of PFAS in
humans were reported as about 2–4 years for perfluorooctanoic acid (PFOA) (Bartell et al.,
2010; Olsen et al., 2007; Worley et al., 2017), 3–27 years for perfluorooctane sulfonic acid
Author Manuscript
(PFOS), 5–35 years for PFHxS (Olsen et al., 2007; Worley et al., 2017; Li et al., 2018;
Zhang et al., 2013), and 2–4 years for perfluorononanoic acid (PFNA) (Zhang et al., 2013)
in previous studies. Some studies have found associations between PFAS and a series of
adverse health effects such as reduced fecundity (Vélez et al., 2015), low birthweight
(Johnson et al., 2014), and cancers (Vieira et al., 2013).
Perfluoroalkyl carboxylic acids (PFCA, e.g., PFOA and PFNA) and perfluoroalkane sulfonic
acid (PFSA, e.g., PFOS and PFHxS) both belong to perfluorinated acids (PFA) in the PFAS
family (Buck et al., 2011; D’eon and Mabury, 2011). Long-chain PFAS (PFCA with ≥8
carbons and PFSA with ≥6 carbons) have been shown to be more bioaccumulative than their
short-chain analogues (Martin et al., 2003; Olsen et al., 2009), and therefore have attracted
more attentions from the global scientific and regulatory community (Buck et al., 2011; US
Author Manuscript
EPA, 2009). There are two main methods to produce PFAS: electrochemical fluorination
(ECF) and telomerization. The ECF method was used by the 3M Company from 1949 to
2001 to manufacture perfluorooctanesulfonyl fluoride (POSF)-based materials (including
PFOS, MeFOSAA, EtFOSAA, and high-molecular-weight fluorinated polymers), PFCA
(such as PFOA and PFNA) and their ammonium salts (Beesoon et al., 2011; Buck et al.,
2011; D’eon and Mabury, 2011). The ECF technique resulted in a mixture of linear (70–
80%) and branched (20–30%) isomers, while the telomerization method initially developed
by the DuPont Company in the 1970s produced almost completely linear isomers. Starting
Environ Res. Author manuscript; available in PMC 2022 April 01.Zhu et al. Page 3
from 2002, the 3M Company, the major global manufacturer of PFOA, PFOS and related
Author Manuscript
perfluorooctanesulfonyl fluoride compounds, ceased its production of these substances using
the ECF technique due to health concerns, and has since introduced short-chain
perfluoroalkane sulfonates and products such as perfluorobutane sulfonic acid (PFBS)
(Zushi et al., 2012). In 2006, EPA initiated a global stewardship program to achieve a 95%
reduction in PFOA and its precursors by 2010, and work towards the elimination of these
chemicals by 2015. During this time the manufacture of PFOA, PFOS and their precursors
was largely relocated to Asia, especially China (UNEP, 2015; Yue, 2008), where other
manufacturers continued to use the ECF process to develop these substances (Buck et al.,
2011). Unlike PFOS, which was almost solely produced using the ECF technique, PFOA
could be manufactured through not only the ECF method, but also telomerization, which
was still in use after 2002 to produce fluorotelomer-based chemicals including
polyfluoroalkyl phosphate esters (PAPs) and PFOA linear isomers. Additionally, some
Author Manuscript
fluorotelomer-based materials such as PAP diesters (diPAPs) can be enzymatically
hydrolyzed to produce 8:2 fluorotelomer alcohol (8:2 FTOH), an intermediate metabolite
that is subsequently transformed into perfluoroalkyl carboxylic acids (PFCA) such as PFNA,
PFOA, and PFHpA (Buck et al., 2011; D’eon and Mabury, 2007; D’eon and Mabury, 2011).
NHANES data have accordingly shown a significant downward trend in serum
concentrations of PFOS and PFHxS in the general US population since 1999 (Calafat et al.,
2007; Kato et al., 2011). However, PFOA did not decline as much as expected after the
phase-out by 3M (Olsen et al., 2008; Beesoon et al., 2011) and remained essentially
unchanged, and may have increased during 2003–2008 in the US (Kato et al., 2011) before
declining slowly since 2008 (CDC, 2019). The percentage of linear isomer for PFOA was
also found to be increasing during 1997–2012 in Sweden, indicating the ongoing production
of fluorotelomer-based chemicals (Gebbink et al., 2015).
Author Manuscript
According to the Carpet and Rug Institute, most commercial and residential carpets and rugs
in the US have been treated with perfluorooctane sulfonyl fluoride (POSF)-based materials
in the manufacturing process to achieve stain resistance (DTSC, 2018). For example,
sulfonamido-ethanol (MeFOSE) is a raw material used in textile and carpet products, and
can be metabolized into MeFOSAA (aka M570), a precursor of PFOS; PFOS was a key
ingredient in Scotchgard and had been extensively produced for use in carpet treatment until
the phase-out. Perfluorohexane sulfonyl fluoride (PHxSF)-based derivatives such as PFHxS
had also been produced by the 3M Company until the phase-out parallel to the phase-out of
POSF-based products, and was used in specific postmarket carpet treatment products (Wang
et al., 2014; Olsen et al., 2003). In 2009, PFOS and its precursors were added to Annex B of
Stockholm Convention on Persistent Organic Pollutants (POPs). While this is an important
step to restrict the production and use of PFOS and its precursors, a list of specific
Author Manuscript
exemptions associated with this treaty still allows the mass production and almost all the
historic uses of PFOS and its precursors, including the use in carpets, leather and apparel,
textiles and upholstery, paper and packaging, coating and coating additives, and so forth
(UNEP, 2010).
Dust ingestion has been associated with stain-resistant treatment of carpets or rugs, which is
an important pathway for PFAS exposure (D’Hollander et al., 2010; Beesoon et al., 2012;
Harris et al., 2017; Hu et al., 2018; Hurley et al., 2018; Karásková et al., 2016). Previous
Environ Res. Author manuscript; available in PMC 2022 April 01.Zhu et al. Page 4
studies have indicated the ubiquitous presence of diPAPs, 8:2 FTOH, PFCA, and some
Author Manuscript
POSF-based materials in indoor dust or air, which could come from consumer products such
as carpets, upholstery, and textiles (De Silva et al., 2012; Fraser et al., 2012; Kato et al.,
2009; Strynar et al., 2008; Winkens et al., 2018; Kubwabo et al., 2005). In a Canadian study
conducted by Shoeib et al. (2005), MeFOSE and N-ethylperfluorooctane
sulfonamidoethanol (EtFOSE) were detected at the median concentrations of 110 ng/g and
120 ng/g in indoor air, respectively, 10–20 times higher than their outdoor concentrations.
EtFOSE is a POSF-based raw material used in paper and packaging products, and it can be
metabolized into EtFOSAA (Buck et al., 2011). Both EtFOSAA and MeFOSAA are
precursors of perfluorooctane sulfonamidoacetic acid (FOSAA, aka M556), perfluorooctane
sulfonamide (FOSA), and PFOS. A US study by Strynar and Lindstorm (2008) found
ubiquitous existence of PFOS and PFOA in house dust, with median concentrations of 201
and 142 ng/g, respectively. 8:2 FTOH, an important precursor for PFOA, was also detected
Author Manuscript
with a maximum concentration of 1660 ng/g in the house dust. These results from previous
studies highlight the potential of house dust and air as important pathways for human PFAS
exposure.
Despite efforts to remove PFOA, PFOS, and PFOS precursors (MeFOSAA and EtFOSAA)
produced using the ECF method, telomerization continued to be used to manufacture PFOA
and related chemicals after the 2002 phase-out. A recent review paper revealed the large
uncertainty about the amount of PFAS manufactured and imported due to the fact that a
large part of the amounts has been claimed as confidential business information (CBI) and
only substances manufactured or imported at above 11.34 tonnage per year at a single site
have been reported (Glüge et al., 2020); also, PFAS that can break down into PFOA and
PFOS are still in use in the US (BloombergLaw, 2020). Additionally, commercial and
residential carpets treated with POSF-based materials such as MeFOSAA, PFOS, and
Author Manuscript
PFHxS may not be replaced as frequently as other products. Thus, the PFAS-treated carpets
before the phase-out may continue to be used in households and commercial settings.
Besides, some short-chain PFAS have been introduced as alternative chemicals to long-chain
PFAS (Birnbaum et al., 2015; Gomis et al., 2018). For example, PFBS has been extensively
produced and used as a replacement of PFOS in the ScotchGard formulas, and
perfluorobutanoic acid (PFBA) has also been introduced as an alternative to PFOA in recent
years, which may also have adverse health effects despite their relatively shorter half-lives
(Buck et al., 2011; Olsen et al., 2009; Eschauzier et al., 2010; Liu et al., 2020).
Some studies have reported positive associations between PFAS concentrations in serum or
indoor dust and carpet (Beesoon et al., 2012; Harris et al., 2017; Hu et al., 2018; Hurley et
al., 2018; Karásková et al., 2016). However, none of these studies distinguished between
Author Manuscript
different types of carpets. Because different types of carpets were designed for different
social settings and frequency of foot traffic, they may present distinct patterns of PFAS
exposure contribution. For example, low pile carpets are designed for and more common in
places with larger traffic than medium to high pile carpets, and may have different PFAS
treatment. We here extend the previous work by investigating and quantifying the
contribution of PFAS exposure from various types of floor coverings using the NHANES
public-use database. In this study, we also accounted for other previously reported exposure
pathways to PFAS, including dietary intake of fish and shellfish (Christensen et al., 2017),
Environ Res. Author manuscript; available in PMC 2022 April 01.Zhu et al. Page 5
fast food consumption (Susmann et al., 2019), water contamination by firefighting foams
Author Manuscript
near military sites (Hu et al., 2016), and tap water sources (Shin et al., 2011a; Shin et al.,
2011b). We also accounted for kidney function (Jain et al., 2019) and special PFAS
excretion pathways for females, including menstrual blood loss (Wu et al., 2015), maternal
transfer to offspring through pregnancy (Beesoon et al., 2011) and breastfeeding (Fromme et
al., 2010). To our knowledge, this is the first analysis that distinguishes low pile carpet from
medium/high pile carpet, and focuses specifically on the association between carpet type and
PFAS, which can inform PFAS exposure assessment from carpet more comprehensively.
Methods
We obtained data from the 2005–2006 NHANES data files. NHANES uses a complex,
multistage, stratified, clustered, probability sampling design to select participants
representative of the civilian, non-institutionalized US population (NCHS, 2012). It is a
Author Manuscript
cross-sectional survey designed to monitor the health and nutritional status of adults and
children in the US. NHANES survey includes interviews, physical examinations for every
participant and laboratory tests for a subsample (NCHS, 2013). Sampling weights were
created in the sample and subsamples in each 2-year cycle to account for oversampling, non-
response, and poststratification in the complex survey design (NCHS, 2012). Our analyses
were restricted to the 2005–2006 cycle based on the availability of the key variable of
interest: type of floor covering. This variable was not included in subsequent cycles of
NHANES.
Serum PFAS Measurements.
In the 2005–2006 NHANES data, 12 PFAS were measured in a one-third subsample of
eligible participants aged 12 years and older using tandem mass spectrometry, including
Author Manuscript
PFOA, PFOS, PFHxS, 2-(N-ethyl-perfluorooctane sulfonamido) acetic acid (EtFOSAA),
MeFOSAA, perfluorodecanoic acid (PFDA), PFBS, perfluoroheptanoic acid (PFHpA),
PFNA, perfluorooctane sulfonamide (PFOSA), perfluoroundecanoic acid (PFUnDA), and
perfluorododecanoic acid (PFDoA). Procedures for collecting, storing, and handling
specimens, and quality control have been described elsewhere (CDC, 2013). PFAS serum
concentrations below the limit of detection (LOD) were substituted with a value of LOD
divided by 2 (CDC, 2013). We restricted our analyses to the six PFAS (i.e., PFOA, PFOS,
PFHxS, MeFOSAA, PFDA, and PFNA) with detection rates of >70% in the sample to avoid
bias from the substitutions. The LOD was 0.1 ng/ml for PFOA, PFHxS, and PFNA; and 0.2
ng/ml for PFOS, PFDA, and MeFOSAA (CDC, 2012).
Explanatory Variables.
Author Manuscript
We obtained NHANES variables relevant to known or suspected PFAS exposure pathways,
including the type of floor covering (collected using household interview questionnaires)
from the dust allergen subsample in the laboratory data; tap water source, self-reported fish
and shellfish consumption in the past 30 days from the dietary interview component; the
frequency of eating out per week from the dietary behavior questionnaire; serum creatinine
(an indicator of kidney function) from the standard biochemistry profile; whether or not had
at least one menstrual period in the past 12 months, number of pregnancies, and number of
Environ Res. Author manuscript; available in PMC 2022 April 01.Zhu et al. Page 6
children breastfed for at least one month from the reproductive health questionnaire data. We
Author Manuscript
also obtained age, sex, race/ethnicity, education, family poverty income ratio (PIR), veteran/
military status, country of birth, and body mass index (BMI) from the demographic
component of the survey. These have been established as predictors for serum PFAS
concentrations in previous studies (Calafat et al., 2007; Kato et al., 2011; Christensen et al.,
2017; Susmann et al., 2019; Hu et al., 2016; Zhang et al., 2010; Jain, 2014). We
recategorized race/ethnicity as Hispanic (including Mexican American and other Hispanic),
non-Hispanic white, non-Hispanic black, and the others. We categorized education as less
than college, some college, and above college.
The type of floor covering was categorized as smooth surface, low pile carpet, medium to
high pile carpet, and combination of carpet and smooth surface. We recategorized the
frequency of eating out per week as “Yes” and “No” based on the provided combination of
numbers (1–21 times/week) and categories (never, more than 21 times per week, less than
Author Manuscript
weekly) in the original variable, because this variable is not fully numeric. We checked the
linearity of the relations between serum PFAS concentrations and age, family PIR, BMI,
serum creatinine, number of pregnancies, and number of children breastfed for at least one
month by examining both the scatter plots and plots of residuals against each of the predictor
variables, and included these predictors as continuous variables in the regression models. We
treated all “Refused” and “Don’t know” answers in the data as missing values. We checked
data on sex, menstrual period, pregnancy, and breastfeeding against each other. For males,
missing values in reproductive health information were substituted with “No” (menstrual
period) or 0 (number of pregnancies and number of children breastfed). For females aged 55
and older, missing values in “at least menstrual period in the last 12 months” were
substituted with “No”. For females who were never pregnant, missing values in the number
of pregnancies and the number of children breastfed for at least one month were substituted
Author Manuscript
with 0. For females who never breastfed, the number of children breastfed for at least one
month were also substituted with 0. After these substitutions, most variables have missing
rates less than 10% except for type of floor covering (26.9%) and veteran/military status
(19.4%). We compared the missing percentage of these variables with respect to other
variables, and found the type of floor covering is missing at random (MAR) with respect to
race/ethnicity and education; and veteran/military status is MAR with respect to country of
birth, race/ethnicity, and education.
Statistical Analysis.
We fit multiple linear regression models adjusted for covariates using log-transformed serum
PFAS concentrations while accounting for complex survey design (R package survey). We
adjusted for the sampling weights of the serum PFAS subsample, the smallest analysis
Author Manuscript
subpopulation in this study, for parameter estimates in regression models to reflect the
probability of selection, nonresponse, and post-stratification (NHANES, 2020a). We also
accounted for the pseudo-stratum and pseudo-PSU variables in order to produce
asymptotically unbiased variance estimation in our regression models (NHANES, 2020b).
Because of the dispersed distribution of missing values in different variables, listwise
deletion of missing data that is performed as default in most statistical software packages
including R would substantially reduce the sample size by 55%. Although listwise deletion
Environ Res. Author manuscript; available in PMC 2022 April 01.Zhu et al. Page 7
is acceptable when some observations are “missing completely at random” (MCAR) without
Author Manuscript
respect to any of the other variables, multiple imputation performs better when missingness
is covariate-dependent (Little and Rubin, 2020). We used multivariate imputation by chained
equations (MICE) to create k=100 imputed datasets (R package mice). We applied Rubin’s
rules (Rubin, 1987) to pool the results from k=100 analyses accounting for complex survey
design based on the imputed datasets, averaging the estimates and computing the total
variance over the repeated analyses. We also compared the results from regression analyses
with those of complete case analysis (analysis of data after listwise deletion). We
exponentiated the regression coefficients, subtracted by one, and multiplied by 100% to
estimate the percent difference in PFAS concentrations associated with each predictor. For
variables with more than two categories/levels, Wald Chi-squared tests of equivalence on
multiple parameters can be used to test their effects. For example, to test the hypothesis that
multiple types of flooring have no effect on serum PFAS concentrations, we conducted a
Author Manuscript
simultaneous Wald Chi-squared test of equivalence for all parameters related to type of
flooring. Because the education level of adolescents are mostly determined by their age
rather than family socioeconomic status, in sensitivity analyses, we ran the analysis for
adults (aged > 19) and adolescents (aged 12–19) separately.
Because PFAS do not tend to accumulate in the fat tissues (lipophobic property) (Benford et
al., 2008), we did not include BMI (an indicator of body fatness) in the primary multiple
regression models. PFAS has been suggested as a potential “cause” of body weight change
(Liu et al., 2018), not the other way around, in which case, BMI would not confound the
associations between type of flooring and serum PFAS; thus adjustment for BMI would not
be necessary and could even induce selection bias under certain conditions (Rothman, 2012).
In sensitivity analyses, we also fit multiple regression models with additional adjustment for
BMI, following the practice in some previous studies (Harris et al., 2017; Christensen et al.,
Author Manuscript
2017; Susmann et al., 2019). We used R 4.0.0 for statistical analyses.
Results
Characteristics of study participants by type of residential floor covering are shown in Table
1. Accounting for the complex survey design, we estimated the geometric means of PFAS
serum concentrations by type of floor covering in the general US population during 2005–
2006 shown in Table 2. In general, we found higher geometric means of PFAS in people
residing in homes with low pile carpets compared to those residing in homes with smooth
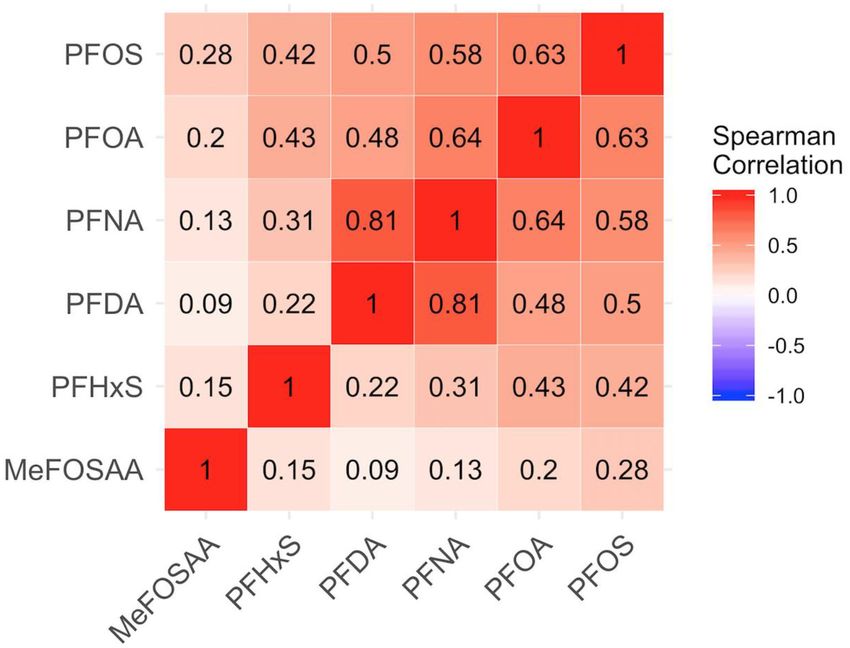
surfaces and medium to high pile carpets. The pairwise Spearman correlation matrix among
different serum PFAS concentrations is shown in Figure 1. The correlations among
perfluoroalkyl carboxylic acids, including PFNA, PFDA, and PFOA are moderate to high,
Author Manuscript
which is likely due to the fact that they have a common precursor 8:2 FTOH (Buck et al.,
2011). The high correlation between PFOA and PFOS has been reported elsewhere
previously (Haug et al., 2009), indicating the likelihood of common exposure sources for
these two legacy PFAS, such as food, dust, and air. However, the correlations among PFOS
and its precursors MeFOSAA, PFHxS were not as high as expected, indicating the
likelihood of other commercial sources of PFOS (e.g., di-SAmPAP) (Yeung et al., 2013).
Environ Res. Author manuscript; available in PMC 2022 April 01.Zhu et al. Page 8
After imputation, the study participants (n = 2,323) represent 244 million general US
Author Manuscript
population, half of whom resided in homes with low pile carpets. Adjusting for potential
confounders, we found low pile carpets were associated with 32% (95% CI: 3%−70%)
increase in serum PFHxS concentration and 25% (95% CI: 7%−45%) increase in serum
MeFOSAA concentration compared to smooth surfaces (Table 3). Given the geometric
means of 1.29 ng/ml and 0.31 ng/ml for PFHxS and MeFOSAA, respectively, for people
residing in homes with smooth surfaces (Table 2), on average low pile carpets were
associated with 0.41 ng/ml increase in PFHxS and 0.08 ng/ml increase in MeFOSAA,
accounting for 24% and 19% of the geometric means of serum PFHxS and MeFOSAA
concentrations, respectively, in people residing in homes with low pile carpets in the US.
The Wald Chi-squared test of equivalence for multiple parameters showed significant
differences in serum PFOS and MeFOSAA concentrations among people who used different
types of floor covering (p-value = 0.02 and 0.04, respectively; Table 3). Overall, multiple
Author Manuscript
imputation and complete case analysis created similar results in regression analyses with the
exception of PFHxS, for which the association with low pile carpets was not significant
using complete case analysis (20%, 95% CI: [−14%, 67%], see Table S1 in the
Supplementary material) but significant using multiple imputation (32%, 95% CI: [3%,
70%], Table 3). Complete case analysis only included 1,044 observations in the adjusted
model, losing 55% of the information, which may bias the results (Little and Rubin, 2020).
Separate analysis for adults (n=1,593) produced similar results to the analysis using all
participants (n=2,323) (Table S2), while the results for adolescents (n=730) were different,
i.e., the effects of low pile carpet on PFHxS (29%, 95% CI: [−14%, 92%], Table S3) and
MeFOSAA (13%, 95% CI: [−9%, 41%], Table S3) were not significant, which is likely due
to the smaller sample size of adolescents and the less statistical power. Additional
adjustment for BMI in the sensitivity analyses also produced similar results to the primary
Author Manuscript
analysis (see Table S4 in the Supplementary material).
Other important predictors for PFAS in this study include race/ethnicity, country of birth,
family PIR, shellfish consumption, tap water sources, menstruation period, similar to
previous findings reported elsewhere (Calafat et al., 2007; Christensen et al. 2017; Haug et
al., 2010; Hurley et al., 2016; Kato et al. 2011; Suominen et al., 2011; Yamaguchi et al.,
2013).
Discussion
In this study, we examined the associations between type of floor covering and serum PFAS
concentrations. Descriptive statistics in Table 2 also showed higher geometric means of
serum PFAS concentrations in people residing in homes with low pile carpets than people
Author Manuscript
residing in homes with smooth surfaces and medium to high pile carpets. After adjusting for
potential confounding variables in the multiple regression model, we found significantly
higher serum PFHxS and MeFOSAA concentrations in people residing in homes with low
pile carpets compared with those residing in homes with smooth surfaces, especially adults;
while the effects of medium to high pile carpets and combination of carpet and smooth
surface on serum PFAS concentrations were less clear, suggesting that low pile carpet is a
more important source of exposure compared with other types of flooring. Because PFHxS
Environ Res. Author manuscript; available in PMC 2022 April 01.Zhu et al. Page 9
and MeFOSAA are both key ingredients in carpet treatment products that are intended for
Author Manuscript
stain resistance, our results could be explained by the fact that low pile carpets frequently
used in highly-trafficked spaces were more likely to have more extensive PFAS treatment. In
addition, we concluded that among US residents using low pile carpeting in the home in
2005–2006, on average 24% and 19% of the PFHxS and MeFOSAA body burdens,
respectively, could be attributed solely to the carpeting.
A previous study by Harris et al. (2017) found higher serum PFOS, PFHxS, and MeFOSAA
concentrations in US children aged 6–10 years who slept in a bedroom with carpeting or a
rug, indicating hand-to-mouth transfer from treated carpets or inhalation of volatile
precursors as important exposure pathways for children. Our study does not include children
less than 12 years old, who are more likely than adolescents and adults to crawl on the
ground and have their hands contact the carpets. Our results derived from the NHANES data
are more representative of the general US population aged 12 and older, and can potentially
Author Manuscript
inform the PFAS exposure from various types of flooring, especially low pile carpeting.
Previous studies have indicated carpets as both a source and sink of PFAS chemicals. Given
that the dust ingestion of children is about two times that of adults (Shoeib et al., 2005;
Strynar et al., 2008), the PFAS exposure coming from house carpets for children less than 12
years old is likely to be higher.
Similar to the previous studies (Beesoon et al., 2012; Hurley et al., 2018; Goosey and
Harrad, 2011), we found that other long-chain PFAS such as PFHxS and MeFOSAA were
elevated in individuals residing in homes with carpets. We also found somewhat different
PFOS concentrations among people using various types of flooring, which may suggest
distinct PFAS treatment or formulations for different types of carpets, and the potential for
other PFAS to degrade or be metabolized to PFOS (ATSDR, 2018). However, the conclusion
Author Manuscript
is tempered by the limitation of using p-valueZhu et al. Page 10
to deal with left-censored data on serum PFAS concentrations, it is not clear how they
Author Manuscript
addressed missing values in the explanatory variables.
Our study has several limitations. First, our analyses were restricted to the 2005–2006 cycle
based on the unique availability of the key variable interest, type of floor covering in the
NHANES datasets. Future research collecting and/or using more recent data from other
sources would be a valuable addition to the present study. Second, although similar
compositional patterns have been found in carpets and dust previously (Wu et al., 2020),
there is a lack of linkage between PFAS in air and/or dust samples and PFAS in the house
carpets in our study due to the limitation of the NHANES datasets. Also, lack of information
on other furniture and upholstery, which may also be treated with PFAS, may also impact
our inference due to the potential uncontrolled confounding. Third, although we tried to
obtain a crude estimate of PFAS exposure through selection of several key dietary recall
variables, there are no direct measurements of PFAS in the NHANES participants’
Author Manuscript
individual diets and drinking water. Although dietary seafood intake has been found to be a
strong predictor of serum PFAS concentrations (Christensen et al., 2007), our use of seafood
consumption in the past 30 days is limited in its ability to predict long-term seafood
consumption. Previous studies have implicated consumption of PFAS-contaminated tap
water as a significant predictor for serum PFAS concentrations (Shin et al., 2011a; Shin et
al., 2011b) and published exposure-pharmacokinetic models predict that tap water
contributions can be dominant at fairly low PFAS water concentrations (Bartell, 2017; Lu
and Bartell, 2019). We did not adjust for the amount of tap water consumed due to the
spatial heterogeneity of PFAS contamination in US public water supplies, the removal of
geographical identifiers from public use NHANES data sets, and the limitations of using
short-term recall data to represent long-term water consumption. Future research linking
individual-level data from NHANES to the nationwide PFAS detection data in public water
Author Manuscript
supplies (UCMR 3) would help assess the contributions of drinking water to serum PFAS.
Conclusions
This study found that low pile carpeting was associated with increased serum concentrations
of PFHxS and MeFOSAA in the general US population, while no clear association has been
observed between the other types of carpeting and serum PFAS concentrations. Further
studies would be needed to fully understand PFAS formulations in different types of
carpeting.
Supplementary Material
Refer to Web version on PubMed Central for supplementary material.
Author Manuscript
Acknowledgements:
We would like to acknowledge the U.S. Centers for Disease Control and Prevention for its financial support.
Funding:
This publication was supported by the Centers for Disease Control and Prevention of the U.S. Department of Health
and Human Services (HHS) as part of a financial assistance award (#U01-TS000308) totaling $1,000,000 in FY20
Environ Res. Author manuscript; available in PMC 2022 April 01.Zhu et al. Page 11
with 100 percent funded by CDC/HHS. The contents are those of the author(s) and do not necessarily represent the
official views of, nor an endorsement, by CDC/HHS, or the U.S. Government.
Author Manuscript
References
ATSDR (U.S. Department of Health and Human Services Agency for Toxic Substances and Disease
Registry). 2018. Toxicological Profile for Perfluoroalkyls, Atlanta, GA:Centers for Disease Control
and Prevention. https://www.atsdr.cdc.gov/toxprofiles/tp200.pdf.
Bartell SM. 2017. Online Serum PFOA Calculator for Adults. Environmental Health Perspectives. 125,
104502. [PubMed: 29068316]
Bartell SM, Calafat AM, Lyu C, Kato K, Ryan PB, Steenland K, et al. 2010. Rate of decline in serum
PFOA concentrations after granular activated carbon filtration at two public water systems in Ohio
and West Virginia. Environ Health Perspect. 118, 222–228. [PubMed: 20123620]
Beesoon S, Genuis S, Benskin JP, Martin JW. 2012. Exceptionally high serum concentrations of
perfluorohexanesulfonate in a Canadian family are linked to home carpet treatment applications.
Environ Sci Technol. 46, 12960–7. [PubMed: 23102093]
Author Manuscript
Beesoon S, Webster GM, Shoeib M, Harner T, Benskin JP, Martin JW. 2011. Isomer profiles of
perfluorochemicals in matched maternal, cord, and house dust samples: manufacturing sources and
transplacental transfer. Environ Health Perspect. 119, 1659–64. [PubMed: 21757419]
Benford D, de Boer J, Carere A, di Domenico A, Johansson N, Schrenk D, et al. 2008. Perfluorooctane
sulfonate, perfluorooctanoic acid and their salts. Scientific opinion of the panel on contaminants in
the food chain. European Food Safety Authority. 653, 1–131.
Birnbaum LS, Grandjean P. 2015. Alternatives to PFASs: perspectives on the science. Environ Health
Perspect. 123(5), A104. [PubMed: 25932670]
BloombergLaw. 2020. Older PFAS That EPA Thought Obsolete Still Used, Agency Told. https://
news.bloomberglaw.com/environment-and-energy/older-pfas-that-epa-thought-obsolete-still-used-
agency-told.
Buck RC, Franklin J, Berger U, Conder JM, Cousins IT, Voogt P, et al. 2011. Perfluoroalkyl and
polyfluoroalkyl substances in the environment: terminology, classification, and origins. Integr
Environ Assess Manag. 7(4), 513–541. [PubMed: 21793199]
Calafat AM, Wong LY, Kuklenyik Z, Reidy JA, Needham LL. 2007. Polyfluoroalkyl chemicals in the
Author Manuscript
U.S. population: data from the National Health and Nutrition Examination Survey (NHANES)
2003–2004 and comparisons with NHANES 1999–2000. Environ Health Perspect. 115(11), 1596–
1602. [PubMed: 18007991]
CDC (The Centers for Disease Control and Prevention). 2012. National Health and Nutrition
Examination Survey. 2005–2006 Data Documentation, Codebook, and Frequencies.
Polyfluoroalkyl Chemicals (PFC_D), https://wwwn.cdc.gov/Nchs/Nhanes/2005-2006/PFC_D.htm
CDC. 2013. Laboratory Procedure Manual for Per- and Polyfluoroalkyl Substances (PFAS). https://
www.cdc.gov/nchs/data/nhanes/nhanes_11_12/PFC_G_met.pdf
CDC. 2019. Fourth Report on Human Exposure to Environmental Chemicals, Updated Tables, January
2019. Atlanta, GA: US Centers for Disease Control and Prevention. https://www.cdc.gov/
exposurereport/index.html.
Christensen KY, Raymond M, Blackowicz M, Liu Y, Thompson BA, Anderson HA, et al. 2017.
Perfluoroalkyl substances and fish consumption. Environ Res. 154, 145–151. [PubMed: 28073048]
D’eon JC, Mabury SA. 2007. Production of perfluorinated carboxylic acids (PFCAs) from the
Author Manuscript
biotransformation of polyfluoroalkyl phosphate surfactants (PAPS): exploring routes of human
contamination. Environ Sci Technol. 41(13), 4799–4805. [PubMed: 17695932]
D’eon JC, Mabury SA. 2011. Exploring indirect sources of human exposure to perfluoroalkyl
carboxylates (PFCAs): evaluating uptake, elimination, and biotransformation of polyfluoroalkyl
phosphate esters (PAPs) in the rat. Environ Health Perspect. 119(3), 344–350. [PubMed:
21059488]
D’Hollander W, Roosens L, Covaci A, Cornelis C, Reynders H, Campenhout KV, et al. 2010.
Brominated flame retardants and perfluorinated compounds in indoor dust from homes and offices
in Flanders, Belgium. Chemosphere. 81(4), 478–87. [PubMed: 20709355]
Environ Res. Author manuscript; available in PMC 2022 April 01.Zhu et al. Page 12
De Silva A, Allard CN, Spencer C, Webster GM, Shoeib M. 2012. Phosphorus-containing fluorinated
organics: polyfluoroalkyl phosphoric acid diesters (diPAPs), perfluorophosphonates (PFPAs), and
Author Manuscript
perfluorophosphinates (PFPIAs) in residential indoor dust. Environ Sci Technol. 46, 12575–12582.
[PubMed: 23102111]
DTSC (Department of Toxic Substances Control). 2018. Product-Chemical Profile for Perfluoroalkyl
and polyfluoroalkyl substances (PFASs) in carpets and rugs. https://dtsc.ca.gov/wp-content/
uploads/sites/31/2018/10/Product-Chemical-Profile-PFAS-Carpets-and-Rugs.pdf
Eschauzier C, Haftka J, Stuyfzand PJ, Voogt PD. 2010. Perfluorinated compounds in infiltrated river
Rhine water and infiltrated rainwater in coastal dunes. Environ Sci Technol. 44, 7450–7455.
[PubMed: 20831216]
Faithfull NS, Weers JG. 1998. Perfluorocarbon compounds. Vox sanguinis. 74(S2), 243–8. [PubMed:
9704451]
Fraser AJ, Webster TF, Watkins DJ, Nelson JW, Stapleton HM, Calafat AM, et al. 2012.
Polyfluorinated compounds in serum linked to indoor air in office environments. Environ Sci
Technol. 46(2), 1209–15. [PubMed: 22148395]
Fromme H, Mosch C, Morovitz M, Alba-Alejandre I, Boehmer S, Kiranoglu M, et al. 2010. Pre- and
Author Manuscript
postnatal exposure to perfluorinated compounds (PFCs). Environ Sci Technol. 44, 7123–9.
[PubMed: 20722423]
Gebbink WA, Glynn A, Berger U. 2015. Temporal changes (1997–2012) of perfluoroalkyl acids and
selected precursors (including isomers) in Swedish human serum. Environ Pollution 199, 166–173.
Glüge J, Scheringer M, Cousins IT, DeWitt JC, Goldenman G, Herzke D, Lohmann R, Ng CA, Trier
X, Wang Z. 2020. An overview of the uses of per- and polyfluoroalkyl substances (PFAS). Environ
Sci Processes Impacts.
Gomis MI, Vestergren R, Borg D, Cousins IT. 2018. Comparing the toxic potency in vivo of long-
chain perfluoroalkyl acids and fluorinated alternatives. Environ Int. 113, 1–9. [PubMed:
29421396]
Goosey E, Harrad S. 2011. Perfluoroalkyl compounds in dust from Asian, Australian, European, and
North American homes and UK cars, classrooms, and offices. Environ Int. 37, 86–92. [PubMed:
20810169]
Harris MH, Rifas-Shiman SL, Calafat AM, Ye X, Mora AM, Webster TF, et al. 2017. Predictors of per-
and polyfluoroalkyl substance (PFAS) plasma concentrations in 6–10 year old American children.
Author Manuscript
Environ Sci Technol. 51(9), 5193–5204. [PubMed: 28325044]
Hurley S, Goldberg D, Wang M, Park J, Petreas M, Bernstein L, et al. 2018. Time trends in per- and
polyfluoroalkyl substances (PFASs) in California women: declining serum levels, 2011–2015.
Environ Sci Tech. 52, 277–287.
Hu XC, Andrews DQ, Lindstrom’s AB, Bruton TA, Schaider LA, Grandjean P, et al. 2016. Detection
of poly- and perfluoroalkyl substances (PFASs) in U.S. drinking water linked to industrial sites,
military fire training areas, and wastewater treatment plants. Environ Sci Technol Lett. 3, 344–350.
[PubMed: 27752509]
Hu XC, Dassuncao C, Zhang X, Grandjean P, Weihe P, Webster GM, et al. 2018. Can profiles of poly-
and Perfluoroalkyl substances (PFASs) in human serum provide information on major exposure
sources? Environmental Health. 17, 11. [PubMed: 29391068]
Jain RB. 2014. Contribution of diet and other factors to the levels of selected polyfluorinated
compounds: Data from NHANES 2003–2008. Int J Hyg Environ Health. 217, 52–61. [PubMed:
23601780]
Author Manuscript
Jain RB, Ducatman A. 2019. Perfluoroalkyl substances follow inverted U-shaped distributions across
various stages of glomerular function: Implications for future research. Environ Res. 169, 476–
482. [PubMed: 30530087]
Johnson PI, Sutton P, Atchley DS, Koustas E, Lam J, Sen S, et al. 2014. The navigation guide—
evidence-based medicine meets environmental health: systematic review of human evidence for
PFOA effects on fetal growth. Environ Health Perspect. 122(10), 1028–1039. [PubMed:
24968388]
Environ Res. Author manuscript; available in PMC 2022 April 01.Zhu et al. Page 13
Karásková P, Venier M, Melymuk L, Bečanová J, Vojta Š, Prokeš R, Diamond ML, Klánová J. 2016.
Perfluorinated alkyl substances (PFASs) in household dust in Central Europe and North America.
Author Manuscript
Environ Int. 94, 315–324. [PubMed: 27295048]
Kato K, Calafat AM, Needham LL. 2009. Polyfluoroalkyl chemicals in house dust. Environ Res.
109(5), 518–23. [PubMed: 19261270]
Kato K, Wong LY, Jia LT, Kuklenyik Z, and Calafat AM. 2011. Trends in exposure to polyfluoroalkyl
chemicals in the U.S. population: 1999–2008. Environ Sci Technol. 45(19), 8037–8045. [PubMed:
21469664]
Kissa E 2001. Fluorinated Surfactants and Repellents, 2nd edition (Vol. 97). Marcel Dekker, Inc.: New
York. 97, 640.
Kubwabo C, Stewart B, Zhu J, Marro L. 2005. Occurrence of perfluorosulfonates and other
perfluorochemicals in dust from selected homes in the city of Ottawa, Canada. J Environ Monit. 7,
1074–1078 [PubMed: 16252056]
Li Y, Fletcher T, Mucs D, Scott K, Lindh CH, Tallving P, Jakobsson K. 2018. Half-lives of PFOS,
PFHxS and PFOA after end of exposure to contaminated drinking water. J Occup Environ Med.
75, 46–51.
Author Manuscript
Little RJA, Rubin DB. 2020. Statistical Analysis with Missing Data, 3rd edition. John Wiley & Sons,
Inc.
Liu G, Dhana K, Furtado J, Rood J, Zong G, Liang L, et al. 2018. Perfluoroalkyl substances and
changes in body weight and resting metabolic rate in response to weight-loss diets: A prospective
study. PLOS Med. 15(2), e1002502. [PubMed: 29438414]
Liu S, Yang R, Yin N, Faiola F. 2020. The short-chain perfluorinated compounds PFBS, PFHxS, PFBA
and PFHxA, disrupt human mesenchymal stem cell self-renewal and adipogenic differentiation. J
Environ Sci (China). 88, 187–199. [PubMed: 31862060]
Lu S, Bartell SM. 2019. Serum PFAS Calculator for Adults, Version 1.1, www.ics.uci.edu/~sbartell/
pfascalc.html.
Martin JW, Mabury SA, Solomon KR, Muir DCG. 2003. Dietary accumulation of perfluorinated acids
in juvenile rainbow trout (Oncorhynchus mykiss). Environmental Toxicology and Chemistry.
22(1), 189–195. [PubMed: 12503764]
NCHS (National Center for Health Statistics). 2012. The National Health and Nutrition Examination
Author Manuscript
Survey: Sample Design, 1999–2006. https://www.cdc.gov/nchs/data/series/sr_02/sr02_155.pdf
NCHS. 2013. National Health and Nutrition Examination Survey: Plan and Operations, 1999–2010.
https://www.cdc.gov/nchs/data/series/sr_01/sr01_056.pdf
NHANES (National Health and Nutrition Examination Survey). 2020a. Tutorials, Module 3:
Weighting, Selecting the Correct Weight in NHANES. https://wwwn.cdc.gov/nchs/nhanes/
tutorials/module3.aspx.
NHANES. 2020b. Tutorials, Module 4: Variance Estimation, Variance Estimation Methods in
NHANES. https://wwwn.cdc.gov/nchs/nhanes/tutorials/module4.aspx.
Olsen GW, Church TR, Miller JP, Burris JM, Hansen KJ, Lundberg JK, Armitage JB, Herron RM,
Medhdizadehkashi Z, Nobiletti JB, O’Neill EM, Mandel JH, Zobel LR. 2003.
Perfluorooctanesulfonate and other fluorochemicals in the serum of American Red Cross adult
blood donors. Environ Health Perspect. 111(16), 1892–1901. [PubMed: 14644663]
Olsen GW, Burris JM, Ehresman DJ, Froehlich JW, Seacat AM, Butenhoff JL, et al. 2007. Half-life of
serum elimination of perfluorooctanesulfonate, perfluorohexanesulfonate, and perfluorooctanoate
in retired fluorochemical production workers. Environ Health Perspect. 115(9), 1298–305.
Author Manuscript
[PubMed: 17805419]
Olsen GW, Mair DC, Church TR, Ellefson ME, Reagen WK, Boyd TM, Herron RM,
Medhdizadehkashi Z, Nobiletti JB, Rios JA, Butenhoff JL, Zobel LR. 2008. Decline in
perfluorooctanesulfonate and other polyfluoroalkyl chemicals in American Red Cross adult blood
donors, 2000–2006. Environ Sci Technol. 42(13), 4989–4995. [PubMed: 18678038]
Olsen GW, Change S-C, Noker PE, Gorman GS, Ehresman DJ, Lieder PH, Butenhoff JL. 2009. A
comparison of the pharmacokinetics of perfluorobutanesulfonate (PFBS) in rats, monkeys, and
humans. Toxicology. 256, 65–74. [PubMed: 19059455]
Rothman KJ. 1987. Epidemiology: An Introduction, 2nd edition. Oxford University Press, Inc, 2012.
Environ Res. Author manuscript; available in PMC 2022 April 01.Zhu et al. Page 14
Rubin DB. 1987. Multiple Imputation for Nonresponse in Surveys. John Wiley & Sons, Inc.
Shin HM, Vieira VM, Ryan PB, Detwiler R, Sanders B, Steenland K, Bartell SM. 2011a.
Author Manuscript
Environmental fate and transport modeling for perfluorooctanoic acid emitted from the
Washington Works Facility in West Virginia. Environ Sci Technol. 45(4), 1435–1442. [PubMed:
21226527]
Shin HM, Vieira VM, Ryan PB, Steenland K, Bartell SM. 2011b. Retrospective exposure estimation
and predicted versus observed serum perfluorooctanoic acid concentrations for participants in the
C8 Health Project. Environ Health Perspect. 119(12), 1760–1765. [PubMed: 21813367]
Shoeib M, Harner T, Wilford BH, Jones KC, Zhu J. 2005. Perfluorinated sulfonamides in indoor and
outdoor air and indoor dust: occurrence, partitioning, and human exposure. Environ Sci Technol.
39:6599–6606. [PubMed: 16190217]
Strynar MJ, Lindstrom AB. 2008. Perfluorinated compounds in house dust from Ohio and North
Carolina, USA. Environ Sci Technol. 42(10), 3751–6. [PubMed: 18546718]
Susmann HP, Schaider LA, Rodgers KM, Rudel RA. 2019. Dietary Habits Related to Food Packaging
and Population Exposure to PFASs. Environ Health Perspect. 127(10), 107003. [PubMed:
31596611]
Author Manuscript
UNEP (United Nations Environment Programme). 2010. The 9 new pops; an introduction to the nine
chemicals added to the stockholm convention by the conference of the parties at its fourth meeting,
2009. http://chm.pops.int/programmes/newpops/publications/tabid/695/language/en-us/
default.aspx.
UNEP. 2015. Working towards a global emission inventory of PFASs; environment directorate,
Organization for Economic Cooperation and Development: Paris. http://www.oecd.org/
chemicalsafety/Working%20Towards%20a%20Global%20Emission%20Inventory%20of
%20PFASS.pdf
US EPA (US Environmental Protection Agency). 2009. Long-chain perfluorinated chemicals (PFCs)
action plan. Available from: http://www.epa.gov/opptintr/existingchemicals/pubs/
pfcs_action_plan1230_09.pdf
Vélez MP, Arbuckle TE, Fraser WD. 2015. Maternal exposure to perfluorinated chemicals and reduced
fecundity: the MIREC study. Human Reproduction. 30(3), 701–709. [PubMed: 25567616]
Vieira VM, Hoffman K, Shin HM, Weinberg JM, Webster TF, Fletcher T. 2013. Perfluorooctanoic acid
exposure and cancer outcomes in a contaminated community: a geographic analysis. Environ
Author Manuscript
Health Perspect. 121(3), 318–323. [PubMed: 23308854]
Wang Z, Cousins IT, Scheringer M, Buck RC, Hungerbühler K. 2014. Global emission inventories for
C4-C14 perfluoroalkyl carboxylic acid (PFCA) homologues from 1951 to 2030, part II: The
remaining pieces of the puzzle. Environ Int. 69, 166–176. [PubMed: 24861268]
Wasserstein R, Lazar NA. 2016. The ASA’s statement on p-Values: context, process, and purpose. The
American Statistician. 70(2), 129–133.
Winkens K, Giovanoulis G, Koponen J, Vestergren R, Berger U, Karvonen AM, et al. 2018.
Perfluoroalkyl acids and their precursors in floor dust of children’s bedrooms - Implications for
indoor exposure. Environ Int. 119, 493–502. [PubMed: 30053737]
Worley RR, Moore SM, Tierney BC, Ye X, Calafat AM, Campbell S, et al. 2017. Per- and
polyfluoroalkyl substances in human serum and urine samples from a residentially exposed
community. Environ Int. 106, 135–143. [PubMed: 28645013]
Wu Y, Romanak K, Bruton T, Blum A, Venier M. 2020. Per- and polyfluoroalkyl substances in paired
dust and carpets from childcare centers. Chemosphere.
Author Manuscript
Wu H, Yoon M, Verner M, Xue J, Luo M, Anderson ME, et al. 2015. Can the observed association
between serum perfluoroalkyl substances and delayed menarche be explained on the basis of
puberty-related changes in physiology and pharmacokinetics? Environ Int. 82, 61–68. [PubMed:
26043300]
Yue R, Ministry of Environmental Protection of China. 2008. Additional information on production
and use of PFOS, http://chm.pops.int/portals/0/repository/comments_draftRME2008/UNEP-
POPS-POPRC-DRME-08-CHI-SCCP.english.pdf.
Environ Res. Author manuscript; available in PMC 2022 April 01.Zhu et al. Page 15
Zhang T, Wu Q, Sun HW, Zhang XZ, Yun SH, Kannan K. 2010. Perfluorinated compounds in whole
blood samples from infants, children, and adults in China. Environ Sci Technol. 44(11), 4341–7.
Author Manuscript
[PubMed: 20441147]
Zhang Y, Beesoon S, Zhu L, Martin JW. 2013. Biomonitoring of perfluoroalkyl acids in human urine
and estimates of biological half-life. Environ Sci Technol. 47(18), 10619–10627. [PubMed:
23980546]
Zushi Y, Hogarh J, Masunaga S. Progress and perspective of perfluorinated compound risk assessment
and management in various countries and institutes. Clean Technol Environ Policy 2012; 14:9–20.
Author Manuscript
Author Manuscript
Author Manuscript
Environ Res. Author manuscript; available in PMC 2022 April 01.Zhu et al. Page 16
Author Manuscript
Author Manuscript
Figure 1.
Pairwise Spearman Correlation Matrix among Different PFAS in Serum
Author Manuscript
Author Manuscript
Environ Res. Author manuscript; available in PMC 2022 April 01.Author Manuscript Author Manuscript Author Manuscript Author Manuscript
Table 1.
Characteristics of Study Participants
Type of floor covering
Zhu et al.
Characteristics n (%) or mean ± SD Smooth surface (n = 183) Low pile carpet (n = Medium/high pile carpet (n Combination of carpet and
1276) = 172) smooth surface (n = 67)
Age 38.2 ± 22.2 32.5 ± 20.0 37.3 ± 22.0 41.1 ± 23.8 45.0 ± 22.7
Gender
Female 1,180 (50.8%) 81 (44.3%) 647 (50.7%) 77 (44.8%) 38 (56.7%)
Male 1,143 (49.2%) 102 (55.7%) 629 (49.3%) 95 (55.2%) 29 (43.3%)
Race/ethnicity
Hispanic 623 (26.8%) 78 (42.6%) 332 (26.0%) 49 (28.5%) 11 (16.4%)
Non-Hispanic black 613 (26.4%) 49 (26.8%) 388 (30.4%) 24 (14.0%) 18 (26.9%)
Non-Hispanic white 996 (42.9%) 48 (26.2%) 503 (39.4%) 88 (51.2%) 34 (50.7%)
Others 91 (3.9%) 8 (4.4%) 53 (4.2%) 11 (6.4%) 4 (6.0%)
Education
< College 1,503 (64.7%) 127 (69.4%) 846 (66.3%) 120 (69.8%) 38 (56.7%)
Some college 513 (22.1%) 41 (22.4%) 279 (21.9%) 34 (19.8%) 16 (23.9%)
> College 305 (13.1%) 15 (8.2%) 150 (11.8%) 18 (10.5%) 13 (19.4%)
Country of birth
US 1,875 (80.7%) 141 (77.0%) 1028 (80.6%) 136 (79.1%) 60 (89.6%)
Foreign 447 (19.2%) 42 (23.0%) 248 (19.4%) 36 (20.9%) 7 (10.4%)
Veteran/military status
No 1,625 (70.0%) 130 (71.0%) 876 (68.7%) 115 (66.9%) 46 (68.7%)
Environ Res. Author manuscript; available in PMC 2022 April 01.
Yes 247 (10.6%) 8 (4.4%) 135 (10.6%) 28 (16.3%) 15 (22.4%)
Family PIR 2.5 ± 1.6 2.0 ± 1.5 2.4 ± 1.5 2.4 ± 1.4 2.5 ± 1.8
BMI 27.3 ± 7.0 27.3 ± 7.4 27.1 ± 6.9 27.7 ± 6.9 28.1 ± 8.6
Tap water source
Don’t drink tap water 419 (18.0%) 40 (21.9%) 224 (17.6%) 35 (20.3%) 17 (25.4%)
Community supply 1,335 (57.5%) 103 (56.3%) 739 (57.9%) 91 (52.9%) 38 (56.7%)
Other 338 (0.1%) 22 (12.0%) 190 (14.9%) 30 (17.4%) 9 (13.4%)
Eat out per week
No 225 (9.7%) 18 (9.8%) 133 (10.4%) 17 (9.9%) 7 (10.4%)
Page 17Author Manuscript Author Manuscript Author Manuscript Author Manuscript
Type of floor covering
Characteristics n (%) or mean ± SD Smooth surface (n = 183) Low pile carpet (n = Medium/high pile carpet (n Combination of carpet and
1276) = 172) smooth surface (n = 67)
Yes 2,064 (88.9%) 161 (88.0%) 1126 (88.2%) 154 (89.5%) 60 (89.6%)
Zhu et al.
Eating shellfish in the past 1 month
No 1,109 (47.7%) 90 (49.2%) 615 (48.2%) 80 (46.5%) 35 (52.2%)
Yes 1,114 (48.0%) 80 (43.7%) 618 (48.4%) 84 (48.9%) 29 (43.3%)
Eating fish in the past 1 month
No 793 (34.1%) 68 (37.2%) 445 (34.9%) 48 (27.9%) 17 (25.4%)
Yes 1,431 (61.6%) 103 (56.3%) 788 (61.8%) 116 (67.4%) 47 (70.1%)
Serum Creatinine (mg/dL) 0.9 ± 0.3 0.8 ± 0.3 0.8 ± 0.3 0.9 ± 0.3 0.9 ± 0.7
Had at least one period in the past 1 year
No 1,506 (64.8%) 120 (65.6%) 820 (64.3%) 118 (68.6%) 44 (65.7%)
Yes 706 (30.4%) 51 (27.9%) 396 (31.0%) 49 (28.5%) 23 (34.3%)
Number of pregnancies 1.0 ± 1.9 0.8 ± 1.7 1.0 ± 1.9 1.0 ± 1.9 0.9 ± 2.0
Number of children breastfed at least 1 month 0.4 ± 1.1 0.3 ± 1.0 0.3 ± 1.0 0.4 ± 1.1 0.3 ± 0.9
Environ Res. Author manuscript; available in PMC 2022 April 01.
Page 18Author Manuscript Author Manuscript Author Manuscript Author Manuscript
Table 2.
Geometric Means of Serum PFAS Concentrations by Type of Floor Covering
Type of Floor Covering Geometric Mean, 95% CI (ng/ml)
Zhu et al.
PFOA PFOS PFHxS MeFOSAA PFDA PFNA
Smooth surface 3.45, (2.95, 4.04) 13.67, (10.93, 17.08) 1.29, (0.94, 1.78) 0.31, (0.25, 0.39) 0.30, (0.25, 0.36) 0.94, (0.81, 1.08)
Low pile carpet 3.85, (3.41, 4.35) 17.34, (16.20, 18.55) 1.74, (1.46, 2.08) 0.41, (0.38, 0.45) 0.35, (0.29, 0.41) 1.05, (0.88, 1.25)
Medium to high pile carpet 3.71, (3.00, 4.58) 15.31, (13.22, 17.73) 1.63, (1.20, 2.22) 0.41, (0.31, 0.56) 0.29, (0.25, 0.34) 0.94, (0.83, 1.05)
Combination of carpet and smooth surface 3.75, (3.16, 4.45) 16.66, (13.53, 20.53) 1.56, (1.24, 1.97) 0.44, (0.35, 0.56) 0.33, (0.27, 0.42) 1.08, (0.86, 1.35)
Environ Res. Author manuscript; available in PMC 2022 April 01.
Page 19Author Manuscript Author Manuscript Author Manuscript Author Manuscript
Table 3.
Adjusted Associations* from Multiple Regression Models with Multiple Imputation (k=100) (n=2,323)
Zhu et al.
% difference in PFAS concentrations**, 95% CI PFOA PFOS PFHxS MeFOSAA PFDA PFNA
Type of floor covering
Smooth surface ref ref ref ref ref ref
Low pile carpet 7, (−8, 23) 14, (−2, 33) 32, (3, 70) 25, (7, 45) 12, (−6, 34) 9, (−7, 29)
Medium to high pile carpet −2, (−19, 17) −2, (−19, 19) 22, (−15, 75) 23, (−5, 59) −6, (−22, 12) −6, (−21, 13)
Combination of carpet and smooth surface −2, (−21, 22) 2, (−20, 31) 13, (−18, 55) 20, (−8, 57) 3, (−19, 31) 4, (−17, 30)
p-value of Wald Chi-squared test 0.5 0.02 0.1 0.04 0.1 0.3
*
We adjusted for age, gender (female/male), race/ethnicity (Hispanic/non-Hispanic black/non-Hispanic white/others), education (less than college/some college/college graduate or above), country of birth
(foreign/US), veteran/military status (yes/no), family PIR, tap water source (don’t drink tap water/community supply/others), eating out per week (yes/no), eating shellfish during past 30 days (yes/no),
eating fish during past 30 days (yes/no), serum creatine, had at least one period in the past 12 months (yes/no), number of pregnancies, and number of children breastfed at least 1 month in the regression
models.
**
We exponentiated the regression coefficients, subtracted by one, and multiplied by 100% to estimate the percent difference in PFAS concentrations associated with each predictor.
Environ Res. Author manuscript; available in PMC 2022 April 01.
Page 20You can also read