Herausforderungen der Geldpolitik in Zeiten hoher Inflation - Prof. Dr. Isabel Schnabel Mitglied des Direktoriums der EZB
←
→
Page content transcription
If your browser does not render page correctly, please read the page content below

Herausforderungen
der Geldpolitik in
Zeiten hoher Inflation

Prof. Dr. Isabel Schnabel
Mitglied des Direktoriums der EZB

                                                Wirtschaftspolitik aus erster Hand
                                    Zentrum für Europäische Wirtschaftsforschung
                                                       Mannheim, 19. April 2023
                                                              www.ecb.europa.eu ©
Wirtschaftswachstum
Rubric              und Inflation im Euroraum seit Beginn der Pandemie

                   Reales Bruttoinlandsprodukt                                                              Inflationsrate
                                (Index: Q4 2019 = 100)                            (Jahreswachstumsrate HVPI, in %, vierteljährliche Daten)
                                March 23 ECB staff projections                                            March 2023 ECB staff projections
                                Realised GDP                                                              Realised HICP
                                March 2020 ECB staff projections                                          March 2023 (final release)
     110                                                                                                  March 2020 ECB staff projections
                                                                              12.0

     105                                                                      10.0

     100                                                                       8.0                 2.0
                                                                                                   1.6                                   6.9
                                                                               6.0
       95                                                                                          1.2
                                                                                                   0.8
                                                                               4.0
       90                                                                                          0.4
                                                                               2.0                 0.0
                                                                                                  -0.4
       85
                                                                               0.0                    2019 2020 2021 2022

       80                                                                     -2.0
         2019       2020       2021        2022   2023   2024      2025           2019        2020        2021       2022        2023        2024       2025
  Sources: Eurostat, ECB and Eurosystem.                                      Sources: Eurostat, ECB and Eurosystem.
  Latest observation: Q4 2022.                                                Latest observation: Q1 2023 for quarterly data, March 2023 for monthly data (diamond).

                                                                          2                                                                                    www.ecb.europa.eu ©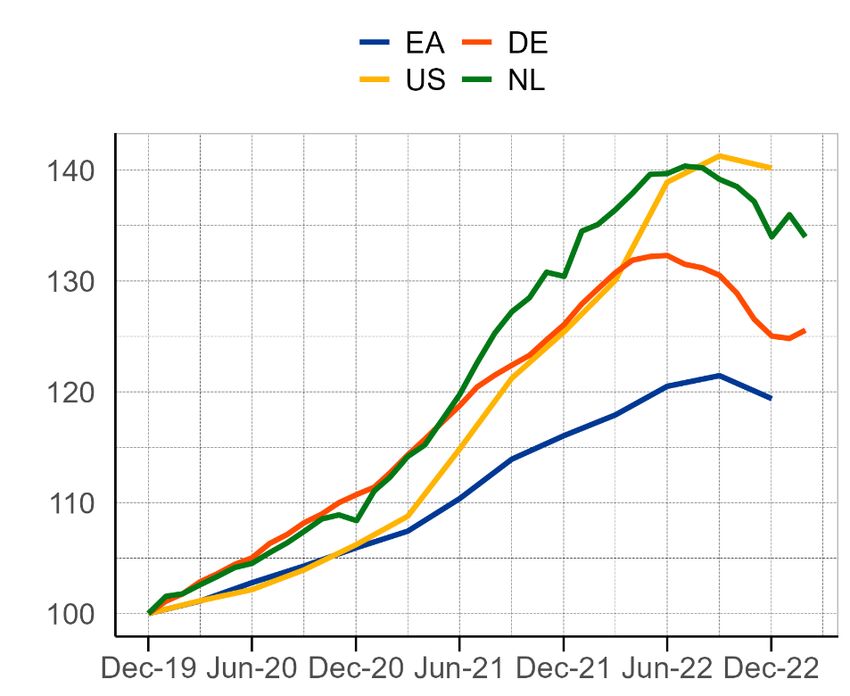
Spürbarer
 Rubric Rückgang der Gesamtinflation, doch zugrundeliegende Inflation bleibt hoch
                                                                        Zugrundeliegende Inflation
                                                                           (jährliche prozentuale Veränderung)

                                                                                  HICP excluding energy and food (HICPX)
                                                                                  PCCI (persistent and common component of inflation)
                                                                                  Supercore
                                                                                  Trimmed mean (10%)
                                                                                  Trimmed mean (30%)
                        9
                        8
                        7
                        6
                        5
                        4
                        3
                        2
                        1
                        0
                        Jan-10               Jan-12                Jan-14                Jan-16                Jan-18                Jan-20   Jan-22   Mar-23

   Sources: ECB and ECB calculations.
   Notes: HICPX, Supercore and Trimmed means are non-seasonally adjusted, while PCCI is based on seasonally adjusted price series.
   Latest observation: March 2023 (flash) for HICPX and February 2022 for the rest.

                                                                                                3                                                               www.ecb.europa.eu ©
Verbreiterung
Rubric des Inflationsdrucks auf den Großteil der HVPI-Komponenten
Anteil der HVPI-Komponenten Beitrag zur Gesamtinflation
(jährliche prozentuale Änderung; Beitrag in Prozentpunkten)
nach Preissteigerungsrate
(Prozent)
Below 1%
Between 1% and 2% NEIG Services Food Energy HICP
Between 2% and 3% 12
Above 3%
100
10
80 8
6
60
4
40
2
20
0
0 -2
Jan-21 Jan-22 Jan-23
Feb-23 Jan-21 Jan-22 Jan-23
Mar-23
Sources: ECB and ECB calculations. Sources: Eurostat and ECB calculations.
Latest observation: February 2023. Latest observation: March 2023 (flash).
4 www.ecb.europa.eu ©Momentum
Rubric der Inflation bleibt bei allen Komponenten außer Energie hoch
Inflationsmomentum des HVPI und seiner Komponenten
(jährliche prozentuale Änderung; annualisierte 3m-auf-3m prozentuale Änderung)
Momentum Momentum Momentum Momentum Momentum
HICP Energy Food HICPX Goods
16 72 16 8 8
8
14 60 14
12 48 12 6 6 6
10 36 10
8 24 8 4 4 4
6 12 6
4 0 4 2 2 2
2 -12 2
0 -24 0 0 0 0
Jan-22 Jul-22 Jan-23
Mar-23 Jan-22 Jul-22 Jan-23
Mar-23 Jan-22 Jul-22 Mar-23 Jan-22
Jan-23 Jul-22 Jan-23
Mar-23 Jan-22 Jul-22 Jan-23
Mar-23 Jan-22 Jul-22 Jan-23
Mar-23
Sources: Eurostat and ECB calculations.
Note: Seasonally-adjusted data.
Latest observation: March 2023 (flash).
5 www.ecb.europa.eu ©Angebotsseitige
Rubric Störungen von Lieferketten und Energiepreise gehen weiter zurück
Lieferkettenstörungen
(links: Standardabweichung; rechts: USD pro TEU)
Gas- und Ölpreise mit Termingeschäften
(Gas: EUR/MWh, Öl: USD/Barrel)
NYFED global supply chain pressure index
EA supply-chain disruption strain Euro area gas (TTF) Gas futures
Global shipping cost (rhs)
Brent oil Oil futures
6 12
250 250
5
10
4
200 200
3 8
2 150 150
6
1 Tightening
supply chain
0 pressures 4 100 100
-1
Loosening 2 50 50
-2 supply chain
pressures
-3 0 0 0
Dec-20 Jul-21 Feb-22 Sep-22 Mar-23
2021 2022 2023 2024
Sources: Haver Analytics, Refinitiv and ECB calculations.
Sources: Refinitiv, Bloomberg and ECB calculations.
Notes: Global shipping cost is Freightos Baltic aggregate across major trade routes. TEU stands for
Latest observation: 14 April 2023.
twenty-foot equivalent unit shipping container.
Latest observation: February 2023 for global shipping costs, March 2023 for the rest.
6 www.ecb.europa.eu ©Terms-of-trade-Schock
Rubric kehrt sich um, während Fiskalpolitik akkommodierend bleibt
Einkommenseffekte des Terms-of-trade-Schocks Fiskalischer Impuls während
(Effekt auf jährliches BIP-Wachstum in Prozentpunkten) Pandemie und Energiekrise
(Prozent des Potenzialoutputs)
Euro area: change in CAPB* vs 2019
Euro
EuroArea
area United States: change in CAPB vs 2019
United
United States
States 0.0
1.5
-1.0
1.0
0.5 -2.0
0.0
-3.0
-0.5
-1.0 -4.0
-1.5
-5.0
-2.0
-2.5 -6.0
03-20 12-20 09-21 06-22 12-22 2020 2021 2022 2023 2024
Source: March 2023 ECB staff Macroeconomic projections and IMF Fiscal Monitor, April 2023.
Notes: Negative (positive) numbers denote fiscal loosening (tightening) vs 2019.
Source: Haver analytics, Eurostat and ECB calculations. *CAPB stands for the cyclically adjusted primary balance. For the EA, this is adjusted for NGEU grants on
Notes: The income effect of terms of trade is calculated import and export price changes by their the revenue side, in line with the definition for the EA fiscal stance. The measure shown in chart is a proxy
respective past values (one-year lag) expressed as percentage of GDP. The latest observation is for the discretionary fiscal policy response since the pre-pandemic period (2019). It includes also other
2022 Q4. 7 factors (such as revenue windfalls/shortfalls). The measures for the EA and US are not fully comparable due
to the timing and other methodological differences between the two sources. www.ecb.europa.eu ©Rotation
Rubric hin zu nachfrageseitigen Faktoren bei besser als erwarteter Gesamtwirtschaft
Rolle von Nachfrage- und Angebotsfaktoren Citi Economic Surprise Index
(Korrelationskoeffizient)
Demand Supply rolling correlation China United States Euro area
1.0 1.0 250
▲ actual data better than
200 expected
demand
150
0.5 0.5
100
50
0.0 0.0
0
-50
-0.5 -0.5
supply
-100
-150
▼ actual data worse than expected
-1.0 -1.0
Jan-22 Jul-22 Jan-23 -200
Jan-22 Apr-22 Jul-22 Oct-22 Jan-23 Apr-23
Sources: Refinitiv and ECB calculations.
Notes: 30-trading days rolling correlation of daily percentage point changes in 1Y1Y ILS rates and Sources: Bloomberg, Citi.
daily returns on Euro Stoxx. Demand (supply) refers to that part of the correlation coming from trading Latest observation: 14 April 2023.
days on which ILS rates and stock returns moved in the same (opposite) direction. In each
subsample, the split between favourable and adverse is based on the share of days in the rolling
window of favourable (equities up) or adverse (equities down) market dynamics. Latest observation: 8
14 April 2023. www.ecb.europa.eu ©Märkte erwarten raschen Rückgang der Inflation, aber langfristige Erwartungen bleiben erhöht
Rubric
Marktbasierte Inflationserwartungen Langfristige marktbasierte Inflationserwartungen
im Euroraum im Euroraum und den USA
(Prozent) (Prozent)
y-o-y HICP inflation 5y5y inflation-linked swap rate
Inflation compensation rates (latest) US BEIR 5Y5Y
11 11 2.8
10 10 2.4
9 9
2.0
8 8
7 7 1.6
6 6
1.2
5 5
4 4 0.8
3 3 0.4
2 2 Jan-19 Jan-20 Jan-21 Jan-22 Jan-23
1 1
2022 2023 2024 2025 2026
Sources: Bloomberg, Refinitiv and ECB calculations. Source: Bloomberg, Refinitiv and ECB calculations.
Notes: The coloured diamonds refer to forward ILS rates that extend the equally coloured line of inflation fixings. The grey Notes: One caveat applying to BEIRs is that the market for inflation-linked bonds is less liquid than that
area refers to a projection horizon ending in December 2025. Latest observation: 17 April 2023. for standard bonds. This implies that BEIRs also reflect liquidity premia. Latest observation: 17 April
2023.
9
www.ecb.europa.eu ©Starker
RubricArbeitsmarkt bei deutlichem Anziehen des Lohnwachstums
Arbeitslosenquote Nominales Lohnwachstum
(Prozent) (jährliche prozentuale Veränderung)
Euro area
15
Negotiated Wages
ECB wage tracker
Indeed wage tracker
12 6
5
9
4
3
6
2
3 1
0
Jan-21 May-21 Sep-21 Jan-22 May-22 Sep-22 Dec-22
0
1999 2002 2005 2008 2011 2014 2017 2020 2023
Sources: Adrjan, Pawel & Reamonn Lydon (2022), Wage Growth in Europe: Evidence From Job Ads –
Sources: Eurostat Labour Force Survey and ECB staff calculations. Central Bank of Ireland - Economic letter - Vol 2022, No. 7 (November), ECB and Eurostat. Notes: the
Notes: The dashed line refers to the sample average over 1999M1-2023M2. ECB wage tracker is calculated based on micro data on wage agreements provided by Bundesbank,
Latest observation: February 2023. Banco de España, the Dutch employer association (AWVN), Oesterreichische Nationalbank, Bank of
Greece, Banca d’Italia and Banque de France. For FR see also: Gautier, E. (2023): Negotiated wage
increases: what is the picture for 2022?. EA aggregate based on ES, IT, GR, AT, DE, NL and FR.
Latest observations: 2022 Q4 (based on Oct and Nov data) for negotiated wages and March 2023 for
10 ECB wage tracker and Indeed data.
www.ecb.europa.eu ©Wachsende
Rubric Gewinne haben wesentlichen Anteil am Anstieg der heimischen Inflation
BIP-Deflator Sektorale Lohn- und Gewinnentwicklung
(jährliche prozentuale Änderung; Beitrag in Prozentpunkten) (prozentuale Änderung über die genannte Periode)
Wages 2019 Q4 - 2022 Q4
Unit labour costs Unit taxes Profits 2019 Q4 - 2022 Q4
Unit profits GDP deflator Total
8 Agriculture
Mining and utilities
6 Manufacturing
Construction
4 Trade, transport, accomodation and food
Information and communication
2
Finance and insurance
Real estate
0
Professional and technical
Public administration
-2
Arts, entertainement and other services
-40 -20 0 20 40 60 80
-4
2020 2021 2022 2022Q4
Sources: Eurostat and ECB calculations. Notes: For each sector, wages refer to compensation of
Sources: Eurostat and ECB staff calculations. employees and labour income of the self-employed, and profits refer to gross operating surplus, computed
Latest observation: 2022 Q4. as nominal gross value added minus wages. The total labour income of the self-employed is computed
assuming that the per-capita labour income of the self-employed is the same as that of employees and it is
then distributed to each sector according to the sector-specific share of total compensation of employees.
11 Latest observation: 2022 Q4. www.ecb.europa.eu ©Schwankende
Rubric Zinserwartungen aufgrund persistenter Inflation und Finanzinstabilität
Marktbasierte Zinserwartungen im Euroraum Anleiheportfolios und gezielte längerfristige
(in %) Refinanzierungsoperationen (TLTROs)
(EUR Billionen)
Realised Latest (18 Apr)
APP PEPP TLTRO II TLTRO III
1 Dec 2022 Pre-SVB collapse (8 Mar)
Mar SMA 8
Projections
6.0
6
5.0
4.0
4
3.0
2.0 2
1.0
0.0 0
Apr-20 Apr-21 Apr-22 Apr-23 Apr-24
-1.0
Mar-22 Sep-22 Mar-23 Sep-23 Mar-24 Sep-24 Source: ECB, Survey of Monetary Analysts (SMA).
Notes: Blue and yellow bars show Eurosystem aggregated holdings under the asset purchase
Sources: Bloomberg, ECB calculations. programme (APP) and pandemic emergency purchase programme (PEPP) in book amortized values.
Notes: Chart refers to realized and forward €STR levels. SMA refers to the expected level of deposit facility SMA responses for the projections.
rate (DFR). Latest observation 18 April 2023. Latest observation: March 2023.
12
www.ecb.europa.eu ©Deutlicher
Rubric Anstieg der Realzinsen von niedrigem Niveau bei stabilen Renditedifferenzen
10-jähriger realer OIS-Zins im Euroraum Sensitivität von Staatsanleiherenditen
(Prozent) gegenüber geldpolitischen Erwartungen
(Basispunkte, Prozentpunkte)
IT until 15 June 2022 IT after 15 June 2022
3.0
2.5 ES until 15 June 2022 ES after 15 June 2022
200
2.0
1.5 Show EA 10-year 180
160
nominal and real
Sovereign spread over OIS (bps)
1.0
140
0.5 since 2010 zoom-in 120
0.0
since 2022 100
-0.5
80
-1.0 To be 60
-1.5
updated 40
-2.0
-2.5 by IMA 20
2007 2009 2011 2013 2015 2017 2019 2021 2023 0
-1 0 1 2 3 4
Expected terminal rate (percent)
Sources: Bloomberg and ECB calculations. * This chart shows the relationship between the
Sources: Bloomberg. spread of selected sovereign 10-year benchmarks over the 10-year EA OIS rate (y-axis) versus
Latest observation: 17 April 2023. the outright level of the ESTR OIS forward covering the 8th ECB maintenance period from today
(%). The chart differentiates between the period from the start of 2022 until 15 June 2022 (ECB
announcement on activation of PEPP flexibility and work on an anti-fragmentation instrument) and
13 the period thereafter. Latest observation: 14 April 2023. www.ecb.europa.eu ©Aktienmärkte
Rubric bleiben robust trotz höherer Zinsen aufgrund komprimierter Risikoprämien
Treiber der Aktienpreise Risikoprämien am Aktienmarkt
(links: kumulierte Änderung seit Januar 2021, (Prozent)
rechts: Prozent)
Equity risk premium
Risk-free discount rates Change Excess CAPE Yield
Longer-term earnings expectations since Jan Equity Risk Premium
Short-term earnings expectations 16 16
Dividends and share buybacks 2022
EA Total Economy Index 14 14
150 150 12 12
100 100 10 10
8 8
50 50
6 6
0 0 4 4
2 2
-50 -50
0 0
-100 -100 -2 -2
-4 -4
-150 -150 2007 2010 2013 2016 2019 2022
Jan-21 Jul-21 Jan-22 Jul-22 Jan-23 Sources: Refinitiv, IBES, Consensus Economics, Bloomberg and ECB calculations.
Sources: Refinitiv, IBES, Consensus Economics, Bloomberg, and ECB calculations.
Note: The excess CAPE yield is the inverse CAPE minus the risk-free rate. The equity risk
Notes: The decomposition is based on a dividend discount model. The model includes
premium is derived from a dividend discount model. See ECB Economic Bulletin, issue
share-buybacks, discounts future cash-flows with interest rates of appropriate maturity
4/2018 for more details. Latest observation: March 2023 (monthly data).
and includes five expected dividend growth horizons. See ECB Economic Bulletin, issue
4/2018 for more details.
Latest observation: 7 April 2023 (weekly data). 14
www.ecb.europa.eu ©Steigende
Rubric Baufinanzierungskosten führen zu niedrigeren Häuserpreisen
Risikoloser Zins und Baufinanzierungskosten Häuserpreise
für Haushalte (Monatliche Preisindizes – Dezember 2019 = 100)
(% pro Jahr)
Cost of borrowing OIS 5Y
4.0 4.0
3.0 3.0
2.0 2.0
1.0 1.0
0.0 0.0
-1.0 -1.0
2016 2017 2018 2019 2020 2021 2022 2023
Sources: ECB and ECB calculations.
Notes: The cost of borrowing indicator is calculated as a weighted average of MFI interest Sources: Europace, Statistics Netherlands, Eurostat, SDW (U.S. Federal Housing Finance Agency).
rates on short-term and long-term loans to households for house purchase, where the new Notes: RRE stands for Residential Real Estate. Last EA observation from Eurostat is for Q4 2022, so
business volumes used are smoothed with a moving average of the previous 24 months’ several countries with more timely data available are added.
observations. Latest observation: February 2023 for DE, NL, Q4 2022 for US, EA
Latest observation: February 2023 for the cost of borrowing, 11 April 2023 for the OIS 5Y.
15
www.ecb.europa.eu ©Höhere
Rubric Zinsen dämpfen das Kreditwachstum bei Haushalten und Firmen
Kreditstandards und Kreditnachfrage Bankkredite nach Schuldnertyp
von Haushalten für Hauskäufe (jährliche prozentuale Änderung)
(Prozentualer Nettoanteil der Banken, die ein Anziehen oder eine Lockerung
vermelden)
Other factors Use of alternative finance
Banks' risk tolerance Other financing needs
Risk perceptions General level of interest rates
Competition Consumer confidence Loans to firms Loans to households
Cost of funds and BSC Housing market prospects
Credit standards - actual Demand - actual 10
Credit standards - expected Demand - expected
40 80
8
40
30
0 6
20
-40
4
10 -80
-120 2
0
-160
0
-10 -200
2020 Q4 2021 Q4 2022 Q4 2020 Q4 2021 Q4 2022 Q4 2016 2017 2018 2019 2020 2021 2022 2023
Source: ECB (Bank Lending Survey). Sources: ECB (Balance Sheet Statistics) and ECB calculations.
Notes: Net percentages refer to the difference between the percentage of banks reporting a tightening Notes: Loans are adjusted for loan sales and securitization as well as positions arising
(an increase) and the percentage of banks reporting an easing (a decrease). “Other factors” refer to the from notional cash pooling services provided by MFIs.
further factors which were mentioned by the banks as having contributed to changes in credit standards. Latest observation: February 2023.
“BSC” for “balance sheet constraints”. The separate factors are also reported in net terms but do not sum
to the net tightening of credit standards (net increase in loan demand). 16
www.ecb.europa.eu ©
Latest observation: 2022 Q4 (January 2023 Bank Lending Survey).Turbulenzen
Rubric dämpfen Marktpreise im Finanzsektor, geringere Effekte im Euroraum
Aktienpreise Renditedifferenzen Renditedifferenzen
(Index, Januar 2022 = 100) erstklassiger Anleihen erstklassiger Anleihen
(IG) im Finanzsektor (IG) im Nicht-Finanzsektor
Banken Nicht-Finanzsektor (Basispunkte) (Basispunkte)
EA US EA US
450
120 120 450
400
400
110 110
350 350
100 100 300 300
90 90 250 250
200 200
80 80
150 150
70 70
100 100
60 60
50 50
50 50 0 0
Jan-22 Jan-23 Jan-22 Jan-23 Jan-20 Jan-22 Jan-20 Jan-22
Sources: iBoxx, ECB calculation.
Sources: Bloomberg, ECB calculations. Notes: NFC series are based on standard S&P500 and
Latest observation: 18 April 2023.
Eurostoxx incides, stripped of banks and financial sectors. Daily data. Last observation: 18 April 2023.
17
www.ecb.europa.eu ©Bankensektor
Rubric im Euroraum weist robuste Liquiditäts- und Eigenkapitalquoten auf
Liquiditätsquoten der Banken Eigenkapitalquoten der Banken
(links: € Billionen, rechts: Prozent, Q3 2016 – Q4 2022) (Prozent der gesamten risikogewichteten Aktiva, Q1 2015- Q4 2022)
Central bank reserves
CET1 ratio 10th-25th percentile
Government bonds
CET1 ratio 25th-75th percentile
Other
LCR (right-hand scale) CET1 ratio median
NSFR (right-hand scale) CET1 ratio
20
5 180
19
170 18
4
17
160
3 16
150 15
2 14
140
13
1 12
130
11
0 120
2017 2019 2021 10
2015 2017 2019 2021
Source: ECB Supervisory Banking Statistics. Source: ECB Supervisory Banking Statistics.
Note: Based on a sample of 84 Significant Institutions. Note: Based on a sample of 84 Significant Institutions.
www.ecb.europa.eu ©
18Zinsanstieg
Rubric stützt kurzfristig Profitabilität der Banken, aber nicht ihr ökonomisches Kapital
Zerlegung der Änderung der Eigenkapitalrendite Effekt einer parallelen Aufwärtsverschiebung der
(Prozent der risikogewichteten Aktiva, Q4 2021- Q4 2022) Zinsstrukturkurve um 200 Basispunkte
(X-Achse: Prozent des CET1 Kapitals, Y-Achse: Dichte, Q4 2022)
Positive contribution Change in NII as a share of CET1 capital
Negative contribution Change in bank net worth as a share of CET1 capital
13 0.16
12
0.14
11
10 0.12
9
0.10
8
7
0.08
6
5 0.06
4
0.04
3
2 0.02
1
0.00
0 -20 -15 -10 -5 0 5 10 15 20
ROE 2021 Op. income Op. LLP Other P&L Equity ROE 2022
Q4 expenses Q4
Source: ECB Supervisory Banking Statistics.
Note: Based on Q4 2022 data. The kernel density shows the distribution of a sample of 100 euro
area Significant Institutions. Data is based on supervised banks' self-reported sensitivity
Source: Bloomberg and ECB calculations.
estimates to a 200 basis point parallel shift of the yield curve. Changes in NII are based on a 12-
Note: Based on a sample of 29 listed euro area Significant Institutions.
month horizon, the change in bank-net worth goes beyond the 12-month horizon, accounting also
for the longer-term impact (e.g. due to gradually rising funding costs).
19 www.ecb.europa.eu ©Umschichtung
Rubric von Sicht- in Termineinlagen, während Einlagenzins nur langsam anzieht
Sicht- und Termineinlagen Einlagenzins vs. €STR
(Prozent pro annum)
des nicht-finanziellen Privatsektors
(monatliche Ströme, EUR Milliarden)
From 10th to 90th percentile Average deposit rate €STR
Overnight deposit flows Time deposit flows Firms Households
5 5
100 100
4 4
50 50
3 3
0 0
2 2
-50 -50
1 1
-100 -100 0 0
-150 -150 -1 -1
Jan-22 Apr-22 Jul-22 Oct-22 Jan-23 2007 2012 2017 2022 2007 2012 2017 2022
Source: ECB. Notes: Time deposits are those with a maturity up to two years. Sources: ECB (iBSI, iMIR).
Latest observation: February 2023. Notes: Distribution of composite deposit rates on firms’ (lhs) and households’ (rhs)
newly issued deposits weighted by outstanding amounts (cumulated over six months).
20 The average deposit rate is taken from the aggregate MIR data.
Latest observation: February 2023.
www.ecb.europa.eu ©Strukturelle
Rubric Veränderungen führen zu Risiken aus CRE bei Banken und Nicht-Banken
Anteil der Wohn- (RRE) und Gewerbeimmobilien- Anteil der Immobilien-Investmentfonds (REIFs)
kredite (CRE) am gesamten Kreditvolumen am Markt für Gewerbeimmobilien (CRE)
(% der gesamten Kredite und Vorschüsse, Q3 2022) (Q4 2013 – Q4 2022; CRE-Aktiva von REIFs in Prozent des gesamten
RRE loans Gewerbeimmobilienmarktes)
CRE loans 70
80
60 IE
70 NL PT
50
60
IT
Q4 2022
40 EA
50 DE
GR
FR
40 30
LT SK
30 20
AT
FI
20 10 EE
10 LV ES
0
0 0 10 20 30 40 50 60 70
EE MT LT LV CY SK NL BE FI PT DE IE BG ES SI AT GR IT HR LU FR EA Q4 2013
Source: Supervisory data and ECB calculations. RRE (Residential Real Estate) loans are loans Sources: ECB IVF (Investment Funds Balance Sheet Statistics), RCA, C&W, MSCI & ECB calculations.
to households collateralised by residential immovable property and CRE (Commercial Real Notes: ‘CRE assets’ include non-financial assets, debt securities, shares and other equity. LU excluded
Estate) loans are loans to NFC (Non-Financial Corporation) collateralised by commercial for readability.
immovable property as a share of total loans and advances. Latest observation for Q1 2023: 14/02/2023
Latest observation: Q3 2022.
www.ecb.europa.eu ©
21Vielen Dank für Ihre Aufmerksamkeit!
22 www.ecb.europa.eu ©You can also read


