Gut Microbiome: A Potential Indicator for Differential Diagnosis of Major Depressive Disorder and General Anxiety Disorder
←
→
Page content transcription
If your browser does not render page correctly, please read the page content below
ORIGINAL RESEARCH
                                                                                                                                        published: 13 September 2021
                                                                                                                                       doi: 10.3389/fpsyt.2021.651536

                                                Gut Microbiome: A Potential
                                                Indicator for Differential Diagnosis of
                                                Major Depressive Disorder and
                                                General Anxiety Disorder
                                                Zaiquan Dong, Xiaoling Shen, Yanni Hao, Jin Li, Haoran Li, Haizheng Xu, Li Yin and
                                                Weihong Kuang*
                                                Mental Health Center of West China Hospital, Sichuan University, Chengdu, China

                                                Background: Major depressive disorder (MDD) and general anxiety disorder (GAD) share
                                                many common features, leading to numerous challenges in their differential diagnosis.
                            Edited by:          Given the importance of the microbiota–gut–brain axis, we investigated the differences
                 Andrés Herane-Vives,           in gut microbiota between representative cases of these two diseases and sought to
            University College London,
                       United Kingdom
                                                develop a microbiome-based approach for their differential diagnosis.
                       Reviewed by:             Methods: We enrolled 23 patients with MDD, 21 with GAD, and 10 healthy subjects
                  Kiran Veer Sandhu,            (healthy crowd, HC) in the present study. We used 16S rRNA gene-sequencing analysis
      University College Cork, Ireland
                       Danilo Arnone,           to determine the microbial compositions of the gut microbiome based on Illumina Miseq
      United Arab Emirates University,          and according to the standard protocol.
                United Arab Emirates
                                                Results: GAD showed a significant difference in microbiota richness and diversity as
                   *Correspondence:
                      Weihong Kuang             compared with HC. Additionally, Otu24167, Otu19140, and Otu19751 were significantly
                     kwhhlj@163.com             decreased in MDD relative to HC, and Otu2581 and Otu10585 were significantly
                                                increased in GAD relative to MDD. At the genus level, the abundances of Sutterella and
                   Specialty section:
         This article was submitted to          Fusicatenibacter were significantly lower in MDD relative to HC, and the abundances
         Mood and Anxiety Disorders,            of Fusicatenibacter and Christensenellaceae_R7_group were significantly lower in GAD
               a section of the journal
                Frontiers in Psychiatry
                                                than in HC. The abundance of Sutterella was significantly higher whereas that of
         Received: 10 January 2021
                                                Faecalibacterium was significantly lower in GAD relative to MDD. Moreover, we observed
         Accepted: 19 August 2021               that Christensenellaceae_R7_group negatively correlated with the factor score (Limited
      Published: 13 September 2021
                                                to Hopelessness) and total score of HAMD-24 (p < 0.05), whereas Fusicatenibacter
                              Citation:
                                                negatively correlated with FT4 (p < 0.05). Furthermore, the GAD group showed significant
    Dong Z, Shen X, Hao Y, Li J, Li H,
 Xu H, Yin L and Kuang W (2021) Gut             differences at the genus level for Faecalibacterium, which negatively correlated with PTC
 Microbiome: A Potential Indicator for          (p < 0.05).
        Differential Diagnosis of Major
    Depressive Disorder and General             Conclusions: This study elucidated a unique gut-microbiome signature associated with
                       Anxiety Disorder.        MDD and GAD that could facilitate differential diagnosis and targeted therapy.
         Front. Psychiatry 12:651536.
     doi: 10.3389/fpsyt.2021.651536             Keywords: gut microbiome, anxiety, depression, 16S ribosomal RNA, differential diagnosis

Frontiers in Psychiatry | www.frontiersin.org                                         1                                    September 2021 | Volume 12 | Article 651536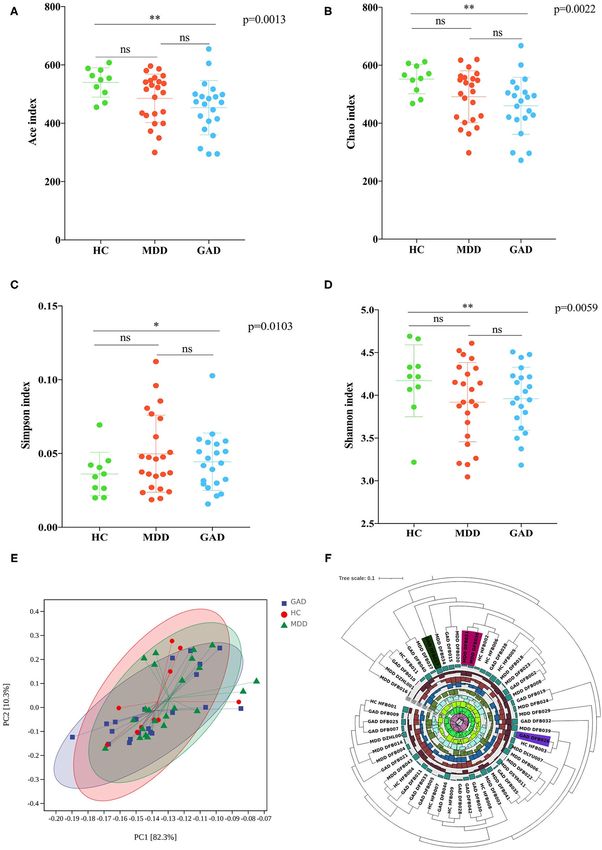
Dong et al.                                                                                               Gut-Microbiome in Depression and Anxiety

INTRODUCTION                                                              Gut microbiota can modulate central processes via endocrine
                                                                          pathways within the microbiota–gut–brain axis (30, 31). Sudo
Major depressive disorder (MDD) is characterized by                       et al. found that elevations in plasma adrenocorticotropic
deep sadness, reduced energy, vegetative nervous system                   hormone (ACTH) and corticosterone levels in response to stress
dysregulation, cognitive dysfunction, and even a high                     were substantially higher in germ-free mice than in specific
suicidal tendency (1). Generalized anxiety disorder (GAD)                 pathogen-free mice (32). Additionally, recent studies report that
is characterized by extreme anxiety about issues, such as security,       germ-free mice, which are devoid of any bacterial contamination,
money, and health, and accompanied by restlessness and                    show reduced depression-like behaviors along with changes in
autonomic dysfunction (2). Anxiety and depression are two                 the hypothalamic–pituitary–adrenal (HPA) axis as compared
common disorders that show high comorbidity (3–5). Although               with specific pathogen-free mice (33, 34). On the other hand,
they share several causal and descriptive features, there are some        numerous studies have verified the relationship between the
associated differences in their clinical features and etiological         hypothalamic–pituitary–thyroid (HPT) or HPA systems and
factors (6). The separation of anxiety and depression disorders is        the onset of depression and anxiety (32, 35). For example,
extremely important for the elucidation of the underlying disease         Brownlie et al. proposed that a dynamic decrease in thyroid
mechanisms and development of specific pharmacological                    hormone levels, particularly FT3 and FT4 (36), could be related
and psychological treatments. Although many studies have                  to depression. Moreover, increased activation of the HPA axis has
distinguished anxiety and depression from the perspective of              been repeatedly observed in depressed patients, especially in the
symptomatology and psychological, social, and physiological               melancholic subtype (37). In most studies, these two relationships
etiology (7–10), there remains no convincing evidence of their            [between depression/anxiety and gut microbiota and between
distinction. To further elucidate the substantial but incomplete          neuroendocrine (HPA/HPT) and gut microbiota] have been
overlap between these disorders, this study sought to determine           studied independently. However, whether the gut microbiota can
whether patients with clinical diagnoses of MDD and GAD can               affect the neuroendocrine system and lead to mental illnesses,
be differentiated based on gut-microbiota features.                       including anxiety and depression, remains unclear.
    The studies conducted in recent decades indicate that gut                 In this study, we compared the differences in the intestinal
microbiota play a crucial role in modulating brain function               flora of patients with anxiety diagnosis to those with depression
and human behavior (11). Furthermore, differences in gut                  diagnosis in order to determine whether intestinal flora can
microbiota have been identified in various psychiatric diseases,          help distinguish between the two groups. To achieve this, we
including depression, bipolar disorder, and schizophrenia (12,            examined MDD and GAD patients without obvious anxiety
13), as well as several animal models of psychiatric diseases (14–        and/or depressive symptoms, respectively, and used 16S rRNA
16). There is evidence for altered microbiota composition in              gene-sequence analysis to help distinguish differences in their
depressed individuals (17–19), with levels of Faecalibacterium            intestinal flora. Additionally, we analyzed the effects of different
negatively correlating with symptom severity (20) and suggesting          bacteria on clinical symptoms and the neuroendocrine system in
that the clinical phenotype of mental illness might be affected           order to further explore their function in these conditions.
by gut microbiota. Additionally, studies show that probiotic
administration of Bifidobacterium longum and Lactobacillus
helveticus can decrease anxiety (21–23). Moreover, Chen
                                                                          MATERIALS AND METHODS
et al. and Jiang et al. found several consistent taxonomic                Subjects
differences, including higher abundances of Enterobacterales,             Patients with MDD and GAD and normal control subjects
Bacteroidaceae, Escherichia/Shigella, Bacteroides, and Tyzerella          participated in this study. Both MDD and GAD patients included
and lower abundances of Firmicutes, Mollicutes, Prevotellaceae,           a series of outpatients who received treatment at the West
Ruminococcaceae, Subdoligranulum, Coprococcus, and Dialister              China Hospital from January to June 2019. All samples were
between participants with GAD and controls (24, 25).                      from Chengdu, Sichuan, China, a relatively geographically closed
    In general, recent studies independently investigated the             area harboring residents with similar eating habits. The patients
characteristics of gut flora in depression and anxiety patients but       were diagnosed according to the Diagnostic and Statistical
did not conduct a comparative analysis. In fact, few studies have         Manual of Mental Disorders (DSM-5) (38) at the first clinical
explored the use of gut flora as a marker for disease diagnosis.          examination, with diagnoses were confirmed by two psychiatrists
For example, recent studies suggest that changes in intestinal            (39). Patients 45 years of age and with organic etiology
microflora might be used as a biomarker for depression diagnosis          for their psychiatric symptoms, psychotic features, or intellectual
and monitoring (26, 27). Zheng et al. recently identified distinct        disability were excluded. Patients included in the study were
gut-microbial compositions in MDD as compared with bipolar                either newly diagnosed with depression or had not used
disorder and provided a novel marker panel to distinguish MDD             psychotropic drugs for at least 6 months. The normal control
from bipolar disorder based on gut-microbiome signatures (28).            subjects included 10 worker volunteers (aged 18–45 years)
To the best of our knowledge, there is currently no information           without current or past major psychiatric disorders. Subjects
concerning differences in intestinal flora as a biological marker         with the following conditions were also excluded: a lifetime
identifying anxiety and depression.                                       history of bipolar disorder, schizophrenia, schizoaffective, or
    Emerging evidence points to a bidirectional communication             other psychiatric disorders; hypertension; cardiovascular disease;
between the neuroendocrine system and gut microbiota (29).                diabetes mellitus; obesity; liver cirrhosis; fatty liver disease;

Frontiers in Psychiatry | www.frontiersin.org                         2                                 September 2021 | Volume 12 | Article 651536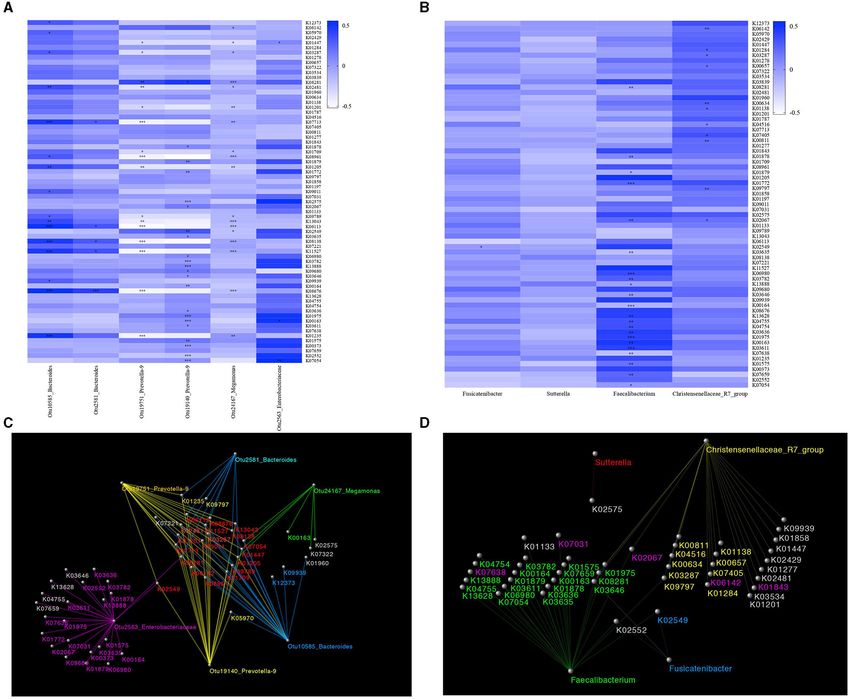
Dong et al.                                                                                                      Gut-Microbiome in Depression and Anxiety

irritable bowel syndrome; inflammatory bowel disease; drug or                      value: 3.6–7.5 pmol/L), and free thyroxine (FT4; normal value:
alcohol abuse in the previous year; use of antibiotics, probiotics,                12.0–22.0 pmol/L). The HPA axis test indicators include ACTH
prebiotics, or synbiotics in the 6 months before fecal sample                      (normal value: 5.0–78.0 ng/L) and 8:00 A.M. cortisol (PTC;
collection; known active bacterial, fungal, or viral infections;                   normal value: 147.3–609.3 mmol/L). Fasting venous blood was
and obvious dietary preferences (e.g., vegetarians). All patients                  taken by drawing 4 mL of cubital venous blood at 8 A.M.
completed the Hamilton Depression Rating Scale (HAMD-24)                           after overnight fasting. All analyses were performed using a
and the Hamilton Anxiety Scale (HAMA) to obtain a clinical                         Roche Cobas e601 module (Roche, Basel, Switzerland) via
rating of the severity of depression and anxiety (40, 41). Both                    electrochemiluminescence. All reagents and calibrations were
scales were independently administered by two psychiatrists that                   performed according to manufacturer instructions.
were blinded to the clinical status of the participants and had
attended a training session on how to administer the tests before
the start of the study. To minimize the impact of accompanying                     Sample Collection and DNA Extraction
symptoms, we also excluded GAD patients with HAMD-24 ≥20                           Fecal samples were immediately frozen upon collection in
and MDD patients with 14-item HAMA ≥14.                                            a sterile plastic cup and stored at −80 ◦ C before analysis.
    All procedures contributing to this work comply with the                       Microbial genomic DNA was extracted using the QIAamp
ethical standards of national and institutional committees on                      DNA stool mini kit (Qiagen, Hilden, Germany) according to
human experimentation and with the Helsinki Declaration of                         manufacturer instructions. The 16S rRNA V3-V4 amplicons were
1975, as revised in 2008. All procedures involving human                           generated using the National Institutes of Health (NIH) Human
subjects and patients were approved by the Ethics Committee of                     Microbiome Project protocols (16S 454 Sequencing Protocol
West China Hospital of Sichuan University (approval number:                        HMP Consortium; https://www.hmpdacc.org).
2019-268). Written informed consent was obtained from all
study subjects.
                                                                                   16S rRNA Gene-Sequencing Analysis
                                                                                   Libraries were prepared and paired-end sequenced with Illumina
Neuroendocrine Hormone Analysis                                                    Miseq according to manufacturer instructions (42). These
The HPT axis test indicators include thyroid-stimulating                           QIIME2 16S rRNA sequencing protocols were used to select
hormone (TSH; normal value: 0.27–4.2 mU/L), triiodothyronine                       and analyze operational taxonomic units (OTUs) (43). Sequences
(T3; normal value: 1.3–3.1 mmol/L), thyroxine (T4; normal                          from this project were deposited in the NCBI Short Read Archive
values: 62.0–164.0 mmol/L), free triiodothyronine (FT3; normal                     under BioProject ID PRJNA647236.

TABLE 1 | Clinical and demographic characteristics of the MDD, GAD, and HC groups.

GROUP                                                MDD                               GAD                          HC                              p

Age (y)                                          30.04 ± 5.90                     30.43 ± 7.95                  30.22 ± 6.50                      0.982
BMI                                              21.87 ± 3.00                     21.19 ± 2.89                  21.45 ± 2.80                      0.743
HAMD-24                                          29.26 ± 7.51                     12.10 ± 5.25                      NA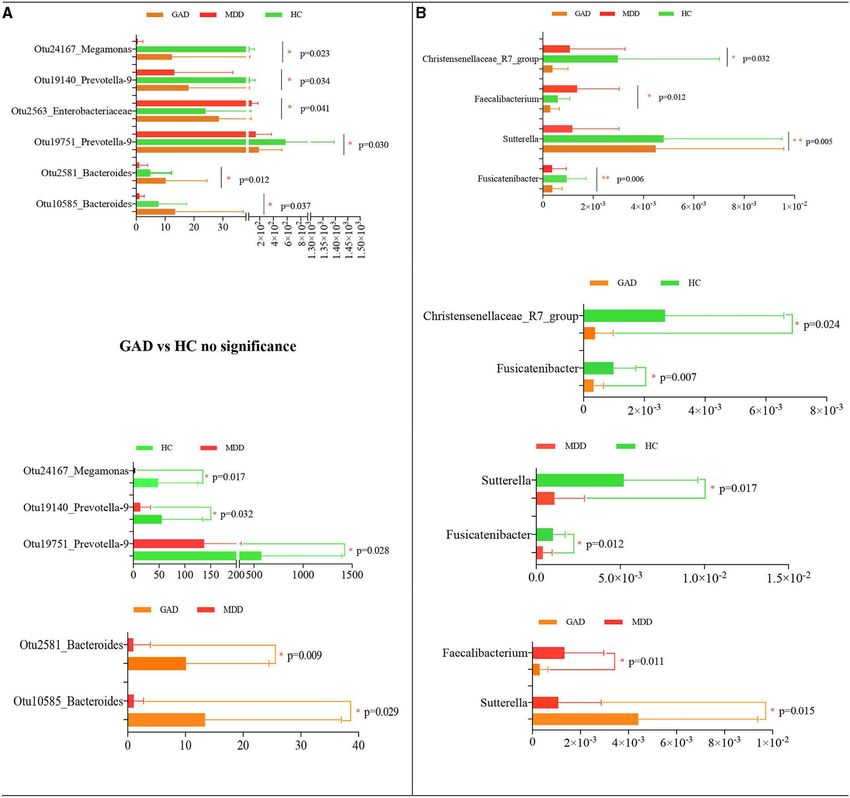
Dong et al. Gut-Microbiome in Depression and Anxiety
Bioinformatic and Statistical Analyses (19 newly diagnosed and two relapsed) subjects in the healthy
The sequence index file generated from the sequencing crowd (HC), MDD, and GAD groups, respectively. The mean
experiment was used to identify and extract the sample data saved age at assessment was 30.04 ± 5.90, 30.43 ± 7.95, and 30.22
in FASTQ format. Barcodes and the primers in the beginning ± 6.50 years for the MDD, GAD and HC groups, respectively,
and the end were used to identify and select sequence reads. with no significant difference found between groups according
The sequence number of each sample was normalized, and to ANOVA. Moreover, the BMI, sex ratio, marital status, family
OTUs with 97% identity thresholds were used in the UPARSE history, and levels of neuroendocrine hormones did not differ
(v.7.1; http://drive5.com/uparse/) software program. Chimeric significantly among the three groups (Table 1).
sequences were identified and removed using UCHIME (v.4.1;
http://drive5.com/uchime/). The taxonomy of each 16S rRNA Diversity Analysis (α and β)
gene sequence was analyzed with RDP Classifier (http://rdp.cme. Accounting for 70% of the valid sequences, we obtained
msu.edu/) using the SILVA (SSU 138) 16S rRNA database at a 1,620,000 high-quality sequences from the 54 fecal samples of all
confidence threshold of 70% (44). participants: the HC, MDD, and GAD groups contained 630,000,
Gut-microbiota-specific microbial characteristics were 690,000, and 300,000 sequences, respectively. The richness of
subjected to analysis of variance (ANOVA), emphasizing both gut bacterial communities in all three groups was estimated by
statistical significance and biological relevance. ANOVA was ACE and Chao indices, and the diversity was estimated using
used to compare the relative abundance of microbes identified the Shannon and Simpson diversity indices. ACE and Chao
with 16S rRNA sequencing. analysis showed that most of the gut microbial diversity in each
Statistical analyses were performed using SPSS (v.21.0; sample had been captured with the current sequencing depth.
IBM Corp., Armonk, NY, USA). One-way ANOVA was used After rarefying the sequencing depth among all samples using
to compare the continuous variables, including age, BMI, a bootstrap method (30,000 reads per sample), the Shannon
and clinical scales. Fisher’s exact test was used to analyze and Simpson diversity index estimates were calculated, revealing
contingency tables, and the chi-squared method was used to no significant difference in richness and diversity between HC
compare the variables of all three groups. A p < 0.05 was and MDD. However, GAD showed a significant difference
considered significant. The false recovery rate representing in microbiota richness and diversity as compared with HC
the threshold correction was generated using the Benjamini– (Figures 1A–D). To explore the differences in the comprehensive
Hochberg method (45). microbial phenotypes of MDD, GAD, and HC, we performed
The α-diversity was calculated by the ACE, Chao, Simpson, β-diversity analysis. Among the three groups, statistical analysis
and Shannon indices. Mann–Whitney U tests were used to of β-diversity at the genus level indicated that the distance was
identify differences between the two groups. The β-diversity similar according to principal component analysis (Figure 1E).
was calculated using the Bray–Curtis index as the distance The hierarchical clustering tree used to describe the similarities
method and reported according to principal component analysis. among different data point categories using the Bray–Curtis
A hierarchical clustering tree was used to describe similarities distance method showed sample similarities between the three
among different data-point categories using the Bray–Curtis groups (Figure 1F).
distance method and visualized using iTOL (https://itol.embl.
de/). Analysis of Fecal Species Community
PICRUSt, a bioinformatics software package that predicts We obtained 10,996, 14,406, and 15,010 species-level OTUs
metagenome functional content from marker gene (e.g., 16S from the HC, MDD, and GAD groups, respectively, using the
rRNA) surveys and full genomes (46), was used to determine OTU cluster method (Table 2). Results of the Venn diagram
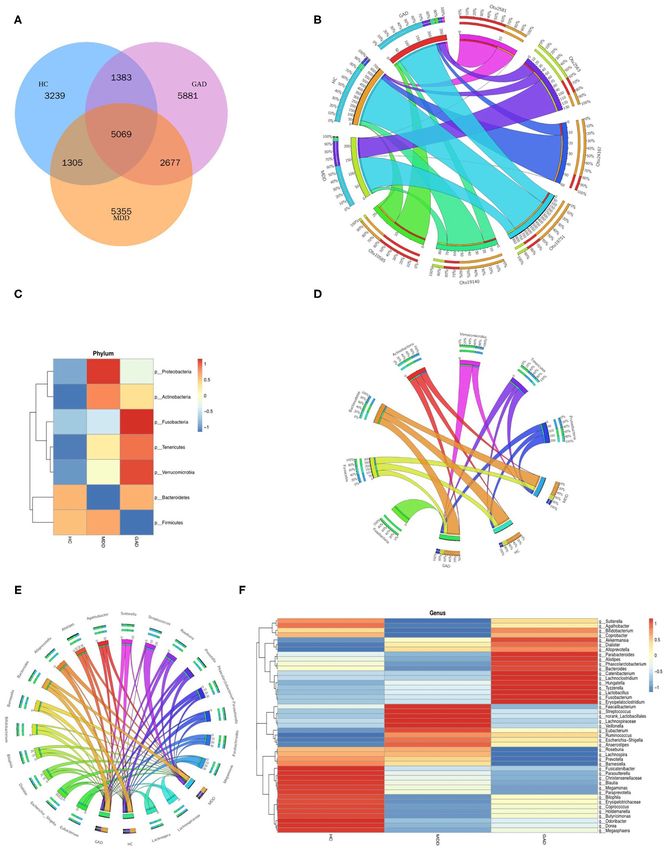
species function. showed that 5,069 OTUs were common to all three groups
Circos software (http://circos.ca/) visualizes data in a circular (Figure 2A). The relationship between samples and OTUs is
layout (47) and was employed to visualize the relationship presented as the Circos diagram (Figure 2B). The general
between samples and species. overview of gut bacterial composition at the phylum and genus
Cytoscape is an open-source software platform for visualizing levels is shown in Figures 2C,E. At the phylum level, the groups
molecular-interaction networks and biological pathways and were rich in Bacteroidetes, Proteobacteria, and Firmicutes, but
integrating these networks with annotations, gene-expression there were differences in terms of abundance. Compared with
profiles, and other state data (48). We used this to determine that in the HC group, we found that the relative abundance
the correlation between significantly different KEGG orthologs of Proteobacteria and Firmicutes increased considerably, and
(KOs) and significantly different OTUs or species. that of Bacteroidetes decreased considerably in the MDD
group. Additionally, the abundance of Firmicutes decreased,
whereas that of Bacteroidetes and Proteobacteria increased in
RESULTS GAD relative to HC vs. MDD (Figure 2C). The relationship
between samples and phylum-level species is presented as the
Demographic Features and Levels of Circos diagram (Figure 2D). At the genus level, we found that
Neuroendocrine Hormone Bacteroides and Prevotella were abundant in the three groups.
We collected 54 fecal samples from the study participants, The abundance of Faecalibacterium decreased and Sutterella,
including 10, 23 (18 newly diagnosed and 5 relapsed), and 21 Fusicatenibacter, and Christensenellaceae_R7_group increased
Frontiers in Psychiatry | www.frontiersin.org 4 September 2021 | Volume 12 | Article 651536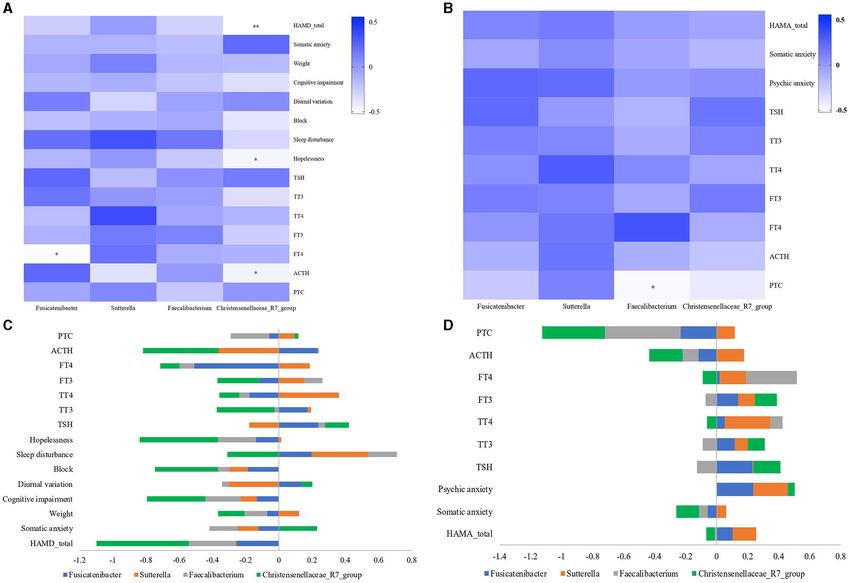
Dong et al.                                                                                                                   Gut-Microbiome in Depression and Anxiety

 FIGURE 1 | Diversity analysis (α and β). (A–D) Analysis of variations in richness (Chao and ACE indices) and diversity (Simpson and Shannon indices). MDD
 compared with HC revealed no significant difference in richness and diversity. GAD compared with HC revealed a significant difference in the richness and diversity. *p
 < 0.05 (Bonferroni < 0.017), **p < 0.01 (Bonferroni < 0.0033). MDD compared with GAD revealed no significant difference in richness and diversity. (E) Results of
 β-diversity visualized using principal component analysis (PCA; Bray–Curtis distance method). (F) Hierarchical clustering tree showing the similarities among different
 categories of data points by the Bray–Curtis distance method. Diversity analysis showed similar species diversity among the three groups.

Frontiers in Psychiatry | www.frontiersin.org                                      5                                       September 2021 | Volume 12 | Article 651536
Dong et al.                                                                                                                Gut-Microbiome in Depression and Anxiety

TABLE 2 | Comparison of phylotype coverage and diversity estimation of the 16S rRNA gene libraries at 97% similarity from the sequencing analysis.

Group       No. of         No. of    Coverage (%)                          Richness estimator                                          Diversity index
            reads          OTUs

                                                       ACE             95% CI            Chao           95% CI             Shannon        Simpson         Evenness

HC          630,000        10,996         97.19       4257.84     4031.74–4506.03       3090.89     2840.24–3395.07      4.733331714      0.032098       0.354556683
MDD         690,000        14,406         97.47       3762.74     3557.59–3989.13       2790.49     2562.74–3069.66      4.647938217      0.036133       0.34454694
GAD         300,000        15,010         96.15       5978.93     5689.91–6291.70       4170.2      3857.99–4538.97        5.017976       0.025108       0.397936241

CI, confidence interval.

in MDD relative to HC. The abundance of Fusicatenibacter                              with Otu19751_Prevotella-9 and Otu19140_Prevotella-9,
and Christensenellaceae_R7_group decreased in GAD relative                            were lower in MDD and higher in GAD relative to HC.
to HC. Compared with that in the MDD group, we found an                               Another KO (K00163), which significantly correlated with
increase in the relative abundance of Fusobacteria, Tenericutes,                      Otu24167_Megamonas, showed higher levels in MDD relative
Verrucomicrobia, and Bacteroidetes but a decrease in that of                          to GAD and HC. Two KOs (K08281 and K03782), which
Proteobacteria, Actinobacteria, and Firmicutes in the GAD group                       significantly correlated with Otu2563_Enterobacteriaceae,
(Figure 2E). The relationship between samples and species is                          showed higher levels in MDD relative to GAD and HC.
illustrated by the Circos diagram (Figure 2F). In summary, we                         Another KO (K07713), which significantly correlated with
found that patients with MDD or GAD showed considerable                               Otu2581_Bacteroides, showed lower levels in MDD relative
changes in gut microbiota, and that there were differences                            to GAD.
in the relative abundance of gut microbiota in patients with                              The correlation between the significantly different KOs and
both disorders.                                                                       species is depicted by a heatmap (Figure 4B). We found that
                                                                                      two KOs (K00657 and K04516) significantly correlated with
Analysis of the Signatures of Gut                                                     Christensenellaceae_R7_group, and that their levels were higher
Microbiota                                                                            in GAD and lower in MDD relative to HC. Two KOs (K08281 and
We the compared the relative abundance of microbial                                   K02067) significantly correlated with Faecalibacterium, and their
composition among the three groups in the discovery set                               levels were higher in MDD and lower in GAD relative to HC. One
at both the OTU and genus levels. We found taxonomic                                  KO (K02549) significantly correlated with Fusicatenibacter, and
differences in fecal microbiota among the HC, MDD, and GAD                            its levels were higher in MDD and lower in GAD relative to HC.
groups and identified six significantly different OTUs that were                      We used a network diagram to explain the relationship between
altered among the three groups (Table 3 and Figure 3A). The                           the significantly different KOs and OTUs/species (Figures 4C,D).
levels of Otu24167, Otu19140, and Otu19751 were significantly
decreased in MDD relative to HC, whereas Otu2563 levels were                          Relationship Between Gut Microbiota and
significantly increased in MDD relative to GAD or HC. Otu2581                         Clinical Parameters
and Otu10585 levels were significantly increased in GAD relative                      As     noted,     we     found      four    bacterial     genera
to MDD. Furthermore, we found no significant difference in the                        (Christensenellaceae_R7_group,                Faecalibacterium,
abundance of OTUs between GAD and HC. Similarly, at the                               Fusicatenibacter, and Sutterella) with differences in MDD
genus level, the abundances of Sutterella and Fusicatenibacter                        and GAD relative to HC or between them. These four
were significantly lower in MDD relative to HC, and both                              bacterial genera can be considered as important genera
Fusicatenibacter and Christensenellaceae_R7_group abundances                          that affect the disease phenotype. To further explore the
were significantly lower in GAD relative to HC. Additionally, the                     functions of these different bacterial genera, we evaluated
abundance of Sutterella was significantly higher, whereas that                        correlations among the relative abundance of bacteria, hormones
of Faecalibacterium was significantly lower in GAD relative to                        (including PTC, ACTH, FT3, FT4, TT3, TT4, and TSH),
MDD (Table 4 and Figure 3B).                                                          and the total and factor scores of HAMD (Hopelessness,
                                                                                      Sleep disturbance, Block, Diurnal/variation, Cognitive
Functional Prediction of Gut Microbiota                                               impairment, Weight, and Anxiety/somatic) in the MDD
We obtained 6910 KOs and mapped them to the KEGG                                      group and those of HAMA (Psychic anxiety and Somatic
database using PICRUSt. A total of 69 significantly different                         anxiety) in the GAD group. We found significant differences
KOs were obtained by ANOVA (Supplementary Material). The                              in correlations at the genus level for Fusicatenibacter and
correlation between significantly different KOs and significantly                     Christensenellaceae_R7_group in MDD patients (Figure 5A).
different OTUs is depicted by a heatmap (Figure 4A). We                               We observed that Christensenellaceae_R7_group negatively
found that the levels of two KOs (K01205 and K09011), which                           correlated with the HAMD factor score (Limited to
significantly correlated with Otu10585_Bacteroides, were                              Hopelessness) and total score (p < 0.05), Fusicatenibacter
significantly lower in MDD and higher in GAD relative to HC.                          negatively correlated with FT4 (p < 0.05), and other key
The levels of one KO (K01201), which significantly correlated                         phylotypes showed no strong correlation. Further, the GAD

Frontiers in Psychiatry | www.frontiersin.org                                     6                                     September 2021 | Volume 12 | Article 651536
Dong et al. Gut-Microbiome in Depression and Anxiety FIGURE 2 | Species composition analysis. (A) Venn diagram of samples with common and unique OTUs. (B) Distribution of OTUs in the three groups. Data were visualized using Circos software (http://circos.ca/). The length of the bars for each sample on the outer ring represents the percentage of species in each sample. (C,E) Stacked bar plots at the phylum and genus levels show species composition according to the relative abundance of species. (D,F) Distribution of species in the three groups at the phylum and genus levels. Frontiers in Psychiatry | www.frontiersin.org 7 September 2021 | Volume 12 | Article 651536
Dong et al.                                                                                                                  Gut-Microbiome in Depression and Anxiety

TABLE 3 | Statistical analysis of the OTUs by ANOVA.

Name          Mean (GAD) Stderr (GAD) Mean (HC) Stderrn (HC) Mean (MDD) Stderr (MDD)                    p          FDR      P (HC-GAD) P (MDD-GAD) P (MDD-HC)

Otu2581       10.0476191      3.1475434              4.5   2.42326685   0.91304348   0.63155822 0.01229678 0.8772808 0.3115826              0.00892584     0.60088641
Otu24167 12.2380952           10.253897          47.5      24.3284242   0.39130435   0.39130435 0.02301388 0.8772808 0.10009871             0.64423469     0.01727706
Otu19751 184.428571          73.8974377         572.4      260.248223   136.826087   49.1125453 0.03020169 0.8772808 0.06111859             0.92991901     0.02841122
Otu19140          18         7.43799768          54.5      25.2666887   13.0434783   4.26377251 0.03421628 0.8772808 0.07042385             0.91925868     0.03153303
Otu10585 13.3333333          5.16781861              7.6   3.10268701       1        0.36658881 0.03721526 0.8772808 0.60101603              0.0285381     0.50097406
Otu2563       28.5238095     10.8974919          23.9      15.2683041   79.4347826       20.067458   0.0418317 0.8772808 0.98528601          0.0650306      0.1230169

FDR, false discovery rate; Stderr, standard error.

  FIGURE 3 | Statistical analysis of species differences. Taxonomic differences of fecal microbiota between HC, MDD, and GAD groups. Altered levels of specific
  bacterial OTUs and genera in MDD, GAD, and HC. (A) Six dominant bacterial OTUs were altered among the three groups. Otu24167, Otu19140, and Otu19751 were
  significantly decreased in MDD relative to HC. By contrast, Otu2563 was significantly upregulated in MDD relative to GAD or HC. Otu2581 and Otu0585 were
  significantly upregulated in GAD relative to MDD or HC. (B) Four significantly different species at the genus level across the three groups are shown. The abundances
  of Sutterella and Fusicatenibacter were significantly lower in MDD relative to HC. Fusicatenibacter and Christensenellaceae_R7_group abundances were significantly
  lower in GAD relative to HC. The abundance of Sutterella was higher, whereas that of Faecalibacterium was lower in GAD relative to MDD (all multiple comparisons;
  ANOVA tests).

Frontiers in Psychiatry | www.frontiersin.org                                        8                                     September 2021 | Volume 12 | Article 651536
Dong et al. Gut-Microbiome in Depression and Anxiety
P (MDD-HC)
0.01722476
0.01242988
0.12743151
group showed significant differences at the genus level for
0.1834709
Faecalibacterium, which negatively correlated with PTC (p
< 0.05), whereas other key phylotypes showed no strong
correlation (Figure 5B). The columnar stack diagram shows the
correlation between clinical parameters and the significantly
P (MDD-GAD)
0.01566996
0.93707457
0.01100806
0.59744199
different species (Figures 5C,D).
DISCUSSION
P (HC-GAD)
0.85118087
0.00663858
0.81872373
0.02401158
This study is the first to characterize and compare the gut-
microbial compositions of patients with MDD and GAD. Our
findings provide a better understanding of the differences
0.66214192
0.66214192
0.70261169
0.71208711
between these two diseases in terms of their underlying
FDR
mechanisms and will help in identifying novel therapeutic targets
for better treatments.
We identified unique microbial signatures of patients with
0.00479284
0.00595727
0.01248295
0.03155333
MDD and GAD relative to the HC. There was no significant
difference in richness and diversity between the HC and patients
p
with MDD. Consistent with this finding, numerous studies have
reported no differences between MDD and control groups across
Stderr (MDD)
all examined indices (49–51). However, some studies found
0.00037587
0.00011939
0.00034548
0.00045173
decreased α-diversity in depressive disorders using the Shannon
index (52, 53), as well as significant differences in β-diversity
between participants with a depressive disorder and those in
the control group (19, 52, 54–58). Based on the taxonomic
Mean (MDD)
0.00106652
0.00037304
0.00131739
0.00101304
findings in this study, Otu24167, Otu19140, and Otu19751 were
significantly decreased in MDD as compared with HC, and
the abundance of Sutterella and Fusicatenibacter at the genus
level was significantly lower in patients with MDD than in the
HC. Previous studies reported a lower Sutterella abundance in
Stderr (HC)
0.00139934
0.00023634
0.00015174
0.00124013
patients with depressive disorders than in the HC (19, 53–55);
however, the association of Fusicatenibacter with depression has
not previously been reported.
We found that the GAD group showed significantly higher
Mean (HC)
0.005187
0.000974
0.000552
0.002671
microbiota richness and diversity than the HC, but there was no
significant difference in OTU abundance between the two groups.
This result differs significantly from previous reports. Chen et al.
and Jiang et al. reported no difference in α-diversity between
Stderr (GAD)
0.00108852
0.0001336
participants with an anxiety disorder and those in the control
7.44E-05
7.86E-05
group, and that participants with GAD showed lower microbiota
TABLE 4 | Statistical analysis of the species by ANOVA.
richness than control group subjects (24, 25). This heterogeneity
of results might be attributed to numerous factors, including
sample size, dietary intake, demographic characteristics of
Mean (GAD)
0.00439143
0.00031762
0.00036429
0.00029
FDR, false discovery rate; Stderr, standard error.
the participants, clinical status, sequencing methods, statistical
methods, and/or the statistical significance threshold chosen
to determine the disease-associated gut microbiota (59, 60).
Based on the taxonomic findings (Figure 3B), Fusicatenibacter
Christensenellaceae_R7_group
and Christensenellaceae_R7_group abundances were lower in
the GAD group than in the HC. Mancabelli et al. reported
Christensenellaceae as one of five taxa considered as a signature
of a healthy gut (61). It is possible that its family might be
Faecalibacterium
Fusicatenibacter
related to affective disorders and neurological diseases (62). For
example, patients with Parkinson’s disease, multiple sclerosis,
Sutterella
Name
and autism have a remarkably lower relative abundance of
Christensenellaceae (63–65).
Frontiers in Psychiatry | www.frontiersin.org 9 September 2021 | Volume 12 | Article 651536Dong et al. Gut-Microbiome in Depression and Anxiety FIGURE 4 | Functional prediction. Results of gut microbial functional pathway analyses. KOs were determined using PICRUSt. The significance of functional pathway prediction was determined by ANOVA (Supplementary Material). We obtained 69 significantly different KOs. The correlations between OTUs or species and KOs according to a heatmap are shown. Color variation indicates correlation, “+” indicates positive correlation, and “–” indicates negative correlation. *p < 0.05, **p < 0.01, ***p < 0.005. The network was used to show the correlation between significantly different KOs and OTUs or species using Cytoscape software. (A) The correlation between significantly different KOs and OTUs is shown in a heatmap. Sixteen KOs were significantly correlated with Otu10585_ Bacteroides, five KOs were significantly correlated with Otu2581_Bacteroides, 16 KOs were significantly correlated with Otu19751_Prevotella-9, 18 KOs were significantly correlated with Otu19140_Prevotella-9, 22 KOs were significantly correlated with Otu2563_Enterobacteriaceae, and three KOs were significantly correlated with Otu24167_Megamonas. (B) The correlation between significantly different KOs and species is shown in a heatmap. Eleven KOs were significantly correlated with Christensenellaceae_R7_group, 22 KOs were significantly correlated with Faecalibacterium, and one KO was significantly correlated with Fusicatenibacter. (C) Network diagram showing the relationship between significantly different KOs and OTUs. Different colors represent different OTUs. The same color between Kos and OTUs indicates a significant correlation. The red KOs represent significant correlations between KOs and multiple OTUs. (D) Network diagram showing the relationship between significantly different KOs and species. Different colors represent different species, and the same color indicates a significant correlation. The most important focus of this study was on distinguishing patients with GAD and patients with MDD, indicating between MDD and GAD, and several significant differences that their intestinal floras were similar. Additionally, we were observed. Compared with patients with GAD, Otu2581 found that Otu10585_Bacteroides significantly correlated with and Otu10585 levels were significantly reduced, whereas K09011 (map00290, valine, leucine, and isoleucine biosynthesis). the abundance of Sutterella was decreased and that of Various studies also reported that MDD is associated with Faecalibacterium was increased at the genus level in patients aberrant branched-chain amino acid and energy metabolism with MDD. However, no significant differences were observed (66), suggesting that these amino acids (valine, leucine, in the α-diversity and richness of the intestinal floras between and isoleucine) might serve as appropriate biomarkers for Frontiers in Psychiatry | www.frontiersin.org 10 September 2021 | Volume 12 | Article 651536
Dong et al.                                                                                                                Gut-Microbiome in Depression and Anxiety

 FIGURE 5 | Relationship between gut microbiota and clinical parameters. Heatmaps were used to show relationships between significant differences in microbiota
 and clinical parameters, including hormones (PTC, ACTH, FT3, FT4, TT3, TT4, and TSH), the total and factor scores of HAMD (Hopelessness, Sleep disturbance,
 Block, Diurnal/variation, Cognitive impairment, Weight and Anxiety/somatic) in the MDD group, and the total and factor scores of HAMA (Psychic anxiety and Somatic
 anxiety) in the GAD group. (A) In the MDD group, Fusicatenibacter was significantly negatively correlated with FT4 (p < 0.05), and Christensenellaceae_R7_group was
 significantly negatively correlated with HAMD (p < 0.01), Hopelessness, and ACTH (p < 0.05). (B) In the GAD group, Faecalibacterium was significantly negatively
 correlated with PTC (p < 0.05). (C,D) The stacked bar plot was used to show the relationship between gut microbiota and clinical parameters (“–” shows a negative
 correlation, and “+” shows a positive correlation).

depression (67). We speculate that depression might be                                associated with inflammatory responses and is found in
caused by the influence of Otu10585 on branched-chain                                 abundance in autistic patients (69–71).
amino acids metabolism. Moreover, the present results showed                             To determine why intestinal flora affect the clinical phenotype,
that Faecalibacterium was significantly correlated with K08281                        we analyzed the correlation of some representative floras in
(map00760, nicotinate, and nicotinamide metabolism) and                               patients with MDD or GAD with respect to the HPA or
K02067 (map02010, ABC transporters). Niacin deficiency is                             HPT axis. Our findings (Figure 5) implied that changes in
reportedly a contributing factor in mental-illness development                        intestinal flora might first induce changes in the HPA and/or
and symptom alleviation (66). We speculate that the decreased                         HPT axis, which ultimately lead to the different clinical
abundance of Faecalibacterium might affect nicotinate and                             phenotypes of MDD and GAD. Previous reports indicated
nicotinamide metabolism, leading to variations in correlative                         that gut-microbiota deficiency exacerbates the neuroendocrine
metabolism that result in MDD or GAD. ABC transporters                                and behavioral responses to acute stress (72–74). Other studies
exert notable effects on pathogen–host interactions and bacterial                     have also found a close relationship between HPT/HPA-
physiology (68), which might indicate another pathway of                              axis dysfunction and depression/anxiety (32, 35, 36, 75, 76).
Faecalibacterium that results in GAD or MDD; however, the                             For example, a dynamic decrease in thyroid hormone levels
specific mechanism requires further study. Furthermore, the                           (particularly FT3 and FT4) is reportedly closely related to
roles of Sutterella and Otu2581 remain unclear, although                              depression (36). These observations are consistent with the
previous studies report that Sutterella is an intestinal flora                        present findings and implications.

Frontiers in Psychiatry | www.frontiersin.org                                    11                                     September 2021 | Volume 12 | Article 651536
Dong et al.                                                                                                                   Gut-Microbiome in Depression and Anxiety

   Additionally, we observed that Christensenellaceae_R7_group                          ETHICS STATEMENT
negatively correlated with factor (Limited to Hopelessness)
and total scores of HAMD, suggesting that although                                      The studies involving human participants were reviewed and
Christensenellaceae_R7_group has not been observed as enriched                          approved by the Ethics Committee of West China Hospital
in patients with MDD, it might affect the clinical manifestations                       of Sichuan University. The patients/participants provided their
and severity of MDD. Similar conclusions have been confirmed                            written informed consent to participate in this study.
in other studies (20, 54).
   This study has some limitations. First, the sample size                              AUTHOR CONTRIBUTIONS
was relatively small with no power calculation, which might
have resulted in sampling bias. Second, the 16S rRNA                                    ZD and WK: conception of the work, final approval of the version
gene sequencing used in this study resulted in limited                                  to be published, and agreement to be accountable for all aspects
functional information; therefore, whole-genome and whole-                              of the work. ZD, XS, YH, JL, HL, HX, and LY: acquisition of data.
macrotranscriptome sequencing need to be performed in future                            ZD and LY: analysis and interpretation of data for the work. ZD:
studies. Third, we did not use standardized diagnostic tools to                         writing. WK: revising the work. All authors contributed to the
diagnose patients, assess the mental state of HCs and exclude                           article and approved the submitted version.
comorbidities, which may weaken the reliability of the results.
Last, other influential factors, such as food intake and physical                       FUNDING
activity, were not considered, which might also cause bias.
   In summary, this study characterized and identified different                        This work was supported by the National Natural Science
gut-microbial compositions in subjects with MDD, subjects                               Foundation of China [Grant Nos. 81621003, 81801350, and
with GAD, and the HC. We identified a correlation between                               81801357] and the Key R&D Projects of Science and Technology
the bacteria and clinical symptoms, including a significant                             Department of Sichuan Province (Grant No. 2019YFS0217).
negative correlation between Christensenellaceae_R7_group and
HAMD score. Moreover, we conducted a preliminary analysis                               ACKNOWLEDGMENTS
of possible mechanisms underlying intestinal flora-affecting
diseases. Our findings suggest that intestinal microflora might                         We thank Asbios (Tianjin) Biotechnology Co., LTD. for their
serve as molecular markers for distinguishing MDD from GAD.                             help with microbiological analysis. We would also like to thank
                                                                                        Editage for English language editing.
DATA AVAILABILITY STATEMENT
                                                                                        SUPPLEMENTARY MATERIAL
The datasets presented in this study can be found in online
repositories. The names of the repository/repositories                                  The Supplementary Material for this article can be found
and accession number(s) can be found in the                                             online at: https://www.frontiersin.org/articles/10.3389/fpsyt.
article/Supplementary Material.                                                         2021.651536/full#supplementary-material

REFERENCES                                                                               7. Clark LA, Watson D. Tripartite model of anxiety and depression:
                                                                                            psychometric evidence and taxonomic implications. J Abnorm
 1. American Psychological Association. Diagnostic and statistical manual of                Psychol.      (1991)       100:316–36.     doi:      10.1037//0021-843x.100.
    mental disorders-text revision (DSM-IV-TR). Washington: APA. (2000)                     3.316
 2. Decker ML, Turk CL, Hess B, Murray CE. Emotion regulation among                      8. Cohen JR, Young JF, Gibb BE, Hankin BL, Abela JR. Why are anxiety
    individuals classified with and without generalized anxiety disorder. J Anx             and depressive symptoms comorbid in youth? A multi-wave, longitudinal
    Disord. (2008) 22:485–94. doi: 10.1016/j.janxdis.2007.04.002                            examination of competing etiological models. J Affect Disord. (2014) 161:21–
 3. Costello EJ, Mustillo S, Erkanli A, Keeler G, Angold A. Prevalence and                  9. doi: 10.1016/j.jad.2014.02.042
    development of psychiatric disorders in childhood and adolescence. Arch Gen          9. Krueger RF. The structure of common mental disorders. Arch Gen Psychiatry.
    Psychiatry. (2003) 60:837–44. doi: 10.1001/archpsyc.60.8.837                            (1999) 56:921–6. doi: 10.1001/archpsyc.56.10.921
 4. Godfrey K, Yung A, Killackey E, Cosgrave E, Yuen HP, Stanford                       10. Krueger RF, Caspi A, Moffitt TE, Silva PA. The structure
    C, et al. Patterns of current comorbidity in young help-                                and stability of common mental disorders (DSM-III-R): a
    seekers: implications for service planning and delivery. Australas                      longitudinal-epidemiological      study.  J     Abnorm     Psychol.   (1998)
    Psychiatry.     (2005)     13:379–83.      doi:    10.1080/j.1440-1665.2005.            107:216–27. doi: 10.1037//0021-843x.107.2.216
    02217.x                                                                             11. Mayer EA, Knight R, Mazmanian SK, Cryan JF, Tillisch K. Gut microbes
 5. Reiter S, Emodi-Perlman A, Goldsmith C, Friedman-Rubin P, Winocur                       and the brain: paradigm shift in neuroscience. J Neurosci. (2014) 34:15490–
    E. Comorbidity between depression and anxiety in patients with                          6. doi: 10.1523/JNEUROSCI.3299-14.2014
    temporomandibular disorders according to the research diagnostic criteria           12. Dickerson F, Severance E, Yolken R. The microbiome, immunity, and
    for temporomandibular disorders. J Oral Facial Pain Headache. (2015)                    schizophrenia and bipolar disorder. Brain Behav Immun. (2017) 62:46–
    29:135–43. doi: 10.11607/ofph.1297                                                      52. doi: 10.1016/j.bbi.2016.12.010
 6. Goldberg D. Towards DSM-5: the relationship between generalized                     13. Rogers GB, Keating DJ, Young RL, Wong ML, Licinio J, Wesselingh S. From
    anxiety disorder and major depressive episode. Psychol Med. (2008)                      gut dysbiosis to altered brain function and mental illness: mechanisms and
    38:1671–5. doi: 10.1017/s003329170800295x                                               pathways. Mol Psychiatry. (2016) 21:738–48. doi: 10.1038/mp.2016.50

Frontiers in Psychiatry | www.frontiersin.org                                      12                                      September 2021 | Volume 12 | Article 651536
Dong et al. Gut-Microbiome in Depression and Anxiety
14. Sharon G, Cruz NJ, Kang DW, Gandal MJ, Wang B, Kim YM, et al. Human 32. Sudo N, Chida Y, Aiba Y, Sonoda J, Oyama N, Yu XN, et al.
gut microbiota from autism spectrum disorder promote behavioral symptoms Postnatal microbial colonization programs the hypothalamic-pituitary-
in mice. Cell. (2019) 177:1600–18. doi: 10.1016/j.cell.2019.05.004 adrenal system for stress response in mice. J Physiol. (2004) 558:263–
15. Wong ML, Inserra A, Lewis MD, Mastronardi CA, Leong L, Choo 75. doi: 10.1113/jphysiol.2004.063388
J, et al. Inflammasome signaling affects anxiety- and depressive-like 33. Huo R, Zeng B, Li Z, Cheng K, Li B, Luo Y, et al. Microbiota modulate anxiety-
behavior and gut microbiome composition. Mol Psychiatry. (2016) 21:797– like behavior and endocrine abnormalities in hypothalamic-pituitary-adrenal
805. doi: 10.1038/mp.2016.46 axis. Front Cell Infect Microbiol. (2017) 7:489. doi: 10.3389/fcimb.2017.00489
16. Zheng P, Zeng B, Liu M, Chen J, Pan J, Han Y, et al. The gut microbiome 34. Luo YY, Zeng BH, Zeng L, Du XY Li B, Hua R, et al. Gut
from patients with schizophrenia modulates the glutamate-glutamine- microbiota regulates mouse behaviors through glucocorticoid receptor
GABA cycle and schizophrenia-relevant behaviors in mice. Sci Adv. (2019) pathway genes in the hippocampus. Transl Psychiatry. (2018)
5:eaau8317. doi: 10.1126/sciadv.aau8317 8:187. doi: 10.1038/s41398-018-0240-5
17. Chen Z, Li J, Gui S, Zhou C, Chen J, Yang C, et al. Comparative 35. Holsboer F. The corticosteroid receptor hypothesis of
metaproteomics analysis shows altered fecal microbiota signatures in depression. Neuropsychopharmacology. (2000) 23:477–
patients with major depressive disorder. Neuroreport. (2018) 29:417– 501. doi: 10.1016/S0893-133X(00)00159-7
25. doi: 10.1097/WNR.0000000000000985 36. Brownlie BE, Rae AM, Walshe JW. Wells JE. Psychoses associated
18. Valles-Colomer M, Falony G, Darzi Y, Tigchelaar EF, Wang J, Tito RY, et al. with thyrotoxicosis- ‘thyrotoxic psychosis’ A report of 18 cases,
The neuroactive potential of the human gut microbiota in quality of life and with statistical analysis of incidence. Eur J Endocrinol. (2000)
depression. Nat Microbiol. (2019) 4:623–32. doi: 10.1038/s41564-018-0337-x 142:438–44. doi: 10.1530/eje.0.1420438
19. Zheng P, Zeng B, Zhou C, Liu M, Fang Z, Xu X, et al. Gut 37. Juruena MF, Bocharova M, Agustini B, Young AH. Atypical depression and
microbiome remodeling induces depressive-like behaviors through a pathway non-atypical depression: Is HPA axis function a biomarker? A systematic
mediated by the host’s metabolism. Mol Psychiatry. (2016) 21:786– review J Affect Disord. (2018) 233:45–67. doi: 10.1016/j.jad.2017.09.052
96. doi: 10.1038/mp.2016.44 38. American Psychiatric Association. Diagnostic and Statistical Manual of
20. Jiang H, Ling Z, Zhang Y, Mao H, Ma Z, Yin Y, et al. Altered fecal microbiota Mental Disorders (DSM-5). Philadelphia: American Psychiatric Pub (2013).
composition in patients with major depressive disorder. Brain Behavior & 39. Aizawa E, Tsuji H, Asahara T, Takahashi T, Teraishi T, Yoshida S, et al.
Immunity. (2015) 48:186–94. doi: 10.1016/j.bbi.2015.03.016 Possible association of bifidobacterium and lactobacillus in the gut microbiota
21. Jang HM, Lee HJ, Jang SE, Han MJ, Kim DH. Evidence for interplay of patients with major depressive disorder. J Affect Disord. (2016) 202:254–
among antibacterial-induced gut microbiota disturbance, neuro- 7. doi: 10.1016/j.jad.2016.05.038
inflammation, and anxiety in mice. Mucosal Immunol. (2018) 40. Hamilton M. Rating depressive patients. J Clin Psychiatry. (1980) 41:21–
11:1386–97. doi: 10.1038/s41385-018-0042-3 4. doi: 10.1111/j.1469-7610.1980.tb00039.x
22. Messaoudi M, Lalonde R, Violle N, Javelot H, Desor D, Nejdi A, 41. Hamilton M. The assessment of anxiety states by rating. Br J Med Psychol.
et al. Assessment of psychotropic-like properties of a probiotic (1959) 32:50–5. doi: 10.1111/j.2044-8341.1959.tb00467.x
formulation (Lactobacillus helveticus R0052 and Bifidobacterium 42. Bartram AK, Lynch MD, Stearns JC, Moreno-Hagelsieb G, Neufeld JD.
longum R0175) in rats and human subjects. Br J Nutr. (2011) Generation of multimillion-sequence 16S rRNA gene libraries from complex
105:755–64. doi: 10.1017/S0007114510004319 microbial communities by assembling paired-end illumina reads. Appl
23. Mohammadi AA, Jazayeri S, Khosravi-Darani K, Solati Z, Mohammadpour Environ Microbiol. (2011) 77:3846–52. doi: 10.1128/AEM.02772-10
N, Asemi Z, et al. The effects of probiotics on mental health and 43. Kuczynski J, Stombaugh J, Walters WA, Gonzalez A, Caporaso
hypothalamic-pituitary-adrenal axis: a randomized, double-blind, placebo- JG, Knight R. Using QIIME to analyze 16S rRNA gene sequences
controlled trial in petrochemical workers. Nutr Neurosci. (2016) 19:387– from microbial communities. Curr Protoc Microbiol. (2012) 1:1E
95. doi: 10.1179/1476830515Y.0000000023 5. doi: 10.1002/9780471729259.mc01e05s27
24. Chen Y, Bai J, Wu D, Yu S, Qiang X, Bai H, et al. Association between 44. Yilmaz P, Parfrey LW, Yarza P, Gerken J, Pruesse E, Quast C, et al. The SILVA
fecal microbiota and generalised anxiety disorder: Severity and early and “All-species Living Tree Project (LTP)” taxonomic frameworks. Nucleic
treatment response. J Affect Disord. (2019) 259:56–66. doi: 10.1016/j.jad.2019. Acids Res. (2014) 42:D643–8. doi: 10.1093/nar/gkt1209
08.014 45. Ghosh D. Wavelet-based benjamini-hochberg procedures for multiple testing
25. Jiang H, Zhang X, Yu Z, Zhang Z, Deng M, Zhao J, et al. Altered gut microbiota under dependence. MBE. (2019) 17:56–72. doi: 10.3934/mbe.2020003
profile in patients with generalised anxiety disorder. J Psychiatr Res. (2018) 46. Langille MGI, Zaneveld J, Caporaso JG, Mcdonald D, Knights D,
104:130–6. doi: 10.1016/j.jpsychires.2018.07.007 Reyes JA, et al. Predictive functional profiling of microbial communities
26. Chen JJ, Zheng P, Liu YY, Zhong XG, Wang HY, Guo YJ, et al. using 16S rRNA marker gene sequences. Nat Biotechnol. (2013) 31:814–
Sex differences in gut microbiota in patients with major depressive 21. doi: 10.1038/nbt.2676
disorder. Neuropsychiatr Dis Treat. (2018) 14:647–55. doi: 10.2147/NDT. 47. Bunting SF, Nussenzweig A. End-joining, translocations and cancer. Nat Rev
S159322 Cancer. (2013) 13:443–54. doi: 10.1038/nrc3537
27. Lin P, Ding B, Feng C, Yin S, Zhang T, Qi X, et al. Prevotella and Klebsiella 48. Shannon P, Markiel A, Ozier O, Baliga NS, Wang JT, Ramage
proportions in fecal microbial communities are potential characteristic D, et al. Cytoscape: a software environment for integrated
parameters for patients with major depressive disorder. J Affect Disord. (2017) models of biomolecular interaction networks. Genome Res. (2003)
207:300–4. doi: 10.1016/j.jad.2016.09.051 13:2498–504. doi: 10.1101/gr.1239303
28. Zheng Q, Wang Y, Lu J, Lin W, Chen F, Jiao N. Metagenomic and 49. Chahwan B, Kwan S, Isik A, van Hemert S, Burke C, Roberts L. Gut feelings: A
metaproteomic insights into photoautotrophic and heterotrophic randomised, triple-blind, placebo-controlled trial of probiotics for depressive
interactions in a Synechococcus Culture. MBio. (2020) 11:e03261– symptoms. J Affect Disord. (2019) 253:317–26. doi: 10.1016/j.jad.2019.04.097
19. doi: 10.1128/mBio.03261-19 50. Mason BL Li Q, Minhajuddin A, Czysz AH, Coughlin LA, Hussain SK et al.
29. Farzi A, Fröhlich EE, Holzer P. Gut microbiota and the neuroendocrine Reduced anti-inflammatory gut microbiota are associated with depression and
system. Neurotherapeutics. (2018) 15:5–22. doi: 10.1007/s13311-017-0600-5 anhedonia. J Affect Disord. (2020) 266:394–401. doi: 10.1016/j.jad.2020.01.137
30. Cryan JF, Dinan TG. Mind-altering microorganisms: the impact of the 51. Vinberg M, Ottesen NM, Meluken I, Sørensen N, Pedersen O, Kessing LV,
gut microbiota on brain and behaviour. Nat Rev Neurosci. (2012) 13:701– et al. Remitted affective disorders and high familial risk of affective disorders
12. doi: 10.1038/nrn3346 associate with aberrant intestinal microbiota. Acta Psychiat Scand. (2019)
31. Kelly JR, Kennedy PJ, Cryan JF, Dinan TG, Clarke G, Hyland NP. 139:174–84. doi: 10.1111/acps.12976
Breaking down the barriers: the gut microbiome, intestinal permeability 52. Huang Y, Shi X, Li Z, Shen Y, Shi X, Wang L, et al. Possible association of
and stress-related psychiatric disorders. Front Cell Neurosci. (2015) 14:9:392. firmicutes in the gut microbiota of patients with major depressive disorder.
doi: 10.3389/ fncel.2015.00392 Neuropsychiatr Dis Treat. (2018) 14:3329–37. doi: 10.2147/NDT.S188340
Frontiers in Psychiatry | www.frontiersin.org 13 September 2021 | Volume 12 | Article 651536Dong et al. Gut-Microbiome in Depression and Anxiety
53. Liu Y, Zhang L, Wang X, Wang Z, Zhang J, Jiang R, et al. Similar fecal disorder. PLoS ONE. (2016) 11:e0160542. doi: 10.1371/journal.pone.
microbiota signatures in patients with Diarrhea-predominant irritable bowel 0160542
syndrome and patients with depression. Clin Gastroentorol Hepatol. (2016) 68. Durmort C, Brown JS. Streptococcus pneumoniae lipoproteins
14:1602–11.e5. doi: 10.1016/j.cgh.2016.05.033 and ABC transporters. Streptococcus Pneumoniae. (2015) 181–
54. Ye X, Wang D, Zhu H, Wang D. Li Jing, Tang Yanqing, et al. Gut microbiota 206. doi: 10.1016/B978-0-12-410530-0.00010-7
changes in patients with major depressive disorder treated with vortioxetine. 69. Mangin I, Bonnet R, Seksik P, Rigottier-Gois L, Sutren M, Bouhnik Y, et al.
Front Psychiatry. (2021) 12:641491. doi: 10.3389/fpsyt.2021.641491 Molecular inventory of faecal microflora in patients with Crohn’s disease.
55. Chung YE, Chen H, Chou HL, Chen I, Lee M, Chuang L, et al. Exploration FEMS Microbiol Ecol. (2004) 50:25–36. doi: 10.1016/j.femsec.2004.05.005
of microbiota targets for major depressive disorder and mood related traits. J 70. Gophna U, Sommerfeld K, Gophna S, Doolittle WF. Veldhuyzen van
Pstchiatr Res. (2019) 111:74–82. doi: 10.1016/j.jpsychires.2019.01.016 Zanten SJ. Differences between tissue-associated intestinal microfloras of
56. Kelly JR, Borre Y, O’Brien C, Patterson E, El Aidy S, Deane J, et al. patients with Crohn’s disease and ulcerative colitis. J Clin Microbiol. (2006)
Transferring the blues: Depression-associated gut microbiota induces 44:4136. doi: 10.1128/JCM.01004-06
neurobehavioural changes in the rat. J Psychiatr Res. (2016) 82:109– 71. Williams BL, Hornig M, Parekh T, Lipkin WI. Application of novel
18. doi: 10.1016/j.jpsychires.2016.07.019 PCR-based methods for detection, quantitation, and phylogenetic
57. Lai W, Deng W, Xu S, Zhao J, Xu D, Liu Y, et al. Shotgun metagenomics characterization of Sutterella species in intestinal biopsy samples from
reveals both taxonomic and tryptophan pathway differences of gut children with autism and gastrointestinal disturbances. MBio. (2012)
microbiota in major depressive disorder patients. Psychol Med. (2019) 51:1– 3:e00261–11. doi: 10.1128/mBio.00261-11
12. doi: 10.1017/s0033291719003027 72. Crumeyrolle-Arias M, Jaglin M, Bruneau A, Vancassel S, Cardona A, Dauge
58. Sanada K, Nakajima S, Kurokawa S, Barcelo-Soler A, Ikuse D, Hirata A, V, et al. Absence of the gut microbiota enhances anxiety-like behavior and
et al. Gut microbiota and major depressive disorder: a systematic review and neuroendocrine response to acute stress in rats. Psychoneuroendocrinology.
meta-analysis. J Affect Disord. (2020) 266:1–13. doi: 10.1016/j.jad.2020.01.102 (2014) 42:207–17. doi: 10.1016/j.psyneuen.2014.01.014
59. Cheung SG, Goldenthal AR, Uhlemann AC, Mann JJ, Miller JM, Sublette ME. 73. Hryhorczuk C, Sharma S, Fulton SE. Metabolic disturbances
Systematic review of gut microbiota and major depression. Front Psychiatry. connecting obesity and depression. Front Neurosci. (2013)
(2019) 10:34. doi: 10.3389/fpsyt.2019.00034 7:177. doi: 10.3389/fnins.2013.00177
60. Busche S, Shao X, Caron M, Kwan T, Allum F, Cheung WA, et al. 74. Pellegrini C, Antonioli L, Calderone V, Colucci R, Fornai M, Blandizzi C.
Population whole-genome bisulfite sequencing across two tissues highlights Microbiota-gut-brain axis in health and disease: Is NLRP3 inflammasome
the environment as the principal source of human methylome variation. at the crossroads of microbiota-gut-brain communications? Prog Neurobiol.
Genome Biol. (2015) 16:290. doi: 10.1186/s13059-015-0856-1 (2020) 191:101806. doi: 10.1016/j.pneurobio.2020.101806
61. Mancabelli L, Milani C, Lugli GA, Turroni F, Cocconi D, van Sinderen 75. Burke HM, Davis MC, Otte C, Mohr DC. Depression and cortisol responses
D, et al. Identification of universal gut microbial biomarkers of common to psychological stress: A meta-analysis. Psychoneuroendocrinology. (2005)
human intestinal diseases by meta-analysis. FEMS Microbiol Ecol. (2017) 30:846–56. doi: 10.1016/j.psyneuen.2005.02.010
93:12. doi: 10.1093/femsec/fix153 76. Fenske M. Late-life depressive symptoms are associated with both
62. Waters JL, Ley RE. The human gut bacteria Christensenellaceae are hyperactivity and hypoactivity of the hypothalamic-pituitary-adrenal axis. Am
widespread, heritable, and associated with health. BMC Biol. (2019) J Geriatr Psychiatry. (2007) 15:985. doi: 10.1097/JGP.0b013e318151f9b1
17:83. doi: 10.1186/s12915-019-0699-4
63. Pedrosa Carrasco AJ, Timmermann L, Pedrosa DJ. Management of
Conflict of Interest: The authors declare that the research was conducted in the
constipation in patients with Parkinson’s disease. NPJ Parkinsons Dis. (2018)
absence of any commercial or financial relationships that could be construed as a
4:6. doi: 10.3109/9780203008454-42
potential conflict of interest.
64. Wiesel PH, Norton C, Glickman S, Kamm MA. Pathophysiology
and management of bowel dysfunction in multiple sclerosis. Eur J
Gastroenterol Hepatol. (2001) 13:441–8. doi: 10.1097/00042737-200104000- Publisher’s Note: All claims expressed in this article are solely those of the authors
00025 and do not necessarily represent those of their affiliated organizations, or those of
65. Dan Z, Mao X, Liu Q, Guo M, Zhuang Y, Liu Z, et al. Altered the publisher, the editors and the reviewers. Any product that may be evaluated in
gut microbial profile is associated with abnormal metabolism this article, or claim that may be made by its manufacturer, is not guaranteed or
activity of Autism Spectrum Disorder. Gut Microbes. (2020) endorsed by the publisher.
11:1246–67. doi: 10.1080/19490976.2020.1747329
66. Liu LY, Zhang HJ, Luo LY, Pu JB, Liang WQ, Zhu CQ, et al. Blood Copyright © 2021 Dong, Shen, Hao, Li, Li, Xu, Yin and Kuang. This is an open-access
and urinary metabolomic evidence validating traditional Chinese medicine article distributed under the terms of the Creative Commons Attribution License (CC
diagnostic classification of major depressive disorder. Chin Med. (2018) BY). The use, distribution or reproduction in other forums is permitted, provided
13:53. doi: 10.1186/s13020-018-0211-z the original author(s) and the copyright owner(s) are credited and that the original
67. Baranyi A, Amouzadeh-Ghadikolai O, von Lewinski D, Rothenhausler publication in this journal is cited, in accordance with accepted academic practice.
HB, Theokas S, Robier C, et al. Branched-chain amino acids as No use, distribution or reproduction is permitted which does not comply with these
new biomarkers of major depression–a novel neurobiology of mood terms.
Frontiers in Psychiatry | www.frontiersin.org 14 September 2021 | Volume 12 | Article 651536You can also read