GRAND REOPENING: NEW OPPORTUNITIES, OLD RISKS - 09 June 2021 04 A grand reopening, but a multifaceted recovery - Euler Hermes
←
→
Page content transcription
If your browser does not render page correctly, please read the page content below

Photo by Artem Beliaikin on Unsplash
GRAND REOPENING:
NEW OPPORTUNITIES,
OLD RISKS
09 June 2021
04 A grand reopening, but a multifaceted recovery
09 Markets have already celebrated, now they have to digest
13 Regional outlooks
Allianz Research
Vaccine security will shape the grand reopening. While advanced economies
delivered on immunization campaigns, vaccine hesitancy and second-
EXECUTIVE generation vaccines are first-order priorities. In the meantime, under-
vaccination in Asia and in Emerging Markets may cause desynchronized
growth paths.
SUMMARY A multifaceted recovery: high-pressure economics in the US, low-pressure eco-
nomics in Europe. We expect global GDP to grow by +5.5% in 2021, with the
US being a clear outperformer. In Europe, the return to pre-crisis levels will
take one year more compared to the US (Q1 2022) and the return to the pre-
Covid-19 growth path an extra four years – if it happens at all.
Ludovic Subran, Chief Economist
Revenge spending is happening but residual savings to amount to EUR500bn
+49 (0) 1 75 58 42 725
in Europe, and USD1trn in the US. Consumption will lead the recovery as we
ludovic.subran@allianz.com
expect pent-up demand to reach 3% of GDP in the US and the UK, and around
1.5% of GDP in Europe. However, hoarding behaviors remain for precautiona-
Alexis Garatti, Head of Economic Research ry reasons, complicating policy choices down the road.
alexis.garatti@eulerhermes.com
Inflation, what inflation? Bottlenecks in terms of supply (raw materials, trans-
Eric Barthalon, Head of Capital Markets Research portation capacity, workers) will likely keep cost inflation at a five-year high
eric.barthalon@allianz.com
until the end of 2021. Companies’ pricing power remains limited, notably in
Ana Boata, Head of Macroeconomic Research Europe. Households’ purchasing power will be under pressure as the employ-
ana.boata@eulerhermes.com ment gap (4 million jobs in the Eurozone and more than 7 million in the US)
will keep wage inflation in check. But no monetary inflation is likely as the ve-
Jordi Basco Carrera, Fixed Income Strategist
locity of money is at a record low.
jordi.basco-carrera@allianz.com
Aurélien Duthoit Sector Advisor The Faustian pact between expansionary fiscal and monetary policies is here
aurelien.duthoit@eulerhermes.com to stay. We expect central banks to be patient before hiking rates in 2023
Pablo Espinosa-Uriel, Capital Markets Research Analyst (some exceptions: Norway, New Zealand, the UK by September 2022). Total
pablo.espinosa-uriel@allianz.com global debt increased by more than USD24trn in 2020, including USD12trn of
public debt and USD12trn of private debt. Emerging Markets are more expo-
Françoise Huang, Senior Economist for APAC
sed to a sudden shift in market sentiment, which would impose a disorderly
francoise.huang@eulerhermes.com
adjustment of currencies and debt.
Patrick Krizan, Senior Economist for Fixed Income
patrick.krizan@allianz.com Political crossroads ahead for Europe but no repeat of the 2012 crisis in 2022.
In the Eurozone the Next Generation EU fund and the ECB will support the
Ano Kuhanathan, Sector Advisor and Data Scientist
ano.kuhanathan@allianz.com
recovery and keep financial stress at bay while German-French elections may
create policy surprises. Yet, watch out for heterogeneity.
Maxime Lemerle, Head of Sector and Insolvency Research
maxime.lemerle@eulerhermes.com Credit risk under control. The insolvency puzzle continues as corporate debt
Marc Livinec, Sector Advisor increased to new highs but cash on the balance sheet did, too, and liquidity
marc.livinec@eulerhermes.com support to firms will continue into 2022. European non-financial companies
will have to increase their margins by 1.5pp on average in order to make their
Selin Ozyurt, Senior Economist for France and Africa
debt sustainable.
selin.ozyurt@eulerhermes.com
Patricia Pelayo-Romero, Expert Insurance Green is the new black of industrial policy. The transition towards a cleaner
patricia.pelayo-romero@allianz.com model of growth will require the definition of a real new industrial policy, con-
Manfred Stamer, Senior Economist for Emerging Europe
sisting of generating new fiscal resources, subsidizing the transition, protecting
and the Middle East domestic producers and investing in infrastructure. Over the 2021-50 period,
manfred.stamer@eulerhermes.com annual energy sector investment has to increase by around 1% of global GDP
compared to today's levels to enable a net-zero energy transition. With
Katharina Utermöhl, Senior Economist for Europe USD1.3trn, investment in renewable electricity will need to surpass the highest
katharina.utermoehl@allianz.com level ever spent on fossil fuel supply (USD1.2trn in 2014).
Markus Zimmer, Senior Expert, ESG
markus.zimmer@allianz.com
2
09 June 2021
Political risk remains amid a new US paternalism and tactical multilateralism.
The US has launched a new wave of global and multilateral initiatives for cli-
mate change and tax policies. But such a revival in international engagement
does not necessarily mean unselective multilateralism: so far in 2021, the US
has been the most active with trade protectionist measures and China and
Germany the most targeted (in net terms). While the Asia-Pacific region could
see some acceleration in the expansion and implementation of free trade
agreements (eg. RCEP, CPTPP etc.), it is not immune to pre-existing geopoliti-
cal tensions that have worsened with the Covid-19 crisis (eg. China and the
“Quad”).
Markets’ risk-on music keeps on playing but mind endogenous financial insta-
bilities. Most asset classes are front-running the grand reopening and strong
policy support far better than expected. But the upside is limited now while
growing imbalances increase risks to the downside.
Figure 1: Real GDP growth forecasts, %
NB: Weights in gloabl GDP at market price
NB: fiscal year for India
Sources: Euler Hermes, Allianz Research
3
Allianz Research

       A GRAND REOPENING,
       BUT A MULTIFACETED RECOVERY

 Vaccine security to shape grand reope-                                Multifaceted recovery. High-pressure                                                    19 growth path an extra four years – if
 ning. While advanced economies deli-                                  economics in the US, low-pressure                                                       it happens at all.
 vered on immunization campaigns,                                      economics in Europe. After nearing pre-
 vaccine hesitancy, and second-                                        crisis levels of growth in Q1 2021,                                                     Global trade is set to rebound strongly
 generation vaccines, are first-order                                  fueled by the US and China, the global                                                  in 2021, but bottlenecks will lead to
 priorities. However, avoiding the vacci-                              economy looks set for a strong me-                                                      short-term hurdles. We forecast growth
 nation fatigue trap will be key for a                                 chanical recovery in the coming quar-                                                   of +7.7% in volume terms (after -8.0% in
 sustainable reopening as demand-side                                  ters amidst a grand reopening in seve-                                                  2020) and +15.9% in value terms (after
 hurdles are now following the supply-                                 ral advanced economies. We expect                                                       -9.9% in 2020), supported by favorable
 side ones. In the meantime, under-                                    global GDP to grow by +5.5% in 2021,                                                    base effects, a stronger-than-expected
 vaccination in Asia and in Emerging                                   with the US being a clear outperformer                                                  momentum in the first months of the
 Markets may cause desynchronized                                      and the only economy where growth                                                       year and expectations of robust ex-
 growth paths. Stop-and-go govern-                                     will exceed its pre-Covid-19 path from                                                  ports out of Asia-Pacific, as well as
 ment strategies to cope with the in-                                  the end of the year. In Europe, the re-                                                 strong imports in the US, Europe and
 crease in new cases – albeit more mo-                                 turn to pre-crisis levels will take one                                                 China.
 derate than previous waves - are still                                year more compared to the US (Q1
 likely to continue.                                                   2022) and the return to the pre-Covid-

             Figure 2: Covid-19 sanitary and vaccination situation

                                                 Mexico
                                                                                                                                   5
                                      European
                            1.5         Union
                                                                                                                                              New Zealand
                                   Japan      Argentina Indonesia                                                                  0                    South Korea
                                                                                                                                                                               Indonesia
                                                                                           South Africa
                             1                                                                                                     -5         Hong Kong
                                                                                                          Stringency x Mobility

                                                                 Thailand
                                                        Brazil                         Egypt                                                    Australia                              Japan
                                            Turkey                                                                                -10                                                           Thailand
                            0.5
                                    Chile
                                                     United States
                                                                                                                                  -15
                             0                                                                                                                    Vietnam
                                                                                                                                  -20
                                    European Turkey
                           -0.5                                                                                                                    Singapore                                               Philippines
                                       Union                                                                                      -25
                                                 Indonesia
                                      Mexico
                             -1
                                                Thailand                                                                          -30                                 Taiwan
                                  United States       Egypt
                                  Chile     Argentina Japan
                                                                                                                                  -35
                           -1.5                                                                                                         -10        0        10        20          30       40   50          60
                              01-21 Brazil      05-22                10-23     02-25           06-26
                                                                                                                                                Daily new Covid-19 cases per 1mln people, 7-day average

            Sources: Our World in data, Duke university, Euler Hermes, Allianz Research

4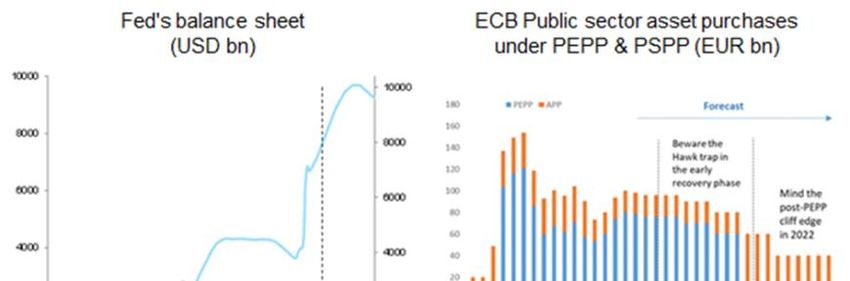
09 June 2021
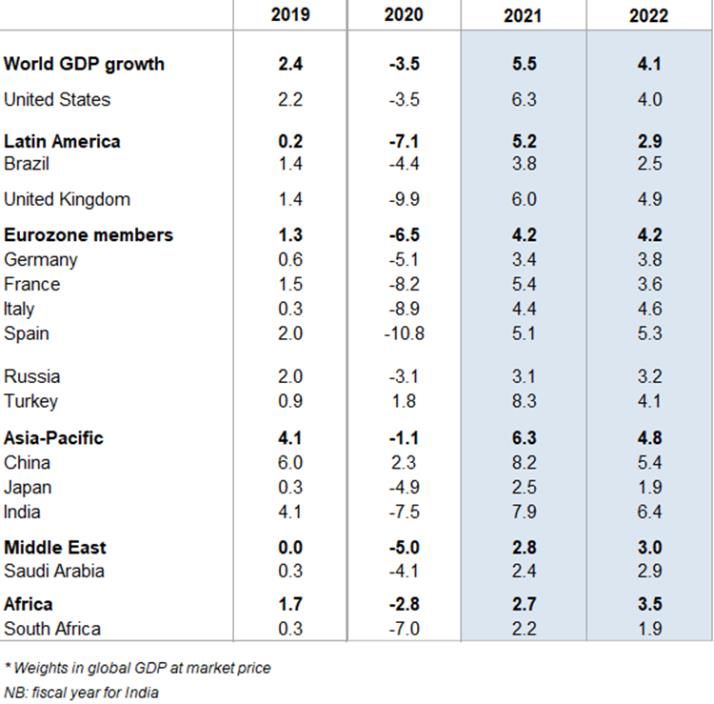
Figure 3: 2022 GDP, compared to 2019 and to pre-crisis forecast
Sources: Various, Euler Hermes, Allianz Research
Indeed, the global exports rebound has same time, global supply chains remain with the rise in input and asset prices.
until now clearly been driven by the disrupted, with suppliers’ delivery times Competition to access the workforce
Asia-Pacific region, with exports from and container prices from Asia at re- will significantly intensify with the grand
most other regions still below pre-crisis cord highs. As effects from fiscal stimuli reopening. The time needed for the
averages. However, the global supply- will start to be even more visible in the reallocation of the workforce, the lower
demand imbalance could be exacer- US as well as in the Eurozone in the incentive to work in the immediate af-
bated during the summer, given new coming months, demand for goods will termath of the reopening (relief effect)
Covid-19 outbreaks in Asia-Pacific, no- remain high (notably for building mate- and the persistence of high social trans-
tably in Taiwan, on which the world has rials and semiconductors), bringing fers could weigh on the pace of the job
become increasingly dependent in the input prices to a record high during the market’s recovery as mirrored by disap-
electronics sector. The impact of these summer. This situation is likely to prevail pointing numbers of non-farm US pay-
outbreaks on trade volume is likely to until the end of the year before de- rolls in April. In the UK, job shortages
be temporary and limited to Q2 (after mand starts normalizing and produc- have continued to intensify since the
which the epidemics in Asia-Pacific tion capacity ramps up, thanks to upco- second stage of eased restrictions in
trade hubs should be controlled), while ming business investments. The key April, notably in the transportation,
high prices due to input shortages are question will remain companies’ pricing construction and catering and hospita-
likely to remain for most of this year. power capacity, which is limited, nota- lity sectors. In the medium-run, negative
bly in Europe1. output gaps should keep wage pres-
Revenge spending is happening but sure in check as well as the employ-
residual savings to amount to Inflation, what inflation? Bottlenecks in ment gap compared to the long-term
EUR500bn in Europe, and USD1trn in terms of supply (raw materials, trans- average (4 million jobs in the Eurozone
the US. The grand reopening sets the portation capacity, workers) will likely and more than 7 million in the US). In
stage for a V-shaped recovery, but glo- keep cost inflation at a five-year high addition, companies have limited pri-
bal supply still needs to catch up. We until the end of 2021. Global inflationa- cing power, notably in Europe. Finally,
estimate pent-up consumption at 3% of ry pressures are at record high levels there is no monetary inflation as the
GDP in the US and UK in 2021, and at but the good news is that they are velocity of money is at a record low.
around 1.5% in most European coun- mainly driven by energy prices and
tries. Consumption will lead the recove- USD appreciation, which should prove
ry but hoarding behaviors remain for temporary. The cost inflation is likely to
precautionary reasons, complicating prevail until 2022, when pressures from
policy choices down the road. At the labor shortages should reduce along
1
See our recent report Pricing superpowers: Which sectors have them in the Eurozone?
5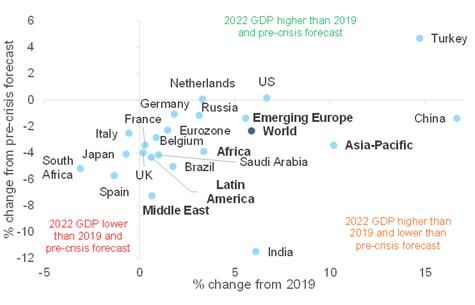
Allianz Research
Figure 4: Inflation forecast
Eurozone core
6% EZ headline
US core Forecast
US headline
5% China
4%
3%
2%
1%
-1%
01/14 01/15 01/16 01/17 01/18 01/19 01/20 01/21 01/22 01/23
Sources: Refinitiv, Euler Hermes, Allianz Research
Faustian pact between expansionary ly, it should move away from pre- APP to continue for seven to 10 months
fiscal and monetary policies to stay. In committing to a quarterly purchase after March 2022. As we have learnt in
the short-term, central banks will conti- pace in an effort to make full use of the past, the ECB tends to have another
nue remaining highly accommodative PEPP’s inherent flexibility. From Sep- trick up its sleeve i.e. limits can be mo-
(with some exemptions such as Norway, tember onwards, the ECB should start ved. In that regard, the results of the
New Zealand and the UK by Septem- to give more guidance on what “life ongoing ECB strategy review expected
ber 2022). The Fed is expected to de- after PEPP” will look like. In particular, in September could come as a game-
ploy some elements of language on the focus will shift to the management changer, including by rolling over
tapering starting next year, with an of the PEPP cliff-edge when the pro- PEPP’s flexibility to APP. Some Emer-
operation twist from Q2 2022 and then grams end in March 2022. The monthly ging Markets should be an exception
a gradual reduction in securities pur- asset purchases under the APP will against rising imported inflation as pro-
chases from USD120bn per month to 0 most likely have to be lifted – at least tection of real household purchasing
in H2 2023, followed by a first rate hike for a few months – to EUR40-60bn to power will remain the focus in an envi-
in H2 2023. The ECB will continue to continue to ensure favorable financing ronment of increasing middle-income
ensure favorable financing conditions conditions. However, this could see the traps and social risk. Brazil, Romania,
during the early phase of the recovery ECB run into German debt limits: We Czechia, South Africa and Nigeria are
even as Eurozone inflation is likely to calculate that EUR40-60bn in monthly likely to hike three times by mid-2022.
overshoot at 2.5% y/y in H2 2021. Ideal- APP purchases would only allow for the
Figure 5: Fed & ECB scenarios
10000
180 PEPP APP Forecast
8000 160
140 Beware the
Hawk trap in
120 the early
6000 recovery phase Mind the
100 post-PEPP
80 cliff edge
in 2022
60
4000
40
20
2000 0
March
March
March
July
July
July
May
September
September
November
May
November
May
September
November
January
January
January
Forecast
0
03 04 05 06 07 08 09 10 11 12 13 14 15 16 17 18 19 20 21 22 23 24
2020 2021 2022
Sources: Refinitiv, Euler Hermes, Allianz Research
609 June 2021
Political crossroads ahead for Europe context, there is a slim chance that the rather than a +40% surge (ceteris pari-
but no repeat of the 2012 crisis in 2022. government pushes for a softened ver- bus estimation). We expect a pragma-
Europe has learned from its crisis mis- sion of the reform that is likely to trigger tic and fine-tuned phasing-out of sup-
takes of the past, so don’t expect to see protests and social unrest again. port measures in order to manage the
any active fiscal or monetary tightening pressure on companies’ liquidity and
before H2 2022. In fact, the Next Gene- Herd policymaking: interventionism will solvability. Indeed, cash on balance
ration EU fund, next to providing a GDP still be at work in 2021. Switching from sheets increased to new highs at a glo-
boost of +1pp in 2021, will also cushion short-term to long-term policy will be bal level but so did corporate debt 3.
fiscal consolidation needs with grants gradual, and a complete withdrawal This will command European non-
not included in national deficit calcula- can take up to one year. Removing financial companies to increase their
tions. Meanwhile the ECB will look state support means a higher risk of operating margins to keep their debt
through the temporary inflation policy mistakes, especially as in theory sustainable (by 1.5pp on average,
overshoot and focus on maintaining firms still hold high cash balances2, everything else being equal). In addi-
favorable financing conditions, closing which might tempt some policymakers tion, the sectorial asymmetry of the
spreads (i.e. Italian fiscal heterogeneity to withdraw assistance mechanisms shock led to wide heterogeneity across
will be managed) and boosting policy faster. The increase in cash balances of sectors in terms of revenue, profits and
room for maneuvering via the strategy non-financial companies as of April impact on balance sheets. De facto,
review as German debt limits are mo- 2021 was EUR180bn in France, credit risk ratings recorded a stronger
ving closer. Among the large EU coun- EUR169bn in the UK, EUR 95bn in Ger- hit in sectors that bore the brunt of so-
tries, Italy will stretch its national fiscal many and EUR81bn in Italy. However, cial and mobility restrictions, such as
space the most (public deficit of 11.8% this cash should finance the recovery hotels and restaurants and transporta-
and 5.8% of GDP in 2021 and 2022) (i.e. stocks and WCR) and the new in- tion, with substantial positive perfor-
and, at the same time, will receive by vestment cycle, not a deleveraging pro- mance conversely in chemicals, phar-
far the largest share from the EU Reco- cess. maceuticals, retail and agrifood. The V-
very Fund (EUR192bn, of which shaped global recovery will lead to a
EUR69bn in grants). The prospect of a Avoiding the mistakes of an early or rebalancing in credit ratings from the
lasting fiscal integration in the EU there- disorderly fiscal tightening will be key wave of deteriorations posted in 2020
fore depends on the success of the Ita- for the sustainability of the recovery. but the heterogeneity across sectors is
lian recovery plan. If the implementa- China is already engaged in reducing likely to prevail until 2023.
tion is effective, Italy could indeed re- its monetary and fiscal impulses and
gain political credibility in the eyes of other countries could be tempted to The global economy could sponta-
the "frugal" sceptics. Capital markets follow suit. However, terminating assis- neously converge toward a new
have yet been complacent with Italy’s tance mechanisms in a premature Marshall plan for a climate-friendly
aggressive fiscal policy. The 10y spread manner could, for example, be the trig- recovery. We calculate that the
over Germany has stabilized in a range ger of a new wave of insolvencies USD2.3trn infrastructure package has
of 110 to 90bp. With ECB purchases, among non-financial companies. Brin- the potential to maintain the US econo-
fiscal variables have indeed lost much ging long-term perspectives to the cor- my’s growth potential at close to +2%
of their explanatory power for spread porate sector with infrastructure pro- by 2030 instead of +1.4% without it.
movements; a dangerous spread- jects and clearly defined industrial poli- However, execution risk could pose a
widening is only likely if the “Draghi put” cies could restore confidence and libe- problem for the EU EUR750bn Recove-
expires and political risk (“Italexit”) rate excess cash in the corporate sec- ry Fund. Accompanying demand over
reappears. In this context, the general tor. In the UK, for example, the phase- the medium-term will be key in order to
elections of H1 2023 are the next deci- out of policy support measures is set to liberate excess savings not consumed
sive event. Factoring in national elec- take a full year. The furlough scheme via pent-up demand. Around 40% of the
tions in other key political heavyweights ends in September 2021 though the excess cash from households and com-
Germany (base case: CDU/Green party reopening started in April. Meanwhile, panies (currently at more than 10% of
coalition) and France will keep a lid on the state-guaranteed recovery loan GDP in both the US and Europe) will
EU integration momentum until spring scheme ends in December 2021, all the morph into spending by year-end,
2022 while thereafter we expect to see discounted business rates end in March thanks to high pent-up demand. The
more evolution (investment in green & 2022, the reduced VAT rate ends in unleashing of the 60% remaining will
digital) than revolution. In France, on April 2022 and the state-guaranteed depend on the size of a positive confi-
the one hand, to avoid any social dis- mortgage loan scheme ends in Decem- dence shock that only a long-term,
content, we do not expect the govern- ber 2022. massive and coordinated fiscal plan
ment to implement any ambitious and can initiate. In the IEA projections
controversial reforms until the elections. (Figure 6), for a net-zero emission com-
An asymmetric normalization of credit
On the other hand, President Macron patible transition, investments need to
risk across sectors. Massive state inter-
will also need to reassure the electorate increase rapidly in electricity genera-
ventions helped suppress a significant
regarding pre-Covid commitments such tion, infrastructure and end-use sectors
wave of insolvencies in 2020, with the
as the pension reform that it still quali- while fossil fuel investment drops shar-
year ending with a -12% drop globally
fies as an “absolute necessity”. In this ply.
2
See our recent report European corporates: cash-rich sectors get richer 7
3
See our recent report European corporates: It could take 5 years to offload Covid-19 debt.Allianz Research
Figure 6: Projected global average annual energy investment needs for the
net-zero energy transition
Fuels
2016-20 Oil
2021-30 Natural gas
2031-40 Coal
Low-emissions fuels
2041-50
Electricity
2016-20 Fossil fuels without CCUS*
2021-30 Fossil fuels with CCUS*
Nuclear
2031-40
Renewables
2041-50 Battery storage
Infrastructure
Electricity grids
2016-20
EV** chargers
2021-30
Hydrogen infrastructure
2031-40 Direct air capture of CO₂
2041-50 CO₂ transport and storage
End-use
Renewables
2016-20 Hydrogen
2021-30 Efficiency
2031-40 Electrification
CCUS*
2041-50
0.5 1.0 1.5 2.0
Trillion USD (2019)
Source: International Energy Agency (2021), Net Zero by 2050, IEA, Paris: Net Zero by 2050
Scenario. *CCUS: Carbon capture, utilization and storage; **EV: Electric vehicle.
In particular, annual investment in elec- forefront of what we could consider as position will offer the possibility to im-
tricity generation would need to in- a new form of paternalism. Disclosure pose new norms (of trade among
crease from about USD0.5trn to can play an important role in fostering others) internationally.
USD1.6trn in 2030. The USD1.3trn of protectionism as supply chain laws
investment in renewable electricity is in coupled with ESG KPIs that, for ins- Such a revival in international engage-
the range of the highest level ever tance, include labor and human rights, ment indeed does not necessarily mean
spent on fossil fuel supply (USD1.2trn in result in diverging investment flows unselective multilateralism. Indeed,
2014). Energy infrastructure should in- away from foreign “red-flagged” activi- trade protectionist measures are still
crease from around USD290bn to ties into domestic ESG overperformers. being implemented in 2021, with the US
USD880bn in 2030 and include electri- being the most active and China and
city networks, public electric vehicle Political risk remains with a form of US Germany the most targeted (in net
(EV) charging stations, hydrogen re- paternalism and tactical multilatera- terms). Regulation affecting digital
fueling stations and import and export lism. Joe Biden’s foreign policy marks a commerce is also becoming increa-
terminals, direct air capture and CO2 revival of large-scale multilateral initia- singly apparent at the global level.
pipelines and storage facilities. In- tives such as the organization of a vir- While the Asia-Pacific region could see
vestments in end-use sectors should rise tual two-day climate summit in April some acceleration in the expansion
from USD530bn to USD1.7trn in 2030 2021 or the proposal of a global mini- and implementation of free trade
and include spending on deep retrofit- mum corporate tax rate of 15%. This agreements (e.g. RCEP, CPTPP etc.), it is
ting of buildings, transformation of in- approach, which could be compared not immune to pre-existing geopolitical
dustrial processes and the purchase of with a form of paternalism or a lea- tensions that have worsened with the
new low-emissions vehicles and more dership by the law or norms, initiates in Covid-19 crisis. Notably, China’s rela-
efficient appliances. our view a form of tactical multilatera- tions with each of the Quadrilateral
lism. In the case of the tax initiative, Security Dialogue members (the US,
Besides supporting demand, large in- there is a strong need to find new fiscal Australia, India and Japan) have
frastructure projects will define new resources. Total global debt has increa- become more tense over the past year,
industrial policies with similarities sed by more than USD24trn between with trade tensions and territorial dis-
across countries, pushing via innovation Q4 2019 and Q4 2020, including putes. While we do not expect these
and subventions towards cleaner ener- USD12trn of public debt and USD12trn issues to become economically signifi-
gy models, fostering digitization. They of private debt. USD10trn of supple- cant in the short term, they are sympto-
will not only maintain a high level of mentary debt is expected to be issued matic of a change of dynamics in the
protectionism, but also result in more in 2021. The need to find new sources geopolitical and global initiative
coordination at a global level in terms of fiscal revenues will imply not only spheres.
of tax policy, using multilateralism and raised taxes at a domestic level but
climate policy as a tactical tool of domi- also at an international level. In terms
nation by the law. The US will be at the of climate change policy, a leadership
809 June 2021
MARKETS HAVE ALREADY CELEBRATED,
NOW THEY HAVE TO DIGEST
The Fed Funds future market does not This rising uncertainty can be seen very inflation, which rose by another 10bps
expect more than a 25bps hike in the clearly when decomposing nominal to close to 2.5% for the 10-year maturi-
next two years. Investors remain thus long-term US yields into their expecta- ty, pushing real yields further into nega-
aligned with the Fed's communication tion and risk components (nominal tive territory (-25bp). But again, the
to deliberately take the risk of being term premium). Since the beginning of breakdown of risk and expectation
behind the curve. However, so far in Q2, the year, the 60bp increase of US 10y components shows that the recent rise
movements in capital markets have yields is almost entirely due to the risk is not due to a change of long-term
been much more muted and con- component (nominal term premium), expectations but to tight market condi-
trasted than in Q1, during which a clear reflecting heightened uncertainty tions (liquidity risk premium). The refla-
growth positioning took hold of all mar- about the economic and monetary tion trade is becoming increasingly
ket segments. Markets have not chal- equilibrium of the post-Covid era. Long- crowded (eg. strong inflows into TIPS
lenged the reflation trade that domi- term expectations about inflation and ETFs) while TIPS supply is withdrawn by
nated Q1, but they are now showing the real equilibrium rate have so far central bank purchases. Adjusted for
more concern about the inflation risk remained anchored. the liquidity risk premium, real yields
and the future course of monetary poli- have actually recovered to pre-crisis
cy. So while the economy is gearing up At first glance, this seems to be at odds levels, so the recovery is already fully
for the grand reopening, capital mar- with the development of break-even priced in.
kets are already one step ahead.
Figure 7: US 10y - breakdown of YtD increase Figure 8: US 10y term premium – breakdown
(different term structure models*) of YtD increase (different term structure models*)
1.0
1.0
0.6
0.6
0.2 0.2
-0.2
-0.2 ACM DKW CLR AZR
ACM DKW CLR AZR
Real term premium Inflation risk premium
Expectation Risk component
*Term structure models used: ACM (Adrian, Crump & Moench, 2013), DKW *Term structure models used: ACM (Adrian, Crump & Moench, 2013), DKW
(D'Amico, Kim & Wei, 2018), CLR (Christensen, Lopez & Rudebusch, 2010) and (D'Amico, Kim & Wei, 2018), CLR (Christensen, Lopez & Rudebusch, 2010) and
AZR (proprietary Allianz Research Model) AZR (proprietary Allianz Research Model)
Sources: Refinitiv, Euler Hermes, Allianz Research Sources: Refinitiv, Euler Hermes, Allianz Research 9Allianz Research
Figure 9: US 10y real yield – recovery fully priced in after adjusting for market frictions*
5.0
US 10y real yield
US 10y TIPS liquidity premium
4.0
US 10y liquidity adjusted real yield
3.0
2.0
1.0
0.0
-1.0
-2.0
2005 2007 2009 2011 2013 2015 2017 2019 2021
Sources: Refinitiv, Euler Hermes, Allianz Research
In our view, markets now have limited -sensitive stocks or equity sectors have ment in 2020 and Q1 2021. As of today,
upside potential. Sovereign bond mar- moved sideways or fallen. Former mar- more than 60% of the SPAC mergers
kets in the US but also the Eurozone ket darlings such as Tesla or the Ark that have been announced since the
have rebuilt a cushion against uncer- Innovation ETF now trade close to ~35% start of the year are now trading below
tainty. Their risk component of nominal below the year high. the IPO price of their SPAC.
yields is large by historical standards.
The distribution of potential outcomes Other highly speculative plays, such as As for cryptocurrencies, in early Q1
is skewed to the downside, especially in cryptocurrencies, have also taken a hit. 2021 the aggregated market cap of
the US. We see only a 14% probability Note that the correlation between Te- cryptocurrencies skyrocketed above the
for the US 10y yield to finish the year sla and Bitcoin has recently increased USD2trn mark, only to lose more than
above 2%. The rise of the US curve also (Figure 9). In the wake of the reflation USD500bn in a matter of days. It must
impacted European yields and helped trade, the gold sector (gold itself and be conceded that cryptocurrencies are
the Bund 10y to catch up to fair value (- gold mines) is on track to deliver no strangers to such sharp movements
0.25%). Improving economic momen- double-digit returns in Q2 after posting but the natural question that arises is
tum and increasing tapering rumors negative returns in Q1. where did this money go? Although the
have also contributed. We think that a answer in this “new” investment is not
switch into positive territory could be All in all, it is past midnight for risky as- straightforward, it confirms the recent
possible (18% probability), but we sets! As we showed in our last quarterly market exuberance, overtrading and
would not consider it sustainable. publication, our Kindleberger market irrationality.
cycle clock4 keeps ticking and has now
On the one hand, monetary and finan- made it past midnight. The combina- Another clear red flag that combines
cial conditions will continue to be sup- tion of extreme valuations paired with overtrading with increased moral ha-
portive, especially for risky assets. On elevated levels of overtrading has led zard is the rapid increase in money ve-
the other hand, perceived inflation risk, to large but isolated market corrections locity within financial markets. This in-
a new global sharing of the value ad- and is increasing the current market crease is relevant as it shows that the
ded, regulation and new assertive in- fragility. Among several late market recent equity rally has partly occurred
dustrial policies create the potential for cycle indicators, the rapid market cor- thanks to the market’s unconditional
financial instability. Monetary aggre- rection of “new” overtraded assets, as is trust in central banks’ unconditional put
gates show strong fluctuations as the the case for SPACs (Special Purpose protection, which has, in turn, led to a
velocity of money (the flow of Acquisition Companies) and cryptocur- rapid increase in financial money ve-
“liquidity”) is far more unstable, es- rencies, have caught the eyes of many locity. This red flag is particularly impor-
pecially in financial markets, than its market participants. tant as it is not the quantity of money
quantity (the stock of “liquidity” gene- but its circulation that causes asset
rated by QE). Risky assets are thus not SPAC IPOs have come to a halt in Q2 prices to rise or fall and historical expe-
totally in a safe spot. 2021, leading the market to substan- rience shows us that central banks do
tially correct. This comes after a subs- not control the velocity of money, es-
Credit spreads have remained close to tantial acceleration in both volumes pecially in capital markets.
the year lows, but the most interest rate and prices of this “new” financial instru-
4
See our Q1 2021 global economic outlook Race to the post Covid-19 recovery: 7 obstacles to overcome.
1009 June 2021
Figure 10: Bitcoin correlations Figure 11: # of SPAC IPOs (live & in progress)
0.6 600
FB Tesla Apple Gold
0.4 500
Rest of the World - In Progress
400
0.2 Rest of the World - Live
US - In Progress
300
US - Live
0.0
200
-0.2
100
-0.4
2012 2013 2014 2015 2016 2017 2018 2019 2020 2021 0
2015 2016 2017 2018 2019 2020 2021
Sources: Refinitiv, Euler Hermes, Allianz Research. Correlations are computed Sources: Refinitiv, Euler Hermes, Allianz Research.
using a 6M rolling correlation on daily changes
Figure 12: Cryptocurrencies vs USD (100 = 31.12.2019) Figure 13: Capital markets transactions velocity
10 5 000
3500
Velocity of US M2 in US equity market (L.H.S)
Datastream US total market index (R.H.S)
3000
Financial velocity (Turnover by value/M2) at annual rate
Bitcoin
2500
Ethereum
2000 Ripple
1 500
1500
1000
500
0
12-18 06-19 12-19 06-20 12-20 06-21 0 50
1975 1980 1985 1990 1995 2000 2005 2010 2015 2020
Sources: Refinitiv, Euler Hermes, Allianz Research. Sources: Refinitiv, Euiler Hermes, Allianz Research.
Finally, another signal of the recent On the fundamentals side, there has cause of this, the current over-stretched
market frothiness and overtrading can been a clear global frontloading of earnings expectations leave little to no
be found in the increasing amount of “good” earnings surprises into 2021, to room for further upside potential as the
margin debt and deposits in US clea- the detriment of 2022 earnings expec- probability of experiencing at or below
ringhouses, triggered by the rapid in- tations. This pattern can be observed expectations earnings numbers far out-
crease in options trading volumes since across the globe and specifically in the paces that of experiencing upside ear-
March 2020. At this point, things start to Eurozone and Emerging Markets. Des- nings surprises. This leaves markets in a
take a systemic flavor and although we pite being a normal consequence of really fragile spot and at the mercy of
maintain that, at current levels, there is the strong Q1 earnings season, the changes in investor sentiment.
enough public and private liquidity in grand reopening may not grant
the market to absorb the increased enough positive earnings tailwinds to
trading volumes, it is an overtrading red warrant the extreme amount of frothi-
flag. ness and positive expectations. Be-
11Allianz Research
Figure 14: S&P 500 consensus EPS growth (in %)
40
2021
30
20 2022
2017
10
2023
2018
0
2015 2016
2019
-10
2020
-20
-30
2012 2013 2014 2015 2016 2017 2018 2019 2020 2021
Sources: IBES, Refinitiv, Euler Hermes, Allianz Research
But what does this all mean for risky bal equity markets to finish 2021 with Because of that, we believe investment
assets? Despite the mounting evidence upper single-digit returns but to con- grade credit will remain contained
of an upcoming market clean-up/ verge towards long-term average re- close to current levels until year-end
consolidation, we remain convinced turns (~5 to 7%) in 2022. In this context, while we expect some mild widening
that policymakers are fully aware of the we still expect the Eurozone and the UK within the high-yield space due to early
situation and would backstop any sign to outperform both US and EM equities. market consolidation. For 2022, we ex-
of a full-fledged market erosion. Due to pect credit spreads to structurally widen
that, we expect the unplugging of key Similarly, and on the back of lax poli- at a 20 to 30bps rate for investment
support measures to be contained and cies, credit spreads are set to range- grade and 50 to 70bps for high yield as
extremely gradual to allow for a mild trade for the remaining of the year companies reattach to fundamentals
but structural re-convergence to funda- while allowing for some initial market and markets start repricing fundamen-
mentals. In this regard, we expect glo- clean-up within the high yield space. tal credit risk.
Figure 15: S&P 500 decomposition (in %) Figure 16: US investment grade spread decomposition (in %)
200
30
150
20
100
10 50
0
0
-50
-10
-100
M2 Money Supply 10y inflation breakeven Consumer Confidence contribution
10y real yield USD NEER S&P500 volatility contribution
-20
Budget balance Estimate
-150 FED Balance Sheet Contribution
Budget Balance Contribution
IG spread y/y
-30 -200 Estimate y/y
2003 2006 2009 2012 2015 2018 2021
-250
2018 2019 2020 2021
Sources: Refinitiv, Euler Hermes, Allianz Research. Sources: Refinitiv, Euler Hermes, Allianz Research.
1209 June 2021
REGIONAL
OUTLOOKS
In the US, fiscal policy remains at the and monetary stimuli, but also from the 2022. Embodying a form of over-
forefront of economic policy initiatives success of the vaccination campaign heating, salaries will question the Fed’s
to restore growth and create jobs post (close to 65% of the adult population assumption that the current overshoot
Covid-19. The proposal for an infras- has been vaccinated, approaching the of inflation will be temporary. The on-
tructure package, initially estimated at 70% herd immunity threshold). The going acceleration of housing prices
USD2.3trn, has been revised on the latter has allowed for a swift reopening will also contribute to challenge this
downside to USD1.7trn by Democrats of the economy, boosting the effec- assumption as it announces an accele-
to give a chance for a bi-partisan tiveness of economic policy. ration of the shelter subcomponent of
agreement in the Congress by June the CPI index. Despite all of this, we
2021. Regarding the American Families We expect US GDP growth to reach expect US CPI to broadly normalize at
Plan, the White House has reiterated its +6.3% in 2021 and +4% in 2022 compa- 2.1% in 2022 compared with 2.5% on
intention to increase public spending red to the contraction of -3.5% in 2020. average in 2021 after the dilution of
for childcare, healthcare and education However, the window of opportunity to significant basis effects. This will give
by USD1.8trn by 2030. vote in new fiscal packages could be the Fed the opportunity to wait and see
rapidly closing as mid-term elections through H2 2021 before envisaging a
Between Q1 2020 and Q1 2021, the US are to be held in November 2022. On tapering. However, stronger growth
saw USD5trn of public spending. The the back of a stronger fiscal impulse and higher inflation compared with our
multiplier effect has been impressive as now penciled in our macroeconomic previous scenario could see a new
mirrored by a strong rebound of scenario, and as a result of stronger Operation Twist announced in H1 2022
growth, which was estimated at +6.4% growth, we expect the slack of the US in order to reduce the size of MBS pur-
q/q annualized in Q1 2021, coinciding job market (8 million jobs lost during chases and augment that of Treasuries
with a level of national production al- the crisis still need to be recovered) to in the USD120bn securities purchases
ready above the pre-crisis level. This rapidly decline and produce an accele- that the Fed operates on a monthly
impressive performance obviously re- ration of salaries, which should evolve basis. Any rate hike is still expected to
sulted from the strength of both fiscal close to +3.8% y/y at the horizon of take place in H2 2023 only.
Figure 17: US public debt (as % of GDP)
170%
160%
150%
140%
130%
120%
110%
100%
19 20 21 22 23 24 25 26 27 28 29 30
Sources: Refinitiv, Euler Hermes, Allianz Research.
13Allianz Research
In China, the overall solid recovery still domestic recovery fully broad-based, sures should ease going forward
needs to broaden, which means that the third layer that needs to recover is (producer inflation to peak in the co-
gradual policy normalization remains private consumption. Labor market ming months, while consumer core in-
the baseline scenario. We maintain our indicators are encouraging, with the flation is expected at 1.3% in 2021 vs.
GDP growth forecasts at +8.2% in 2021 unemployment rate at the lowest level 0.8% in 2020), giving more room for the
(after +2.3% in 2020) and +5.4% in 2022. since 2019, but household confidence is PBOC to use liquidity tools and macro-
The post-Covid-19 recovery of the do- not yet back to normal. In such a con- prudential regulation to tighten the
mestic economy can be broken down text, policy normalization carried out in overall monetary policy stance, while
into three layers. The first layer of public a gradual and flexible manner remains directing loans to areas most in need.
and policy-driven investment our baseline scenario. Authorities aim We expect the USDCNY rate at 6.3 at
(infrastructure and real estate) was to control structural vulnerabilities (eg. year-end. We estimate that fiscal sup-
behind the quick rebound in 2020. 2021 in the real estate and financial markets) port in 2021 (4.6% of GDP) will remain
is likely to be more focused on the se- without jeopardizing the economic re- generous but lower than in 2020 (7.1%).
cond layer of private business in- covery. Short-term pressures related to The year-to-date local government
vestment in the manufacturing sector. rising input prices not transmitting to special bond issuance has already
Our proprietary credit impulse index is output prices support our expectation dropped sharply (RMB230bn in April vs.
indeed a little more resilient for the pri- that the PBOC is likely to refrain from RMB1,150bn a year ago), in line with
vate sector than overall. To make the hiking policy rates this year. These pres- slowing infrastructure investment.
Figure 18: China fixed asset investment by sector, 2y CAGR (%)
20%
15% First layer of
recovery that drove Second layer
10% the quick rebound of recovery to
drive 2021
5%
0%
-5%
Infrastructure (value)
-10%
Housing starts (volume), HP-filtered
-15%
Manufacturing (value)
-20%
10-2019 04-2020 10-2020 04-2021
Sources: National Bureau of Statistics of China, Euler Hermes, Allianz Research
We expect Eurozone GDP to expand by and progress on the vaccination front demand will receive some tailwind from
+4.2% in both 2021 and 2022, with a (herd immunity should be within reach the EUR750bn EU Recovery Fund (GDP
return to pre-crisis levels in Q1 2022, by late summer across the EU) will see should be lifted by +1% in 2021 assu-
almost a full year after the US. Howe- Covid-19 restrictions eased swiftly (the ming no meaningful implementation
ver, some member states, including stringency index should drop back to delay) even though we expect it to be
Spain and Italy, will only reach this Q3 2020 lows in 2021). 20% smaller than advertised due to a
milestone at the turn of 2022/23. lower loan take-up. Meanwhile conti-
In Q2 2021, the Eurozone recovery will nuous strong export demand, driven by
The third wave of Covid-19 infections be kicked off with GDP growing close to the ongoing Chinese recovery and su-
postponed the Eurozone’s economic +2% q/q, thanks to strong base effects percharged, stimulus-induced US GDP
resurrection in Q1 2021. However, we in those sectors that have been stuck in growth, will continue to boost GDP
see the economic stars aligning to set economic hibernation. Reduced econo- growth in the coming quarters as the
the stage for an unprecedented econo- mic uncertainty will in turn set the stage global recovery momentum becomes
mic rebound over the rest of 2021. We for a consumption-led catch-up growth more synchronized, even though indus-
expect the Eurozone to record some of spurt in the second half of the year tries will face lingering bottlenecks for
the strongest quarterly expansion rates (with excess savings to the tune of 1.5% the remainder of 2021 in the form of
on record (second only to Q3 2020). of GDP turbocharging the recovery). longer delivery times and component
Abruptly receding new Covid-19 cases Last but not least, Eurozone domestic shortages.
1409 June 2021
At the same time, policymakers will France (Spring 2022). Flagship fiscal whereas the ECB will continue to en-
continue to do “whatever it takes” to measures, including furlough schemes sure favorable financing conditions
safeguard the recovery and shore up (which will see the unemployment rate during the early phase of the recovery,
public support ahead of key elections in peak below 9%) and public guarantees, even as Eurozone inflation is likely to
Germany (September 2021) and will be extended until at least fall 2021, overshoot at 2.5% y/y in H2 2021.
Figure 19: Employment in millions, Eurozone vs US
165 EZ Employment
160 EZ long-term trend (1995-2019)
US employment
155 US long-term trend (1995-2019)
150
145
140
135
130
125
Q1 1995Q1 1998Q1 2001Q1 2004Q1 2007Q1 2010Q1 2013Q1 2016Q1 2019
Sources: Refinitiv, Euler Hermes, Allianz Research
In Germany, after a rather disappoin- months, including accommodation and that curbed the impact of the crisis on
ting start to 2021, the economic pros- food services. The imbalance between incomes. With the grand reopening, we
pects are now very promising. In view rapidly rising labor demand and im- expect the pent-up demand to boost
of the recent decline in new infections paired supply – Covid-19 has weighed GDP growth by around +2pp in 2021. In
and good progress on the vaccination on immigration and vocational training May, business confidence soared to a
front, the service sector is likely to have programs and, in view of poor pros- three-year high (above its historical
already started to catch up in May, ac- pects in some sectors, led to a reorien- average), while retail and services sec-
companied by the first easing of restric- tation of workers to sectors with brigh- tors have registered strong confidence
tions. In the coming months, one posi- ter prospects - can be reduced by trai- gains. This rebound in confidence in the
tive economic record after the next can ning offensives and at least temporarily services sector, unprecedented in histo-
be expected in contrast to last year's higher wages. Given the notable re- ry, finally gives us a glimpse of the end
plunge into the abyss. We expect an bound momentum, the German labor of the multi-speed recovery between
unprecedented consumption rebound market should also embark on a firm sectors. The presidential election will
(+3% in Q2/Q3), fueled by pent-up de- recovery trend. By the end of 2021, al- take place in less than a year, though
mand in a context of sharply declining most one in two people who lost their only a few candidates, including Ma-
economic uncertainty. Meanwhile, the jobs in the wake of the Covid-19 crisis rine Le Pen, have officially announced
ongoing industrial upswing – despite should find new employment. The that they will run. President Macron has
lingering rebound bottlenecks in the unemployment rate will, however, re- unofficially started his re-election cam-
form of component shortages that main elevated at 5.8% in 2021 after 6% paign on the back of easing sanitary
should hold back production momen- in 2020. restrictions. In addition to security and
tum – should fuel a capex boom. Ove- immigration, we expect the following
rall, GDP growth should come in at In France, the domestic economy will economic issues to shape campaigns:
+3.4% in 2021 and +3.8% in 2022. As a be the major driver of the post Covid- (i) boosting industrial competitiveness
result, the German economy will return 19 recovery. With the accelerating and export performance via production
to pre-crisis GDP levels already by late pace of vaccination and the progres- tax cuts and other economic incentives,
2021. However, one should be prepa- sive re-opening of all sectors, we main- (ii) achieving a green transition and
red for some economic restart difficul- tain our growth forecast at +5.4% in implementing socially acceptable envi-
ties. The abrupt reopening of the 2021 and +3.6% in 2022. French house- ronmental policies, (iii) how to support
economy is likely to lead to acute labor holds’ excess savings reached over the incomes of those in precarious con-
shortages, especially in sectors that EUR140bn in the first quarter of 2021, ditions and (iv) pension and social secu-
have been stuck in hibernation for thanks to supportive state measures rity reforms.
15Allianz Research
Figure 20: Catch-up consumption in 2021, % of GDP
3.5
3.0
2.5
2.0
1.5
1.0
0.5
0.0
Denmark
Belgium
France
Austria
Norway
Portugal
US
UK
Spain
Italy
Netherlands
Germany
Poland
Sweden
Czechia
Eurozone
Sources: Eurostat, Euler Hermes, Allianz Research
Italy is targeting the biggest fiscal sti- (focused on working capital and debt 5.8% of GDP in 2022 in addition to dis-
mulus among Eurozone peers in 2021- restructuring) towards new investment. bursements of the NGEU (around 1.2%
22. Prime Minister Draghi’s “calculated We expect real GDP to grow by +4.4% of GDP in 2022). The flipside is the pu-
risk” of accelerating the reopening at in 2021 and +4.6% in 2022. blic debt level rising to 159% of GDP,
an early stage of the vaccination cam- and likely to remain above 140% for the
paign seems to be paying off so far as The strong fiscal stimulus remains the next 15 years. But this need not be a
infection numbers continue to decline. underlying force of the recovery. Italy problem if the national recovery plan
Moreover, the summer seems to be has played the fiscal card more than (EUR248bn, of which EUR192bn by
saved for the tourism sector (13% of other Eurozone countries, with the go- NGEU) succeeds in increasing potential
GDP). Consumption will rebound as the vernment so far mobilizing EUR170bn growth (target of 0.4% to 0.6% p.a.)
economy reopens. The recent strength (10% of GDP). This year alone, the defi- while financing costs remain low.
of investment could be a signal of bor- cit has been revised twice from -7.5% to
rowing switching from crisis mode -11.8% of GDP. It is still expected at -
Figure 21: Italy’s fiscal spending plans
20
18
16
14
12
10
8
6
4
2
0
Germany France Italy Spain
Domestic recovery support (2021-23)
EU loans (2021-23)
EU grants (2021-23)
National discretionary emergency support (2020-21)*
Sources: PNRR, EU Comission, Euler Hermes, Allianz Research
1609 June 2021
Figure 22: Italy’s potential GDP growth
110
108
106
104
102
100
98
96
94
92
2000 2005 2010 2015 2020 2025 2030
real GDP Potential GDP
Sources: : PNRR, Euler Hermes, Allianz Research
In Spain, mobility has improved over allocation constraints, while Spain has Plan could boost productivity and inno-
the first half of the year and will conti- already requested EUR69.5bn in grants vation to bridge the productivity and
nue to boost growth in the short-term. from the Resilience and Recovery growth gap between Spain and the EU-
The grand reopening and relaxation of Funds (RRF) but will not be able to sup- 8. In addition, we see the unemploy-
restrictions in Europe will prove to be port companies with them. The percen- ment rate remaining high in 2021
good news for the service-heavy econo- tage of companies subjected to great (15.9%) as emergency pandemic mea-
my. GDP growth in the first quarter pro- financial pressure has increased very sures are phased out, and starting to
ved more resilient than expected (-0.5% significantly (27pp) between 2019 and improve in 2022, with an average of
q/q) and with the return to normalcy we 2020 to 40%. Having more flexibility on 14.8%. We do not expect economic acti-
expect GDP to grow by +5.1% in 2021 spending would boost vulnerable com- vity to return to pre-pandemic levels in
and +5.3% in 2022, helped by the tou- panies so being able to negotiate the the next two years as political risks and
rism sector. In addition, upside risks use of the RRF would be monumental stimulus implementation hurdles could
come from the fiscal stimulus planned for Spanish companies that are strug- delay the recovery.
within the 2021 budget. This latter has gling financially. In the past, there have
already allocated EUR26bn of the been institutional hurdles to implemen-
NGEU grants. The NGEU funds have ting public spending. The Spain 2050
Figure 23: Public sector efficiency by country vs expenditure executed in
2014-20
0.8
Expenditure executed in 2014-2020 relative to
Netherlands
the European structure funds assigned
0.7
0.6 France
0.5 Portugal
0.4 Italy
Spain
0.3
0.0 0.5 1.0 1.5 2.0
Public sector efficiency indicator
Sources: : IMF Fiscal Monitor, Euler Hermes, Allianz Research
17Allianz Research
In the UK, the grand reopening will al- Credit conditions during the recovery In the medium-run, Brexit will continue
low pent-up demand equivalent to at phase may be tighter and excessive to have a negative impact on trade
least 3% of GDP to materialize in 2021 levels of corporate debt could limit flows with the EU. In Q1 2021, the im-
and push GDP up by +6%, one of the companies’ ability to borrow once state pact on imports from the EU fell by
highest European growth rates. The -support schemes are phased out. more than -20% against monthly flows
rapid pace of vaccination allowed the in 2019 while imports from outside the
economy to reopen, with mobility data Bottlenecks to the recovery are more EU remained in positive territory despite
improving and economic data strongly and more visible and probably exacer- the increased supply-chain disruption.
recovering since April, notably within bated by Brexit, particularly in the form Hence, the increase in import prices
the sectors that faced heavy restrictions of labor shortages in transport, cons- from the EU of about +5% due to non-
during lockdowns. We expect compa- truction and sectors such as tourism tariff barriers after Brexit is not so far
nies to invest actively in 2021 (+11.8% and catering and hospitality. Hence, from the tariff barriers for imports from
followed by +8.9%), supported by ex- pressures on wages are rising and we China, i.e. 6.5% excluding exchange
cess cash (GBP122bn or more than 5% expect overall growth to accelerate up rate effects. The question of the trade
of GDP). The hyper-amortization to +2.9% on average in 2022. In 2022, rotation remains high if trade hurdles
scheme until end-2023 should support we expect GDP growth to slow down to are not resolved, notably when the UK
business investment and sectors such as +4.9% as fiscal assistance mechanisms will also implement border controls on
manufacturing, transportation, food will fully end and the UK will be one of imports from the EU from October on-
and accommodation stand among the first countries to start fiscal and mo- wards. In addition, the end of the transi-
those most willing to use the tax break netary consolidation: in total, GBP30bn tion period for EU derivative products
in view of their higher share of total (1.3% of GDP) through a rise in personal clearance in the UK in mid-2022 could
assets accounted for by the plants and income tax in 2022, followed by the rise bring more downside risks to the sector,
vehicles to which the scheme applies. In in corporate tax to 23% in 2023. The given the tough negotiations on
the short run, a demand catch-up and Bank of England is also expected to "equivalence".
the reduction in spare capacities will raise the key interest rate as soon as
drive a business investment recovery. September 2022 (+15bp), embarking
However, it could take up to four years on an early, but timid monetary norma-
to return to long-term growth trends5 : lization cycle.
Figure 24: Planned end-dates for state support in the UK
Sources: UK government, Euler Hermes, Allianz Research
5
See our recent report Investment is back: harder, better, faster, stronger?
1809 June 2021
Bidirectional pressures on central from Covid-19 require a specific type of India, other countries previously cha-
banks in Emerging Markets. The first policy support, while fighting inflation racterized by low levels of contagion
quarter of 2021 saw the reemergence needs a different one. The events are now experiencing outbreaks and
of the concept of a Taper Tantrum6. As around the Turkish central bank or the new lockdown measures.
inflation figures are released, the political instability wave in Latin Ameri-
prophecies are coming closer to fulfill- ca are some examples. Taking the above-mentioned factors
ment. Central banks either have under- into account, the following months
taken rate hikes or are planning to (or These pressures have affected the could unveil Eastern EU countries as
even both). In some countries, market sovereign debt markets (Figure 26), some of the top performers of the
expectations exceed central bank tar- particularly in some of the TUCKANS7, grand reopening. For sovereign bonds,
gets for 2021. Furthermore, they also but also in Latin America as a region some of these countries may look like
exceed the long-term inflation expecta- and in Russia. an investment opportunity, with still
tions from our models. decent coupons, a relatively more opti-
Up until now and with exceptions, Asia mistic perspective than their other EM
The situation puts policymakers in a appears to be the region less influen- counterparts and bond prices not as
difficult tessitura: the idiosyncratic struc- ced by this hazard. However, the sani- crowded as in Asia.
tural problems and the severe damage tary situation may modify this: Besides
Figure 25: Proxy to EM breakeven inflation estimations. Figure 26: Largest increases (decreases) in LC Sovereign bonds yields.
Year to date.
Nigeria
Turkey (5Y)
Turkey
Colombia
South Africa (10Y) Brazil
Russia
Mexico
Brazil (10Y) Chile
Peru
Current B/Even 10Y 1Y
Philippines
Mexico (10Y) LT estimation
Hungary
+/-1 std. dev.
…
CB Target
Chile (10Y) India
Morocco
0% 3% 6% 9% 12% 15% 18% China
Croatia
-200 0 200 400 600 800
Sources: Refinitiv, BofA, Euler Hermes, Allianz Research; Inflation Target for Sources: Refinitiv, BofA, Euler Hermes, Allianz Research. When the 10Y or 1Y
the Central Bank of Turkey has been revised to 12.2% to adjust to reality, the are not references, the nearest maturity is taken into account.
aim is conversion to 5% in 2023.
6
See our recent report Taper Tantrum in 2021-22: Beware of the TUCKANS
7
Acronym used to designate the group made by Turkey, Ukraine, Chile, Kenya, Argentina, Nigeria and South Africa. Some of these countries, especially Argentina and Ukraine, do not
appear in Figure 24 as the point on 31.12.2020 was already high.
19You can also read