Gas Statement of Opportunities - For eastern and south-eastern Australia March 2021 - Australian Energy Market Operator
←
→
Page content transcription
If your browser does not render page correctly, please read the page content below
Gas
Statement of
Opportunities

March 2021

For eastern and south-eastern Australia

Important notice

PURPOSE
The purpose of this publication is to provide information to assist registered participants and other persons in
making informed decisions about investment in pipeline capacity and other aspects of the natural gas
industry. AEMO publishes this Gas Statement of Opportunities in accordance with section 91DA of the
National Gas Law and Part 15D of the National Gas Rules. This publication is generally based on information
available to AEMO as at 31 December 2020, unless otherwise indicated.

DISCLAIMER
AEMO has made reasonable efforts to ensure the quality of the information in this publication but cannot
guarantee that information, forecasts and assumptions are accurate, complete or appropriate for your
circumstances. This publication does not include all of the information that an investor, participant or
potential participant might require, and does not amount to a recommendation of any investment. Anyone
proposing to use the information in this publication (which includes information and forecasts from third
parties) should independently verify its accuracy, completeness and suitability for purpose, and obtain
independent and specific advice from appropriate experts.
Accordingly, to the maximum extent permitted by law, AEMO and its officers, employees and consultants
involved in the preparation of this document:
• make no representation or warranty, express or implied, as to the currency, accuracy, reliability or
  completeness of the information in this document; and
• are not liable (whether by reason of negligence or otherwise) for any statements, opinions, information or
  any other matters contained in or derived from this publication, or any omissions from it, or in respect of a
  person’s use of the information in this publication.

ACKNOWLEDGEMENT
AEMO acknowledges the support, co-operation and contribution of participants and project proponents in
providing data and information used in this publication.

COPYRIGHT
©2021 Australian Energy Market Operator Ltd. The material in this publication may be used in accordance
with the copyright permissions on AEMO’s website.

VERSION CONTROL

Version        Release date             Changes

1              29 March 2021            Initial release
Executive summary

In the 2021 Gas Statement of Opportunities (GSOO), AEMO forecasts demand, and uses information from gas
producers about reserves and forecast production, to project the supply-demand balance and potential gaps
under a range of plausible scenarios for eastern and south-eastern Australian gas systems to 2040. AEMO’s
2021 Victorian Gas Planning Report (VGPR)1, which complements this GSOO, provides a focused assessment
of the supply-demand balance to 2025 in Victoria’s Declared Transmission System (DTS).
This GSOO distinguishes between geographical regions in the north and south of eastern Australia. Northern
regions generally refers to developments, consumers, and existing facilities in Queensland and those
Northern Territory assets with access to the Northern Gas Pipeline (NGP). Southern regions generally refers
to developments, consumers, and existing facilities in South Australia (including the Queensland component
of the Cooper–Eromanga basin), New South Wales, the Australian Capital Territory, Victoria, and Tasmania.

     This GSOO forecasts an improved gas supply outlook compared to last year, largely due to
     Australian Industrial Energy’s (AIE’s) commitment to the Port Kembla Gas Terminal (PKGT) in New
     South Wales. This is Australia’s first liquified natural gas (LNG) import terminal, and is estimated to
     inject up to 500 terajoules (TJ) per day into the domestic market.
     • There is now projected to be sufficient supply to address the near-term shortfall forecasts of
       recent GSOOs (deferring shortfall forecasts to at least 2026), provided the first gas from PKGT is
       delivered ahead of winter 2023 and other committed field developments and pipeline expansions
       proceed as planned.
     • If PKGT project commissioning is delayed, southern supply scarcity risks have emerged for
       winter 2023 under certain conditions such as extreme 1-in-20 maximum winter daily demand in
       Victoria, coincident peaks across southern regions, events in the National Electricity Market (NEM) that
       increase demand for gas-powered generation of electricity (GPG), or gas production outages.
     • These southern supply scarcity risks appear one year earlier than projected last year, due to more
       rapid decline in producers’ forecasts of maximum daily production from legacy southern fields
       in Longford, Victoria. The last major southern gas field offering flexible supply is expected to be
       depleted ahead of winter 2023, reducing gas system resilience.
     • Most projects classified as anticipated in last year’s GSOO are now committed, but this GSOO reports
       fewer new anticipated projects, with limited exploration investment incentivised in the past year,
       even in northern regions.
     • Development of all remaining anticipated projects on schedule, including Golden Beach and new
       fields in the Gippsland Basin Joint Venture (GBJV), would build resilience to unexpected events.
       This would help manage operational risks associated with unplanned outages, or project delays in
       either the gas or electricity system, and defer projected gas supply gaps until the end of this decade.
     • Additional demand management initiatives or proposed pipeline expansion could further assist
       in mitigating supply scarcity risks associated with any potential PKGT commissioning schedule
       slippage, or LNG cargo delays.

1
    At https://www.aemo.com.au/energy-systems/gas/gas-forecasting-and-planning/victorian-gas-planning-report.

© AEMO 2021 | Gas Statement of Opportunities                                                                      3
This GSOO also highlights that the gas sector in eastern and south-eastern Australia is on the cusp of
transformation, with changes in consumption patterns forecast and alternate supply sources being
actively developed. It reports on current and projected trends and their implications for system
resilience, investment, and the role of gas in the future energy system.
The key transforming trends observed and projected in the gas sector are:
• Industrial demand for natural gas is not forecast to grow in the next 20 years, and could
potentially reduce significantly as industrial users in the gas sector start to decarbonise. With an
increase in variable renewable energy (VRE), GPG demand may become more ‘peaky’.
- Surveyed industrial users indicated their demand is unlikely to increase, even if prices fall. Their
current view remains that gas price reductions alone would not drive significant increases in their
consumption, but would reduce the risk of industrial closures. The potential impact of sustained
lower prices on new manufacturing demand was not modelled.
– By 2040, in a future world where economic production of hydrogen is strong, gas consumption for
direct use could decline by as much as 20% (based on scenario assumptions), with an even faster
decline then projected to 2050.
– Gas is expected to continue to play a critical role in the electricity sector particular during periods
of low VRE generation or prolonged coal-fired generation outages. While the volume of gas
consumed for generating electricity is forecast to decline in all scenarios, the value of that
generation is expected to increase in line with the growth of VRE and the retirement of coal
generation. Over time, daily GPG demand is projected to switch to peaking in winter instead of
summer.
• There are numerous initiatives underway at both federal and state government level that could
change the gas landscape and impact the outlook described here, including the Australian
Government’s gas fired recovery plan2.
• The introduction of PKGT and other LNG import terminal proposals currently being progressed
have potential to permanently change domestic gas market dynamics .
Further investments to address forecast supply gaps should be cognisant of the sector
transformation underway and be adaptable to manage future changes in gas consumption
patterns. Prudent options could include investments that can:
• Flexibly match supply with seasonal demand and deliver variable annual supply efficiently.
• Manage peak demand needs, potentially through electrification, fuel switching, and energy efficiency.
The National Gas Infrastructure Plan (NGIP) being developed by the federal Department of Industry,
Science, Energy and Resources (DISER) is considering a number of pathways to unlock gas supply and
improve efficiency in the east coast gas market, taking these considerations into account.
Legacy supply flexibility to meet winter demand is deteriorating, but investment is occurring
Over the last year, the market has committed to developing almost all previously anticipated projects. As a
result, annual production in southern regions is still in decline, but forecasts of existing and committed annual
production over the next five years have generally increased compared with the 2020 GSOO forecast. Much
of this increase in annual production is from fields in Moomba (South Australia) and Port Campbell (Victoria).
Without further expansion, constraints on existing pipeline infrastructure, in particular the Moomba–Sydney
Pipeline (MSP) and Victoria’s South West Pipeline (SWP), may limit the delivery of gas from these southern
producers to southern customers during peak demand periods.
2
See https://consult.industry.gov.au/energy/gas-fired-recovery-plan/.
© AEMO 2021 | Gas Statement of Opportunities 4Maximum daily production in southern regions is falling significantly faster than annual production,
particularly in Longford (Victoria), where major legacy flexible supply fields are now expected to be depleted
by winter 2023 – one year earlier than forecast in the 2020 GSOO. In 2023, maximum daily capacity from
existing, committed, and anticipated southern fields is almost 20% lower than the producers’ forecasts in the
2020 GSOO; it is 25% lower if focusing only on Victorian producers3.
Unless new southern production is developed, Victoria will therefore need to rely more on supply from
outside the state to cover its winter demands for heating in future. While most previously anticipated
developments are now committed, new anticipated developments are becoming more limited. In southern
regions, anticipated projects may provide between 20 petajoules (PJ) and 40 PJ additional supply each year
across the project lifetimes. These include Golden Beach and new fields in the Gippsland Basin Joint Venture
(GBJV), all in Victoria. Encouragingly, Beach Energy has also recently reported more commercial quantities of
gas from the Enterprise gas field4 in Victoria’s Otway Basin than previously expected, but this project is not
yet committed.
More generally, lower gas prices have contributed to a challenging investment environment for new
production5. This impact is most evident across the coal seam gas (CSG) fields in Queensland, with producers
now projecting a slower development schedule for anticipated projects.
System resilience is rapidly reducing, and supply risks are projected if investment is delayed
The timely commissioning of committed developments, including the PKGT, is critically important given the
forecast reduction in maximum daily capacity from southern fields. If delivered to schedule, domestic supply
shortfalls during winter peak demand periods are not forecast until at least 2026. If these committed projects
are not delivered to schedule, greater reliance would be placed on storages, and gas shortfalls of up to 100 TJ
per day may eventuate in winter 2023 under extreme conditions.
Figure 1 shows the encroaching tightness forecast in southern supply-demand balance at times of extreme
1-in-20 daily demands6, along with the impact the PKGT is projected to have from winter 2023. The pipeline
capacity in the figure represents the contribution from northern production, up to the limit of the South West
Queensland Pipeline (SWQP). The constrained storage capacity represents southern storage’s potential
contributions up to the existing limit of the connecting pipelines 7. Import of LNG cargoes for peak seasonal
supply is assumed to be limited by the capacity of the PKGT (approximately 500 TJ per day) and the pipelines.
The PKGT is complemented by compression on the Eastern Gas Pipeline (EGP) to enable bi-directional supply
between New South Wales and Victoria (200 TJ per day south is committed), improving the security of supply
to both states.
The strong seasonality of southern daily demand is clearly evident in Figure 1, with residential and commercial
heating applications in winter driving peak day demand.
Demand above the red dashed line ‘Production and pipeline capacity’ needs to be met either by storage or
PKGT, or both. Without further pipeline expansion, constraints on the SWP may restrict Victoria’s access to
supply from Iona Underground Storage (UGS), which has traditionally provided additional supply deliverability
during peak periods, unplanned trips, and outages of other equipment. Greater reliance will instead need to
be placed on import of LNG cargoes from PKGT to cover extreme winter peaks. This may present operational
challenges in the event of LNG cargoes to the new terminal being unavailable.
3
Victorian production forecasts are available in detail in the 2021 VGPR.
4
A production plan for this gas field is not yet available to AE MO and has therefore not been included in this analysis. This announcement is not expected to
materially change the supply adequacy assessment unless pipeline constraints on SWP are also addressed.
5
See https://www.afr.com/companies/energy/origin-slashes-qld-drilling-as-soft-gas-market-bites-20201030-p569zh. Gas producers were surveyed before
the rapid rise in Asian LNG markets, which may or may not result in increased anticipated supply in future years.
6
Maximum daily demand is forecast with a probability of exceedance (POE), meaning the likelihood the forecast will be met or exceeded. A 1-in-20 forecast
is expected to be exceeded, on average, only once in 20 years, while a 1-in-2 forecast is expected, on average, to be exceeded every second year.
7
Dandenong (Victoria) and Newcastle (New South Wales) LNG storages are assumed to be fully maximised, Victoria’s Iona Underground Storage (UGS) is
limited to the sum of filling the remaining capacity on the SWP, meeting the peak day demand at Port Campbell and meeting any unmet demand in
Adelaide on the specific peak day.
© AEMO 2021 | Gas Statement of Opportunities 5Development of anticipated projects such as Golden Beach, demand management initiatives, greater focus
on energy efficiency and fuel-switching, or expansion of pipelines could all help mitigate supply scarcity risks
under these extreme conditions in winter 2023.
Figure 1 Actual daily southern gas demand since January 2019, and forecast to 2025, showing seasonality,
peakiness, southern production, and total system capacity available to meet southern demand
using existing and committed projects (TJ)
3,000
2,000
TJ
1,000
0
1/01/2019 1/01/2020 1/01/2021 1/01/2022 1/01/2023 1/01/2024 1/01/2025
Actual southern demand Forecast southern demand
Max. southern production Production and pipeline capacity
Production, pipeline and constrained storage Production, pipeline, constrained storage and PKGT
Source: Gas Bulletin Board (GBB) and AEMO forecasts of 1-in-20 southern demand.
Over time, as maximum daily production continues to decline, the value of flexible seasonal “shaped” gas
supplies is expected to increase to help cover monthly winter demand, not just extreme peaks. Provided all
committed and anticipated projects are developed, there is projected to be sufficient supply to cover both
extreme peak demand conditions and seasonal demand requirements until at least 2029, as shown in
Figure 2. PKGT is forecast to provide the seasonal supply flexibility that is otherwise being eroded as legacy
southern fields deplete.
Figure 2 Projected eastern and south-eastern Australia gas production (including export LNG), Central
scenario, existing, committed, and anticipated developments, 2021-40 (PJ)
2,000
1,500
PJ
1,000
500
0
2022
2039
2021
2023
2024
2025
2026
2027
2028
2029
2030
2031
2032
2033
2034
2035
2036
2037
2038
2040
Developed Committed Anticipated LNG imports Forecast demand
© AEMO 2021 | Gas Statement of Opportunities 6By the end of this decade, depth of storage and PKGT’s annual limits on permitted water discharge
(approximately 130 PJ) start constraining supply, resulting in forecast gas supply gaps of up to 30 PJ. Without
additional supply from projects currently uncertain, or fuel substitution to soften gas consumption, these
supply gaps are projected to continue increasing from 2030 onwards.
A resilient gas sector for the future
The scale and nature of transformation of Australia’s gas sector is highly uncertain. Electrification,
fuel-switching to hydrogen or biofuels, and the Australian Government’s vision for gas-fired recovery for
Australia’s economy could all influence future development needs and opportunities in the gas sector, not to
mention the changes which may occur due to the stronger linkage of Australia’s domestic gas supply to
international markets via an LNG import terminal.
To understand risk and support longer-term planning across a range of plausible futures, AEMO uses
different scenarios and sensitivities in the GSOO analysis. For the 2021 GSOO, modelling was conducted
based on four futures for gas in eastern and south-eastern Australia:
• Central scenario – uses AEMO’s best (central) view of future uncertainties.
• Slow Change scenario – explores reduced gas demand due to slowing economic activity and higher
gas prices.
• Hydrogen scenario – included in this GSOO for the first time, explores potential gas infrastructure impacts
of the development of electrolyser-produced hydrogen under stronger economic conditions, which could
provide a potential substitute for gas use in certain applications. The nature of these impacts would
depend on the timing, scale, and location of hydrogen facilities, which are highly uncertain. If electrolysers
are connected to the NEM, the growth in electricity demand would be significant. AEMO will explore the
implications of hydrogen further in the next Integrated System Plan (ISP) and Electricity Statement of
Opportunities (ESOO) for the NEM.
• Low Gas Price sensitivity – explores potential impacts of lower gas prices on consumption by residential,
commercial, and large industrial consumers, and GPG.
AEMO also modelled sensitivities to test the impact of event- or weather-driven variations in GPG demand.
While gas consumption is forecast to remain relatively flat in AEMO’s Central scenario (depicted in the supply
adequacy assessment in Figure 2), the 2021 GSOO scenario analysis reveals that uncertainties affecting
consumption in the longer term are asymmetrical, with gas consumption decline more likely than
consumption growth:
• Consumers continue to invest in measures to increase energy efficiency, including switching away from
gas consumption. Since the 2020 GSOO, the Victorian Government has announced additional energy
efficiency measures8 that are expected to have a further moderating effect on Victorian industrial and
residential/commercial gas consumption.
• Hydrogen production and blending within distribution networks may present a strong offset for gas
production needs. Industrial processes that currently use gas may be candidates for conversion to
hydrogen fuels. This could lead to greater reduction in annual gas consumption than maximum daily
demand, resulting in a more ‘peaky’ gas demand profile9 and greater value placed on flexible supplies.
The scale of the impact on domestic gas consumption is highly uncertain while the hydrogen industry is
establishing. AEMO will explore the impact on electricity consumption in the 2021 ESOO and 2022 ISP.
• Growth in residential and commercial gas consumption from new connections is forecast to be mostly
offset by increases in energy efficiency in the next five years, but will continue to drive some increase in
maximum daily demand in the longer term.
8
Victorian Energy Upgrades, updated 24 December 2020, at https://www.energy.vic.gov.au/energy-efficiency/victorian-energy-upgrades.
9
Although both consumption and peak demand will be lower than in the Central scenario.
© AEMO 2021 | Gas Statement of Opportunities 7• Industrial consumers remain sensitive to energy costs, and closure of industrial facilities remains an
ever-present risk if energy costs are high. Manufacturing expansion continues to be driven by sectors that
consume relatively lower gas than historical industrial users. Based on user surveys, significant investments
in new large industrial processes (and consequent growth in demand) are considered unlikely at this time.
Lower gas prices alone are not expected to drive significant increases in consumption, but would reduce
the risk of industrial closures. The Australian Government’s gas-fired recovery plan may stimulate growth
in gas consumption, but it is assumed that this would be supported by actions in the plan to unlock supply
as needed10 and would therefore be unlikely to increase the risk of supply scarcity.
• Annual demand for gas from GPG is likely to materially reduce as more VRE connects and operates in the
NEM11. In 2020, the GPG gas demand of 127 PJ12 was approximately 23% lower than in 2019 and the lowest
GPG consumption in over a decade. While some of this GPG reduction may be attributed to COVID-19,
the main contributors appear to be mild weather, increased distributed photovoltaics (PV), and growth in
VRE. The electricity transmission network is also assumed to expand consistent with the 2020 ISP optimal
development path, further reducing expected future GPG volumes. However, GPG retains a critical role in
meeting demand during high temperatures in summer or low VRE periods in winter, so peak GPG demand
is projected to remain relatively constant over the next decade. Over time, as more energy storage is
developed and coal-fired generators retire, daily GPG demand is forecast to switch from summer to winter
peaking, further exaggerating existing seasonal variations in daily gas demand.
• Higher GPG demand is frequently event-driven, and AEMO forecasts continued volatility in GPG demand,
with large variances driven by the NEM’s operation of coal, hydro, and renewable energy generators.
Delays or deferral in developing new generation and transmission capacity, or earlier than expected
closure of coal-fired generation may temporarily increase annual GPG consumption.
The GSOO projects a wide variety of potential consumption forecast outcomes over the 20-year horizon
across different plausible scenarios and sensitivities that drive different supply adequacy outlooks and
investment needs. Figure 3 shows the range of consumption forecasts in this 2021 GSOO, and compares
Central and Slow Change scenario projections to equivalent forecasts in the 2020 GSOO.
10
The Gas Fired Recovery Plan was still open for consultation at the time this GSOO was published, and the proposed measures have therefore n ot been
included in this assessment. A GSOO update will be prepared if the final measures determined following consultation lead t o a materially different
supply-demand outlook.
11
The 2021 GSOO analysis commenced prior to the announcement of the New South Wales Transformation Roadmap, so does not include the 12 gigawatts
(GW) of VRE targeted to commence construction in New South Wale s by 2030. This would further reduce GPG demand, unless coal-fired generation
exited early in response.
12
This excludes the generator at Yarwun, which is captured as industrial consumption.
© AEMO 2021 | Gas Statement of Opportunities 8Figure 3 Domestic gas consumption actual and forecast, 2014-40, excluding LNG, all scenarios, compared
to 2020 GSOO scenarios (PJ)
700
Annual consumption excl. UAFG (PJ)
600
500
400
300
200
100
0
2025
2020
2021
2022
2023
2024
2026
2027
2028
2029
2030
2031
2032
2033
2034
2035
2036
2037
2038
2039
2014
2015
2016
2017
2018
2019
2040
Actual 2021 GSOO Central 2021 GSOO Hydrogen
2021 GSOO Low Gas Price 2021 GSOO Slow Change 2020 GSOO Central
2020 GSOO Slow Change
Future gas infrastructure investments should be planned so they are robust to a range of possible futures,
including futures with lower demand for gas in the long term, and/or more peaky demand profiles.
As demonstrated in this 2021 GSOO:
• Additional peak management solutions, pipeline expansions or anticipated field development ahead of
winter 2023 would help minimise risk of unplanned disruption in southern regions under certain
conditions in the event PKGT’s construction or commissioning schedule is delayed.
• In the following years, while consumption may decline under some scenarios, peak and seasonal demands
are forecast to continue to grow with growing customer connections, and GPG may amplify seasonal
consumption patterns with shifts from summer to winter peaking. This uncertainty increases the value of
flexible supply and infrastructure options to meet projected seasonal supply gaps.
To this end, the preparation of the NGIP is timely and critically important to increase the resilience of the
eastern and south-eastern gas systems to both near-term supply scarcity risks and longer-term sectoral
transformation uncertainties.
© AEMO 2021 | Gas Statement of Opportunities 9Contents
Executive summary 3
1. Introduction 14
1.1 A changing market 14
1.2 Scenarios and sensitivities 15
1.3 Improvements for the 2021 GSOO 18
1.4 Supplementary information 18
2. Gas consumption and demand forecasts 20
2.1 Total eastern and south-eastern gas consumption forecasts 21
2.2 Consumption forecasts by sector 27
2.3 Maximum daily gas demand forecasts 33
3. Gas supply and infrastructure 40
3.1 Reserves, resources, and production facilities 41
3.2 Midstream gas infrastructure 45
4. Gas supply adequacy 53
4.1 Supply adequacy in the Central scenario 54
4.2 Annual gas adequacy in other scenarios 58
5. Adding resilience to the eastern and south-eastern gas markets 60
A1. Hydrogen assumptions 65
A1.1 Building the assumption-based forecasts 66
A2. Forecast accuracy 68
Measures and abbreviations 79
Glossary 81
Tables
Table 1 Scenario drivers of most relevance to the gas market 15
Table 2 Other relevant reference materials 18
Table 3 Total 1-in-2 and 1-in-20 forecast maximum demand, summer, all sectors excluding GPG,
including UAFG (TJ a day [TJ/d]) 35
© AEMO 2021 | Gas Statement of Opportunities 10Table 4 Total 1-in-2 and 1-in-20 forecast maximum demand, winter, all sectors excluding GPG,
including UAFG (TJ/d) 35
Table 5 Actual and forecast GPG daily demand range at the time of maximum gas demand, winter,
Central, 1-in-20 year peak conditions (TJ/d) 37
Table 6 Actual and forecast GPG daily demand range at the time of maximum gas demand, summer,
Central,1-in-20 year peak conditions (TJ/d) 37
Table 7 Forecast of available annual production as provided by gas producers, 2021-25 (PJ) 43
Table 8 Additional major midstream infrastructure 49
Table 9 Key storage infrastructure within the eastern and south-eastern gas systems 50
Table 10 LNG receipt terminals 52
Table 11 Year ahead historical forecast accuracy, total for eastern and south-eastern Australia 69
Table 12 Year ahead historical forecast accuracy, residential and commercial 70
Table 13 Year ahead historical forecast accuracy, industrial 71
Table 14 Year ahead historical forecast accuracy, total for all Queensland LNG Facilities 72
Table 15 Year ahead historical forecast accuracy, GPG 73
Figures
Figure 1 Actual daily southern gas demand since January 2019, and forecast to 2025, showing
seasonality, peakiness, southern production, and total system capacity available to meet
southern demand using existing and committed projects (TJ) 6
Figure 2 Projected eastern and south-eastern Australia gas production (including export LNG),
Central scenario, existing, committed, and anticipated developments, 2021-40 (PJ) 6
Figure 3 Domestic gas consumption actual and forecast, 2014-40, excluding LNG, all scenarios,
compared to 2020 GSOO scenarios (PJ) 9
Figure 4 Assumed hydrogen impact on natural gas consumption, 2021-50 (petajoules [PJ]) 17
Figure 5 Gas consumption actual and forecast, all sectors, Central scenario, 2014-40 (PJ) 21
Figure 6 Total gas consumption actual and forecast, all sectors, compared to 2020 GSOO scenarios,
2014-40 (PJ) 22
Figure 7 Domestic gas consumption actual and forecast, excluding LNG exports, compared to 2020
GSOO scenarios, 2014-40 (PJ) 22
Figure 8 Residential and commercial connections actual and forecasts for eastern and south-eastern
gas markets, by scenario and compared to the 2020 GSOO, 2020-40 24
Figure 9 Energy efficiency forecasts for eastern and south-eastern gas markets, by scenario and
compared to the 2020 GSOO, 2020-40 (PJ) 25
Figure 10 Wholesale price forecasts at the Wallumbilla Hub, all scenarios and compared to the 2020
GSOO, 2020-40 26
Figure 11 Residential retail price forecasts (Load weighted) for the East and South-East Coast, all
scenarios and compared to the 2020 GSOO, 2020-40 26
© AEMO 2021 | Gas Statement of Opportunities 11Figure 12 Residential and commercial annual consumption actual and forecast, all scenarios and
compared to 2020 GSOO, 2014-40 (PJ) 27
Figure 13 Industrial annual consumption actual and forecast, all scenarios and compared to 2020
GSOO, 2014-40 (PJ) 28
Figure 14 LNG annual consumption actual and forecast, all scenarios and compared to 2020 GSOO,
2014-40 (PJ) 30
Figure 15 National Electricity Market GPG consumption actual and forecast, by scenario, 2005-40 (PJ) 32
Figure 16 Forecast variance in GPG consumption due to NEM events and weather variability,
2014-40 (PJ) 33
Figure 17 Actual daily gas demand in Victoria since January 2019, showing seasonality and
peakiness (TJ) 36
Figure 18 Actual and projected maximum daily GPG demand by month in the southern states, 2019-40 38
Figure 19 Victorian regional winter 1-in-2 peak demand, all scenarios including UAFG (TJ a day) 39
Figure 20 Reserves and resources reported in the 2020 GSOO and 2021 GSOO 42
Figure 21 Forecast annual production from southern gas fields, 2021-25 (PJ) 44
Figure 22 Forecast maximum daily production capacity from southern gas fields, 2021-25 (TJ/d) 45
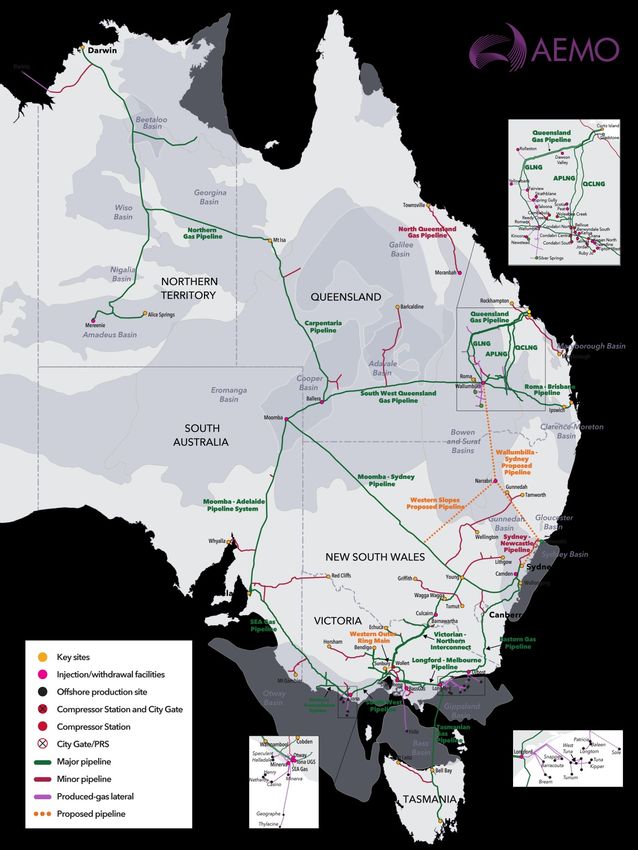
Figure 23 Map of the basins and major pipelines and load centres in eastern and south-eastern
Australian gas system 46
Figure 24 Cumulative distribution of flows along the SWQP, 1 January 2016 to 31 December 2020 (TJ/d) 48
Figure 25 Observed gas supply used to meet peak southern demand in 2020 49
Figure 26 Cumulative distribution of net changes in storage level for Iona UGS, 1 January 2017 to
31 December 2020 ((TJ/d) 51
Figure 27 Projected eastern and south-eastern Australia gas production (including export LNG),
Central scenario, existing, committed, and anticipated developments, 2021-40 (PJ) 55
Figure 28 Forecast daily demand and southern maximum total system capacity available, Central
scenario*, 2021-25 (TJ) 56
Figure 29 Cumulative distribution of aggregate flows between New South Wales and Victoria (EGP and
VNI), Central scenario, assuming existing, committed, and anticipated developments,
2021-30 (TJ/d) 57
Figure 30 Forecast gas supply options to meet southern daily demand, Central scenario, 2030 (TJ/d) 57
Figure 31 Forecast gas supply relative to southern daily demand, Central scenario, 2035 (TJ/d) 58
Figure 32 Range of domestic supply gaps* forecast under Central, Slow Change, and Hydrogen
scenarios and Low Gas Price sensitivity, considering existing, committed, and anticipated
developments, 2026-35 (PJ) 59
Figure 33 Cumulative distribution curve of southern daily demand in 2040 59
Figure 34 Victorian gas consumption with no new residential gas connections, Central scenario,
to 2040 63
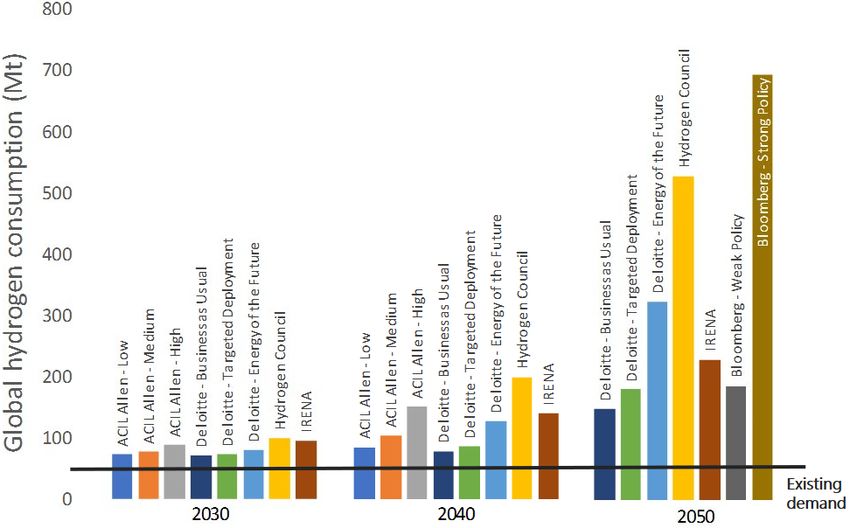
Figure 35 Various global hydrogen projections 67
Figure 36 Domestic hydrogen consumption per GSOO regions. 67
Figure 37 Gas annual consumption forecast comparison, total for eastern and south-eastern Australia 68
© AEMO 2021 | Gas Statement of Opportunities 12Figure 38 Gas annual consumption forecast comparison, residential/commercial 69 Figure 39 Gas annual consumption forecast comparison, industrial 70 Figure 40 Gas annual consumption forecast comparison, LNG 72 Figure 41 NEM gas annual consumption forecast comparison, GPG 73 Figure 42 NEM monthly GPG consumption (September 2019 to August 2020), actual vs back-cast 74 Figure 43 Gas annual consumption forecast comparison for New South Wales, GPG 75 Figure 44 Gas annual consumption forecast comparison for Queensland, GPG 76 Figure 45 Gas annual consumption forecast comparison for South Australia, GPG 76 Figure 46 Gas annual consumption forecast comparison for Tasmania, GPG 77 Figure 47 Gas annual consumption forecast comparison for Victoria, GPG 78 © AEMO 2021 | Gas Statement of Opportunities 13
1. Introduction

In the 2021 Gas Statement of Opportunities (GSOO), AEMO assesses the adequacy of reserves, resources, and
infrastructure to meet the needs of domestic and export demands over a 20-year outlook period. The GSOO
analyses a range of potential futures, focusing on the adequacy of the system to deliver for future consumers.
The 2021 GSOO also identifies potential means to service the long-term needs of consumers via a portfolio of
potential developments.
This GSOO distinguishes between geographical regions in the north and south of eastern Australia:
• Northern regions generally refers to developments, consumers, and existing facilities in Queensland and
  those Northern Territory assets with access to the Northern Gas Pipeline (NGP).
• Southern regions generally refers to developments, consumers, and existing facilities in South Australia
  (including the Queensland component of the Cooper–Eromanga basin), New South Wales, the Australian
  Capital Territory, Victoria, and Tasmania.
Information on the demand and supply forecasting inputs, assumptions, and methodologies used for this
GSOO is available on the 2021 GSOO webpage13. AEMO’s 2021 Victorian Gas Planning Report (VGPR)14, which
complements this GSOO, provides a focused assessment of the supply-demand balance to 2025 in Victoria’s
Declared Transmission System (DTS).

1.1               A changing market
Australia’s gas sector is on the cusp of transformation, with changes in consumption patterns forecast and
alternate supply sources, including liquified natural gas (LNG) import terminals, being actively developed.
Global recovery from COVID-19 may alleviate or compound the rate of change expected to influence the gas
sector. Domestically, the Australian Government has outlined its vision for a gas-fired recovery that will seek
to increase competition and transparency in Australia’s gas markets, and is to be delivered by focusing on
actions to unlock gas supply, improve transportation efficiency and empower consumers. The Department of
Industry, Science, Energy and Resources (DISER) is currently developing a National Gas Infrastructure Plan
(NGIP) which will identify priority infrastructure to support these aims.
Carbon emission reductions to achieve economy-wide net zero emissions (including contribution from the
gas sector) will have a transformative impact over the coming decades. Technological innovation and policy
support will significantly influence the pace of change and the role for the gas system in future. Current and
future investments in the energy sector, including the gas system, must recognise the challenges, risks, and
opportunities that emissions reductions will bring.

Rising prominence of hydrogen
For the first time, the 2021 GSOO includes consideration of hydrogen as a scenario within its modelling.
Momentum is building in the industry as the development of a hydrogen economy may provide a means to
achieve carbon emission reduction objectives. Since the 2020 GSOO, a number of significant developments,
funding initiatives, and strategies have demonstrated strong interest in and support for developing Australia’s
hydrogen potential. These include the:

13
     At https://aemo.com.au/en/energy-systems/gas/gas-forecasting-and-planning/gas-statement-of-opportunities-gsoo.
14
     At https://www.aemo.com.au/energy-systems/gas/gas-forecasting-and-planning/victorian-gas-planning-report.

© AEMO 2021 | Gas Statement of Opportunities                                                                          14
• National Hydrogen Strategy (CSIRO)15.
• Hydrogen Industry Strategy (Queensland) 16.
• Hydrogen Technology Program (New South Wales) 17.
• Hydrogen Investment Program and renewable hydrogen industry development plan (Victoria) 18.
• Hydrogen Action Plans in both South Australia19 and Tasmania 20.
• Renewable Hydrogen Strategy and Roadmap (Western Australia) 21.
• Renewable Hydrogen Strategy (Northern Territory) 22.
• Sustainable Energy Policy23 and Renewable Energy Innovation Fund24 (Australian Capital Territory).
With the progression of initiatives to support hydrogen development, it is increasingly important to consider
the impacts that hydrogen-blending, or even switching from gas to hydrogen consumption, may have on gas
infrastructure and future investment needs.
1.2 Scenarios and sensitivities
AEMO uses scenarios and sensitivities to explore the impact of future uncertainties. The 2021 GSOO has used
two scenarios from the 2020 Integrated System Plan (ISP) that are of most relevance to the gas sector,
specifically Central and Slow Change. To complement these scenarios, AEMO has considered additional
alternative futures to explore situations that may be relevant to opportunities and requirements for gas
investment; these are the Hydrogen scenario (for reasons discussed above) and the Low Gas Price sensitivity.
Table 1 summarises the key energy drivers considered of most relevance to the gas market across these four
alternative futures.
Table 1 Scenario drivers of most relevance to the gas market
Driver Central Slow Change Hydrogen Low Gas Price
Economic growth, population, and Moderate Low High Moderate
gas connections outlook
Energy efficiency gains Moderate Low High Moderate
Fuel-switching from natural gas Moderate Low High Low-Moderate
Natural gas price Moderate High Moderate* Low
Renewable energy generation Moderate Low High Moderate
Coal-fired generation Moderate High Low Moderate
* The adoption of hydrogen is an input assumption for this scenario and uptake is not based on economic modelling. The moderate
natural gas prices are used to influence remaining consumption projections.
15
CSIRO, available at https://www.csiro.au/en/Do-business/Futures/Reports/Energy-and-Resources/Hydrogen-Roadmap.
16
At https://www.dsdmip.qld.gov.au/industry/priority-industries/hydrogen-industry-development.
17
At https://energy.nsw.gov.au/government-and-regulation/electricity-strategy/memorandum-understanding.
18
At https://www.energy.vic.gov.au/renewable-energy/victorian-hydrogen-investment-program and https://www.energy.vic.gov.au/renewable-hydrogen/
industry-development-plan respectively.
19
At http://www.renewablessa.sa.gov.au/topic/hydrogen.
20
At https://www.stategrowth.tas.gov.au/news/archived_news/the_tasmanian_renewable_hydrogen_action_plan.
21
At https://www.wa.gov.au/government/publications/western-australian-renewable-hydrogen-strategy-and-roadmap.
22
At https://industry.nt.gov.au/publications/business/strategies/northern-territory-renewable-hydrogen-strategy.
23
At https://www.environment.act.gov.au/__data/assets/pdf_file/0007/1411567/act-sustainable-energy-policy-discussion-paper.pdf.
24
At https://www.environment.act.gov.au/energy/growth-in-the-clean-economy.
© AEMO 2021 | Gas Statement of Opportunities 15Central
In the Central scenario, the pace of transition is determined by market forces under current federal and state
government energy and environmental policies. Key assumptions include:
• Policies, rules and regulations regarding gas connections, energy efficiency, and fuel-switching,
specifically:
- The Victorian Energy Upgrades (VEU) program and Solar Homes scheme, as well as the recently
announced Household Energy Savings Package and Business Recovery Energy Efficiency Fund.
- The New South Wales Energy Savings Scheme.
- The Australian Capital Territory parliamentary agreement to ban new residential connections to gas.
- The National Construction Codes (Section J).
- The E3 Program managed by the Greenhouse Energy Minimum Standards (GEMS) regulator.
• Electricity sector infrastructure consistent with the 2020 ISP’s actionable ISP projects (excluding those with
decision rules) and Future ISP projects timed with the least-cost development path for the Central
scenario.
Slow Change
The Slow Change scenario is characterised by challenging economic conditions resulting in a slow-down of
the energy transition, reflected in slower changes in technology costs, and a more challenging environment in
which to make the upfront investments required for significant emissions reduction.
From a gas sector perspective, the key differences to the Central scenario include:
• Lower economic growth.
• Lower energy consumption.
• Lower carbon emissions reductions from the energy sector.
• Electricity sector infrastructure consistent with the 2020 ISP’s actionable ISP projects (excluding those with
decision rules), and Future ISP projects timed with the least-cost development path for the Slow Change
scenario.
With the reduced ambition for emissions reduction, some generator refurbishments extend the life of ageing
coal-fired generators, as was observed in the ISP’s Slow Change scenario, and less development of renewable
generation and distributed energy resources is applied.
Hydrogen
The Hydrogen scenario considers a future with a thriving Australian green hydrogen economy helping drive
stronger economic and population growth while taking stronger action to address climate change risks. In
this scenario, commitment to more rapid nation-wide emissions reductions is forecast to lead to accelerated
exits of existing fossil fuel consumption in the electricity sector, and hydrogen is used to replace up to 20% of
the domestic natural gas demand by 2040. Significant growth in green hydrogen consumption is expected in
this scenario beyond 2040 (outside the GSOO forecast horizon) to enable deeper emissions reductions. In this
scenario, the hydrogen is assumed to be produced from grid-connected electrolysers. The impacts this will
have on the electricity sector will be explored further in AEMO’s 2021 Electricity Statement of Opportunities
(ESOO) and 2022 ISP.
From a gas sector perspective, key differences to the Central scenario include:
• Faster technological improvements and more aggressive emissions reduction targets leading to faster
fuel-switching away from fossil fuels.
• Emissions reductions efforts driven by fuel-switching, energy efficiency improvements, and replaced
end-use demand from hydrogen substitution.
© AEMO 2021 | Gas Statement of Opportunities 16• Higher population and economic growth, leading to higher energy consumption up until 2030.
• Greater uptake of electric and fuel-cell vehicles.
• Natural gas consumption from ammonia, steel, and oil refineries being assumed to switch to
electrolyser-produced hydrogen by 2040.
• The distribution grid being assumed to switch to 10% blended hydrogen (by energy) by 2038.
• Electricity sector infrastructure consistent with the 2020 ISP’s actionable ISP projects (excluding those with
decision rules) and Future ISP projects timed with the least-cost development path for the Step Change
scenario.
Figure 4 demonstrates the assumed hydrogen impact on natural gas consumption 25, extending the horizon
out to 2050 to show the projected rapid acceleration of change forecast for the 2040s. See Appendix A1 for
more detail on the consultation process and hydrogen demand assumptions for this scenario.
Figure 4 Assumed hydrogen impact on natural gas consumption, 2021-50 (petajoules [PJ])
700
600
Annual consumption (PJ)
500
400
300 Increasing
displacement
200 of
natural gas
100 with
hydrogen
0
2023
2027
2037
2021
2022
2024
2025
2026
2028
2029
2030
2031
2032
2033
2034
2035
2036
2038
2039
2050
2040
2041
2042
2043
2044
2045
2046
2047
2048
2049
Net Natural Gas Consumption Hydrogen in Distribution Grid Industrial Hydrogen Consumption
Low Gas Price
The Low Gas Price sensitivity explores the impact of lower gas prices on gas consumption from residential,
commercial, and industrial consumers, in addition to gas-powered generation of electricity (GPG). This
sensitivity exclusively focuses on the impact of lower gas prices on consumption; it makes no specific
assumptions in relation to the impact of other policy initiatives that could impact growth in consumption.
The sensitivity reflects the settings of the Central scenario, including the assumed changes in electricity sector
infrastructure.
Lower gas prices alone (with prices at the Wallumbilla Hub ranging from $5.90/gigajoule [GJ] to $6.70/GJ) are
forecast to provide some increases in gas consumption, mainly through increased GPG usage. Surveys of
existing major large industrial loads indicate that gas pricing alone would not be a sufficient driver for major
industrial investment for these users at this time.
25
AEMO consulted with stakeholders on the appropriate scale and timing of the hydrogen sector’s development in this scenario in a bespoke hydrogen
workshop, as well as in AEMO’s monthly Forecasting Reference Group (FRG) open forum. See Presentation 2, FRG Meeting pack 35, September 2020, at
https://aemo.com.au/en/consultations/industry-forums-and-working-groups/list-of-industry-forums-and-working-groups/forecasting-reference-group-
frg.
© AEMO 2021 | Gas Statement of Opportunities 171.2.1 Additional sensitivities
In some sections of this report, AEMO used targeted sensitivity analysis to explore the impact of variances in
GPG demand on gas supply adequacy. Specific sensitivities are included within the assessment of gas
consumption for GPG in Section 2.2.4, and include electricity infrastructure outages, weather variance, and
delayed connections of new renewable energy generation. Forecasting gas consumption for GPG is
challenging because it is driven by events, such as extreme weather or generation outages, that can be
difficult to predict and which lead to significant variations in forecasts. Appendix A2 compares AEMO’s GPG
forecast accuracy against actual consumption, and highlights that all recent forecasts have underestimated
consumption, due to a number of events that have resulted in higher GPG than that forecast.
1.3 Improvements for the 2021 GSOO
As part of continuous improvement, AEMO has applied improvements to the data and models used in this
2021 GSOO to better represent the existing system and future developments. These included:
• Migrating from using transmission survey data to Gas Bulletin Board (GBB) data for actual consumption for
large industrial users. This improved the accuracy of large industrial load (LIL) forecasts. Greater
information and transparency from the survey process has also led to improvements in forecasting
Tasmanian peak demands.
• Reflecting the high uncertainty associated with COVID-19. AEMO added a 95/5 confidence interval on the
Tariff V (residential and small commercial) consumption forecasts in the first forecast year between
Hydrogen (applying a +5% interval) and Slow Change (applying a -5% interval), with Central (and Low Gas
Price sensitivity) taking the model average value. This short-term consumption range is less about the
uncertainties represented through scenario drivers, and more about capturing the breadth of potential
outcomes that may particularly affect residential and commercial gas consumption and demand.
• The use of affine linear heat rates curves rather than constant average heat rates to estimate GPG
consumption. This approach improves the accuracy of forecast and historical consumption for GPG, and
has been applied to 2020 estimate and the 2021 GSOO forecast.
1.4 Supplementary information
Supporting material including supply input data files, methodology reports, and figures and data is available
on AEMO’s website 26, along with previous GSOO reports. The supply input data files provide information
(including capacity) about pipelines, production facilities, storage facilities, field developments, and any new
projects or known upgrades considered in this GSOO analysis. These files also provide an update of reserves
and resources and cost estimates used for the GSOO modelling27.
Other relevant reference materials are listed in Table 2 below.
Table 2 Other relevant reference materials
Information source Website address and link
2021 Victorian Gas Planning Report https://www.aemo.com.au/energy-systems/gas/gas-
forecasting-and-planning/victorian-gas-planning-report
Demand forecasting data portal http://forecasting.aemo.com.au
Gas Bulletin Board – Map and Reports https://www.aemo.com.au/energy-systems/gas/gas-bulletin-
board-gbb
26
At https://aemo.com.au/en/energy-systems/gas/gas-forecasting-and-planning/gas-statement-of-opportunities-gsoo.
27
The published file showing reserves and resources was produced by Wood Mackenzie
© AEMO 2021 | Gas Statement of Opportunities 18Information source Website address and link
2020 Inputs, Assumptions and Scenarios Report, and https://www.aemo.com.au/energy-systems/major-
Excel Workbook publications/integrated-system-plan-isp/2022-integrated-
system-plan-isp/current-inputs-assumptions-and-scenarios
BIS Oxford Economics, 2020 Macroeconomic forecasts* Economic forecasts applied following 2020 COVID-19
update:
https://aemo.com.au/-
/media/files/electricity/nem/planning_and_forecasting/inputs-
assumptions-methodologies/2021/bis-oxford-economics--
macroeconomic-forecasts-update-october-2020.pdf?la=en
Original economic forecasting report:
https://aemo.com.au/-
/media/files/electricity/nem/planning_and_forecasting/inputs-
assumptions-methodologies/2020/bis-oxford-economics-
macroeconomic-projections.pdf
* In developing the forecasts for the GSOO, AEMO applied the October 2020 COVID-19 updated economic forecasts provided by BIS
Oxford Economics. This update was an incremental update to the economic variables; the original report has a complete description of
the methodologies deployed by BIS Oxford.
© AEMO 2021 | Gas Statement of Opportunities 192. Gas consumption and
demand forecasts
This chapter outlines forecasts of the annual quantity of gas used (consumption) and the maximum daily
quantity of gas consumed (demand) across the various customer sectors of gas. These gas demand forecasts
for the 2021 GSOO are available on the AEMO Forecasting data portal 28.
Key forecast trends
• Annual gas consumption in the next 20 years is uncertain, with downside risks outweighing the
likelihood of gas consumption growth. Across AEMO’s scenarios, while the Central outlook is for a
relatively flat trajectory of gas consumption, alternative scenarios show decline, either from economic
decline and closure risks, or through fuel substitution towards hydrogen fuel sources.
- In the next five years, reduced consumption is forecast from energy efficiency savings,
fuel-switching, and declining GPG consumption (at an annual measure) with increasing variable
renewable energy (VRE) generation entering the National Electricity Market (NEM). Industrial
closures remain possible under extended weak economic conditions. Furthermore, while energy
costs continue to be a key issue for large gas users, reduced gas prices alone are not expected to
lead to significant increased gas consumption, particularly from industrial consumers.
- Increasing investments in energy efficiency and fuel-switching are forecast to lower consumption,
moderating the growth that will naturally occur through new gas connections (except in the
Australian Capital Territory, where new gas connections are banned).
- To 2040, the potential for fuel substitution towards hydrogen29 (and blending) is increasing. In the
scenarios considered, gas consumption in the industrial sector is assumed to be the first impacted
by hydrogen fuel substitution in the next 20 years.
• Daily gas demand is highly seasonal, and southern states in particular have significant variation from
heating appliance loads in winter. By 2030, GPG daily peak demand for gas may switch from being
summer peaking to winter peaking, further exaggerating differences between summer and winter
daily gas demand in southern states.
• GPG retains a critical role in meeting electricity demand during high temperatures in summer or low
VRE periods in winter. GPG demand is frequently event-driven, and AEMO forecasts continued
volatility in GPG demand, heavily dependent on the operation of coal, hydro, and renewable energy
generators. Delays or deferral in developing new generation and transmission capacity, or earlier than
expected closure of coal-fired generation, are forecast to increase annual GPG consumption.
28
At www.forecasting.aemo.com.au – select ‘GSOO 2021’ from the publication drop-down.
29
As forecast by various publications, including the Energy Networks Australia’s Gas Vision 2050 publication, at https://www.energynetworks.com.au/
projects/gas-vision-2050/.
© AEMO 2021 | Gas Statement of Opportunities 202.1 Total eastern and south-eastern gas consumption forecasts
Figure 5 shows the 20-year total consumption forecast for eastern and south-eastern gas markets under the
Central scenario, broken down by consumer types. In the Central scenario, to 2040:
• The LNG sector is forecast to remain flat; by 2040 gas consumption for LNG is assumed to be only
79 petajoules (PJ) higher than the 2020 actual consumption of 1,338 PJ.
• Industrial consumption is forecast to remain stable through to 2040, at around 256 PJ.
• The residential/commercial forecast is also stable through to 2040, and is forecast to be approximately
195 PJ by the end of the 20-year horizon.
• GPG is a volatile consumer of gas, as it provides a firming function to fill periods of low VRE production,
and can substitute for lost coal-fired generation during periods of outages (planned or unplanned), as
detailed in Section 2.2.4.
- The downward GPG consumption trend over recent years is projected to continue and accelerate in
the next five years as more VRE projects come online to meet various state renewable energy targets.
- By 2040, GPG consumption across scenarios is forecast to be between 70 PJ and 90 PJ, which is 30% to
45% lower than the 127 PJ consumed in 2020.
Figure 5 Gas consumption actual and forecast, all sectors, Central scenario, 2014-40 (PJ)
2,000
1,800
Annual consumption excl. UAFG (PJ)
1,600
1,400
1,200
1,000
800
600
400
200
0
2020
2021
2022
2023
2024
2025
2026
2027
2028
2029
2030
2031
2032
2033
2034
2035
2036
2037
2038
2039
2014
2015
2016
2040
2017
2018
2019
Industrial Residential/Commercial GPG LNG 2020 GSOO
Figure 6 compares the consumption forecasts of each scenario presented in the 2021 GSOO, showing the
spread of outcomes, including comparisons to comparable 2020 GSOO forecasts (Central and Slow Change
scenarios). For most consumer types, the forecast consumption in this 2021 GSOO, by scenario, is consistent
with the 2020 GSOO forecast. The material difference between the 2020 and 2021 GSOO forecasts in the Slow
Change scenario is explained in Chapter 2.2.3.
Individual consumption forecasts for each state are provided on AEMO’s National Electricity and Gas
Forecasting portal30. This portal also allows the user to drill through each state’s component forecasts.
30
At http://forecasting.aemo.com.au.
© AEMO 2021 | Gas Statement of Opportunities 21Figure 6 Total gas consumption actual and forecast, all sectors, compared to 2020 GSOO scenarios,
2014-40 (PJ)
2,500
Annual consumption excl. UAFG (PJ)
2,000
1,500
1,000
500
0
2031
2014
2020
2021
2022
2023
2024
2025
2026
2027
2028
2029
2030
2032
2033
2034
2035
2036
2037
2038
2039
2015
2016
2040
2017
2018
2019
Actual 2021 GSOO Central 2021 GSOO Hydrogen
2021 GSOO Low Gas Price 2021 GSOO Slow Change 2020 GSOO Central
2020 GSOO Slow Change
Figure 7 shows only the domestic market, excluding LNG exports, so domestic trends are easier to identify.
The figure demonstrates that:
• Across the scenario forecasts, domestic gas consumption decline is more likely than growth, as consumers
invest in measures to increase energy efficiency, including switching away from gas consumption.
• Hydrogen production and blending within distribution networks may present a strong offset for gas
production needs, but the scale and timing of this possible alternative fuel is highly uncertain. Industrial
processes that currently use gas may be first candidates for conversion to hydrogen fuels.
• Dispersion of 2021 GSOO consumption forecasts across scenarios increases over time, highlighting
increasing future gas sector uncertainty.
Figure 7 Domestic gas consumption actual and forecast, excluding LNG exports, compared to 2020 GSOO
scenarios, 2014-40 (PJ)
700
Annual consumption excl. UAFG (PJ)
600
500
400
300
200
100
0
2028
2020
2021
2022
2023
2024
2025
2026
2027
2029
2030
2031
2032
2033
2034
2035
2036
2037
2038
2039
2014
2015
2016
2017
2018
2019
2040
Actual 2021 GSOO Central 2021 GSOO Hydrogen
2021 GSOO Low Gas Price 2021 GSOO Slow Change 2020 GSOO Central
2020 GSOO Slow Change
© AEMO 2021 | Gas Statement of Opportunities 22You can also read