GANmapper: geographical content filling - arXiv
←
→
Page content transcription
If your browser does not render page correctly, please read the page content below
GANmapper: geographical content filling
                                                                 Abraham Noah Wua , Filip Biljeckia,b,∗
                                                 a
                                                     Department of Architecture, National University of Singapore, Singapore
                                                   b
                                                     Department of Real Estate, National University of Singapore, Singapore
arXiv:2108.04232v1 [cs.CV] 7 Aug 2021

                                        Abstract
                                        We present a new method to create spatial data using a generative adversarial
                                        network (GAN). Our contribution uses coarse and widely available geospatial
                                        data to create maps of less available features at the finer scale in the built envi-
                                        ronment, bypassing their traditional acquisition techniques (e.g. satellite imagery
                                        or land surveying). In the work, we employ land use data and road networks as
                                        input to generate building footprints, and conduct experiments in 9 cities around
                                        the world. The method, which we implement in a tool we release openly, en-
                                        ables generating approximate maps of the urban form, and it is generalisable to
                                        augment other types of geoinformation, enhancing the completeness and quality
                                        of spatial data infrastructure. It may be especially useful in locations missing
                                        detailed and high-resolution data and those that are mapped with uncertain or
                                        heterogeneous quality, such as much of OpenStreetMap. The quality of the re-
                                        sults is influenced by the urban form and scale. In most cases, experiments
                                        suggest promising performance as the method tends to truthfully indicate the lo-
                                        cations, amount, and shape of buildings. The work has the potential to support
                                        several applications, such as energy, climate, and urban morphology studies in
                                        areas previously lacking required data.
                                        Keywords: Deep learning, machine learning, crowdsourced geoinformation,
                                        GIScience, GeoAI

                                        1. Introduction
                                            Generative adversarial networks (GANs) are a type of generative models in-
                                        troduced by Goodfellow et al. (2014), which have rapidly gained currency in

                                           ∗
                                             Corresponding author
                                             Email addresses: abraham@nus.edu.sg (Abraham Noah Wu), filip@nus.edu.sg
                                        (Filip Biljecki)
                                        Preprint submitted to journal                                       August 11, 2021
a variety of application domains, such as thermal comfort, energy, and design
(Quintana et al., 2020; Yan et al., 2020a; Rachele et al., 2021). Using a generator-
discriminator model pair in the training process, the generator in a GAN gradu-
ally learns to create data distributions that pass the checks by the discriminator,
therefore producing patterns that closely resembles the original dataset.
    With sufficient training data, state-of-the-art GANs are able to generate syn-
thetic photo-realistic images that can deceive the human eye (Brock et al., 2018;
Karras et al., 2019, 2020). One scientific use of GANs is to generate synthetic
data for deep learning training. Instead of generating synthetic examples manu-
ally, GANs can be used to generate realistic-looking synthetic data automatically
and create more labelled examples to augment the original dataset. This applica-
tion is especially useful in domains such as medicine where labelling a large set
of data could be time-consuming and expensive (Frid-Adar et al., 2018; Sand-
fort et al., 2019; Sela et al., 2017). Moreover, research in the same domain has
shown that the generated datasets could even be used directly without the origi-
nal dataset for privacy protection. For example, accurate but fake medical images
can be generated instead of using actual images to protect the identity of patients,
and it has been proven that the training accuracy of using generated labels in lieu
of real images could approach the accuracy of training with real data while pro-
tecting sensitive privacy data of patients at the same time (Beaulieu-Jones et al.,
2019; Bowles et al., 2018).
    Despite a strong momentum and demonstrated usability, the application of
GANs in geographic information remains scarce. In this paper, we investigate
whether we can apply GAN on geospatial data with the aim of mapping new
geospatial features, potentially introducing a new mapping method and con-
tributing to the increase of the completeness of data.
    Our motivation, geared towards enhancing the scale, completeness, and array
of existing data, is driven by recent rapid developments of acquiring certain types
of geospatial data and at a coarse resolution, reaching near-global coverage and
completeness. For example, land-use datasets (Robinson et al., 2021; Ludwig
et al., 2021), aggregated urban form (Esch et al., 2017; Chen et al., 2020), street
networks (Zhang et al., 2015; Brovelli et al., 2016) and population data at the
district level (Tatem, 2017; Lloyd et al., 2019) are now available widely and
freely for nearly any location worldwide, with recent developments showing no
sign of waning. However, other types of spatial data, such as building footprints,
3D city models and points-of-interest (POIs), which are perhaps more complex
and laborious to acquire but no less important for spatial data infrastructures,
remain scarce (Bright et al., 2018; Biljecki et al., 2021). OpenStreetMap (OSM),

                                         2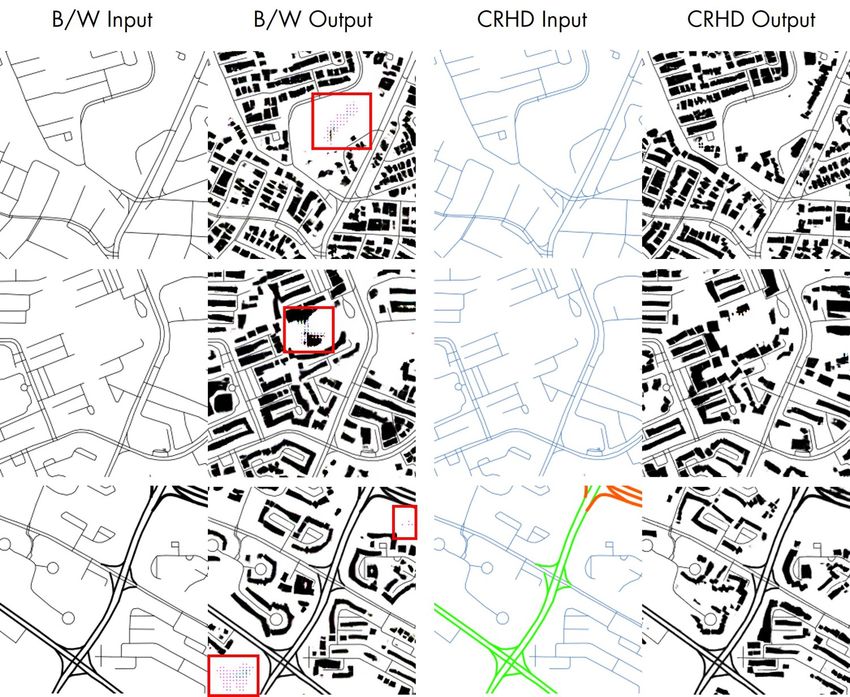
the principal instance of Volunteered Geoinformation (VGI) (Yan et al., 2020b),
is an archetypal example of such heterogeneity: data on roads reached near full
completeness (Barrington-Leigh and Millard-Ball, 2017; Minaei, 2020), giving
rise to an increasing number of large-scale analyses (Boeing, 2021; Calafiore
et al., 2021). However, data on buildings in the same repository remain missing
or partially complete in large swaths of land around the world, even in areas
where other features such as street networks are fully mapped (Anderson et al.,
2019; Barrington-Leigh and Millard-Ball, 2017; Biljecki, 2020; So and Duarte,
2020; Herfort et al., 2021).
    Given the intertwined nature of different features in the built environment
across multiple scales (Milojevic-Dupont et al., 2020; Majic et al., 2021; Moc-
nik, 2021), we put forward a hypothesis that we can use GAN to predict one
spatial dataset from another. That is, we seek to apply this technique on widely
available geographic datasets at the same or coarser scale (i.e. street networks
and land use) to produce counterparts at a finer scale that are less frequently
available (i.e. footprints of individual buildings). In this paper, we focus on
buildings because they are one of the most prominent features in the built en-
vironment and data on buildings is being relied upon a rapidly growing number
and variety of applications (Fleischmann et al., 2020; Patias et al., 2021; Palli-
wal et al., 2021; Botta and Gutiérrez-Roig, 2021; Wu and Biljecki, 2021; Harig
et al., 2021), but remains constrained by the current landscape of data worldwide,
which is lagging in completeness and coverage in comparison to other features.
As we develop a novel approach to map individual building footprints at a large
scale, we also endeavour to design and implement a scalable and generalisable
approach that will be replicable with other types of features, therefore seeking to
contribute to the field with a new method of mapping spatial data with GANs.
    While novel AI techniques have been extensively applied in collecting data
on buildings (e.g. their footprints and heights), nearly all approaches require
other forms of comparably scarce or complex data such as point clouds and
high-resolution imagery, or they operate at a coarse scale such as deriving the
rough urban fabric without delineating individual buildings. Thus, they perform
either at high resolution but limited scale or at large-scale but at low resolution
(Geis et al., 2019; Bshouty et al., 2019; Park and Guldmann, 2019; Xie et al.,
2019; Sun et al., 2020; Li et al., 2020b; Döllner, 2020; Chen et al., 2021a; Fan
et al., 2021; Ledoux et al., 2021), leaving no means to generate higher resolution
data on buildings at large-scale in an inexpensive and feasible manner. Those
approaches that are demonstrated to perform at higher resolution (regarding in-
dividual buildings) and have a potential to scale widely, rather focus on enriching

                                        3
existing data on buildings (e.g. predicting additional attributes) instead of gen-
erating entirely new data (Milojevic-Dupont et al., 2020). Our approach instead
seeks to use widely and freely available data such as land use and road data to
map buildings from scratch.

Figure 1: Our work in a nutshell: we investigate the use of GAN in generating a spatial dataset
from another one. Such an approach may enable translating widely available data such as road
networks to create maps of less common features such as building footprints.

    In this paper, we introduce GANmapper, a generator of spatial data on build-
ings (i.e. footprints) that is capable of creating realistic looking and hierarchically
correct building footprint data from coarser urban data such as street networks.
(Figure 1).
    The paper is organised as follows. Section 2 provides an introduction to GAN
and uses hitherto in the domain of spatial sciences documented in international
scientific outlets. Section 3 presents the data preparation technique and our pro-
posed model architecture. Section 4 discusses the results and demonstrates the
scalability and accuracy of using GANs in generating missing spatial building
information in the urban context, together with a discussion on potential appli-
cations. We conclude the paper with Section 5.

2. Background
2.1. Generative Adversarial Networks
    Traditionally, generative models in the field of machine learning are unsu-
pervised where the model would automatically learn the regularities or patterns
in the input data in such a way that it can be used to generate new examples
that closely represent the input data (Han et al., 2018; Chen et al., 2018; Maaløe
et al., 2016).
    GANs, on the other hand, add a supervised task to the generative process
by using two models in the training process. A generator and discriminator pair
based on game theory is used where the generator network must compete against
                                         4
the adversarial discriminator (Goodfellow et al., 2014, 2016). The generator net-
work directly produces samples. Its adversary, the discriminator network, at-
tempts to distinguish between samples drawn from the training data and samples
drawn from the generator. Enhancing the generator-discriminator architecture
with deep convolutional neural networks (Radford et al., 2015), state-of-the-art
unconditional GAN models could generate high-fidelity photo-realistic images
that could pass the scrutiny of untrained eyes as real images (Brock et al., 2018;
Karras et al., 2019, 2020; Zakharov et al., 2019).
    While unconditional GANs generate images out of randomly initialised noises,
conditional GANs allow granular semantic control in the generated images (Isola
et al., 2017; Park et al., 2019). During training, a mask-image pair is used for the
generator model to learn the weights to translate the input images to realistic-
looking output images. This approach allows additional layers of control and
users would be able to specify different source-target combinations for a variety
of use cases.
    Both conditional and unconditional GANs have shown promising applica-
tions in a multitude of fields. Apart from generating new data, as hinted at in
the introduction, GANs can also outperform traditional techniques in content
translation or content filling. For example, cycle-consistent adversarial networks
(CycleGAN), proposed by Zhu et al. (2017), is able to translate photos into differ-
ent stylistic expressions, and text-based GANs are able translate text inputs into
images (Zhang et al., 2017; Reed et al., 2016). Furthermore, using a tweaked
architecture, GANs can be used in content-aware image in-painting to fill up
missing areas in an image with high fidelity (Li et al., 2017; Yeh et al., 2017;
Pathak et al., 2016).
    Moreover, GANs are not restricted to generating image data. With an appro-
priate generator architecture, GANs can be used to generate sequential data such
as audio and music as well. They are now able to generate melodies from lyrics
(Yu et al., 2021) or compose music from a single latent vector (Engel et al.,
2019), or other synthetic time-series data like electrocardiograms (Zhu et al.,
2019b), stock market trends, and electricity consumption (Yoon et al., 2019).

2.2. Applications of Generative Adversarial Networks in GIS
    Researchers have recently begun to investigate applications of GANs with
geospatial data. For example, unconditional GANs have been used to gener-
ate realistic synthetic satellite images of landscapes and cities from randomly
initiated noises (Abady et al., 2020; Zhao et al., 2021), and conditional GANs
have been explored to translate satellite images into cartographic representations
(Isola et al., 2017; Li et al., 2020a) or generate cartographic representations from
                                            5
geospatial vector data (Kang et al., 2019). Conditional GANs can also create
semantic-responsive land-cover maps with user-drawn colour masks, adding hu-
man input in the generative process (Park et al., 2019; Baier et al., 2021). Fur-
thermore, using CycleGAN (Zhu et al., 2017), Ye et al. (2021) have created an
automatic colouring GAN that creates colour renders of urban masterplans from
CAD drawings instantly.
    While the above-mentioned models have gathered wide interest, their aes-
thetic value and novelty often exceed their practical use, and the scientific aspect
of GANs in GIScience still remains underexplored. Inspired by the many proven
use cases of GANs in other fields, we believe that GANs can be used to create
or augment geospatial data. Uncovering such applications may open up many
opportunities in downstream research.
    There are currently a few notable papers that explore generating or interpo-
lating spatial datasets with GANs. Rao et al. (2020) generated topographic maps
of urban areas that follow topographical constraints and preserve the structure,
orientation and relative density of the training samples. This approach allows re-
searchers to ‘summarise’ maps with detailed building footprints into more gen-
eral urban forms for ease of interpretation. Using a similar approach, Zhu et al.
(2019a) demonstrated the ability of GANs in interpolating elevation data and
achieved good results compared to statistical methods. Another research pertains
to privacy protection. Courtial et al. (2021) used a GAN with a Long Short-Term
Memory (LSTM) Architecture (Hochreiter and Schmidhuber, 1997) to gener-
ate synthetic commuter trajectory data to facilitate downstream learning while
preserving user identity, which is relevant in the current day of ever-increasing
concern on user data privacy, especially if including location data.

3. Methodology
3.1. Overview
    Inspired by the ability of GANs to generate reliable synthetic data, we seek to
explore geospatial data generation, specifically in filling building footprint infor-
mation. We argue that the application of GANs in GIScience should not remain
in merely generating compelling-looking synthetic maps (Section 2.2) but can
transcend on to be used for geospatial content filling as well. Therefore, we pro-
pose GANmapper, a geographical content filling AI based on GAN architecture,
which is able to map the building footprints of unmapped areas with similar ur-
ban forms and could be extended to other applications such as quality checking
or generating urban design options as well.

                                         6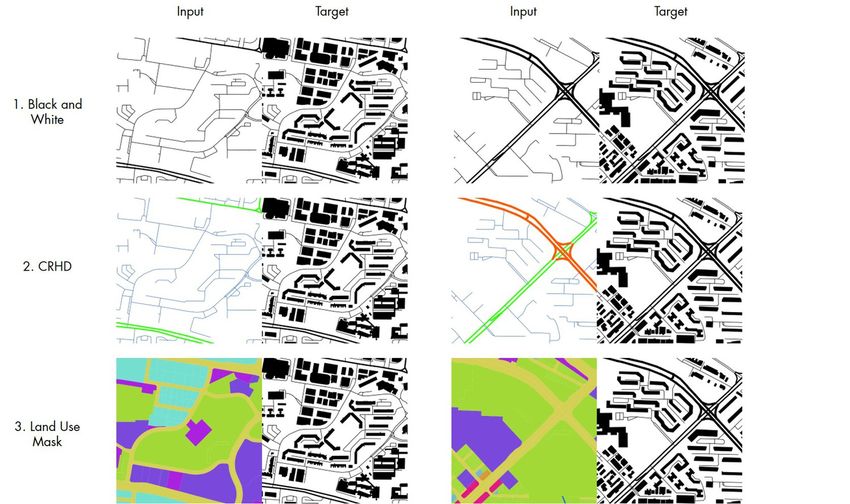
To investigate the performance and scalability of our model, we created four
different experiments with OSM data from nine cities across the world repre-
senting different forms of urban morphology. These cities are major cities in the
world that generally have a high degree of building data completion to provide
adequate training data and ground truths for evaluation.
    By focusing on OSM data, our work essentially investigates the potential of
using one set of (better mapped) features such as street networks to fill another
(less or entirely unmapped) counterpart, levelling their completeness and quality.
    Building footprints in datasets such as OSM may be entirely missing or have
partial completeness in some locations (Fan et al., 2014; Biljecki et al., 2021).
Our approach is designed to work in unmapped areas, ignoring existing foot-
prints, if any. Thus, it is important to underline that no building footprints are
used as input, presenting an approach to derive new spatial data from scratch.
However, the method would work also in locations with partial completeness of
data on buildings.

3.2. Model Architecture

                    Figure 2: The GANmapper model architecture.

   The GANmapper model architecture is a type of Image-to-Image Conditional
                                  7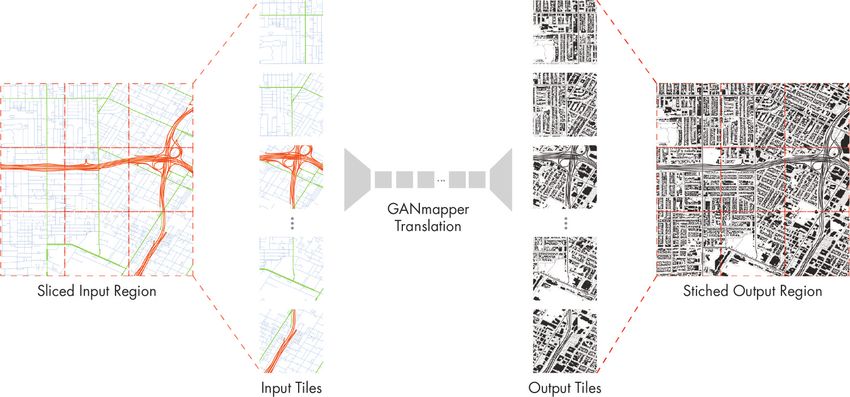
GAN (Mirza and Osindero, 2014; Isola et al., 2017) that translates input image
data such as street networks to a target image populated with generated building
footprints. According to our literature review of international scientific litera-
ture (Section 2.2), this work is the first one investigating the performance and
possibility of such a use case with conditional GANs.
    Figure 2 provides an overview of the proposed GAN architecture. We use
an autoencoder (Hinton and Salakhutdinov, 2006) architecture with 9 residual
blocks (He et al., 2016) for the generator. In each forward pass, the generator
will try to generate outputs that could ‘fool’ the discriminator into classifying
the generated image as ‘real’, while the discriminator will learn to classify gen-
erated image as ‘fake’ and ground-truth target as ‘real’. The discriminator splits
the input image into 70x70 tiles and outputs a Boolean classification for the gen-
erated image from the average classification value of all split tiles. At the end of
each forward pass, loss for both the generator and discriminator is calculated and
their weights updated. As each epoch passes, both the generator and discrimina-
tor get better in their roles until the generator’s output would pass the scrutiny of
the discriminator as a real image 50% of the time as in a zero-sum game.

3.3. Pre- and post-processing

              Figure 3: Pre-processing and post-processing for large regions.

    As with other deep learning models, the resolution of the input and output is
limited by the memory of the hardware, and the resource needed scales propor-
tionally to the size of the input images. Thus, it would be too resource-intensive

                                            8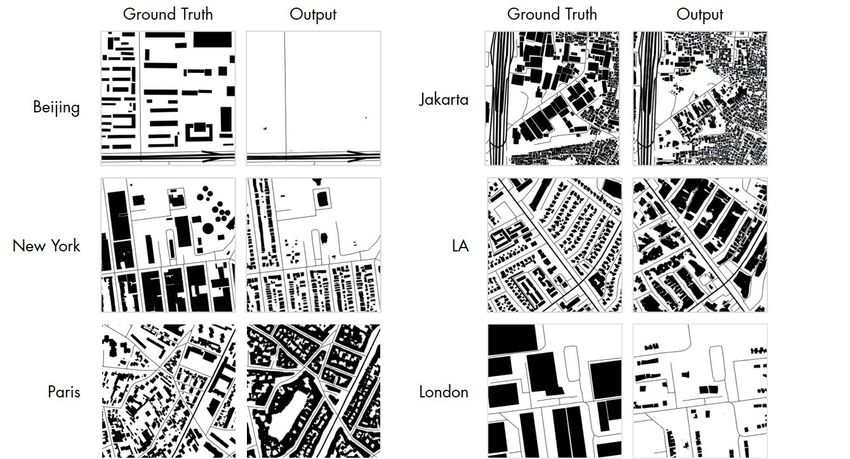
to fit a large area (e.g. an entire city or a neighbourhood) within a single high-
definition image. Instead, we use a pre-processing pipeline to convert the tar-
geted areas into 256x256 raster tiles into a slippymap (XYZ tiles) directory sim-
ilar to previous works in object detection in satellite images (Ng and Hofmann,
2018; Wu and Biljecki, 2021). The output tiles are generated according to the
same directory structure as the input tiles and can be restored into a larger whole.

3.4. Datasets and Preliminary Exploration

Figure 4: Three different input types, which we investigate independently of each other. While
each input dataset provides promising results, in the experiments, the Coloured Road Diagrams
(CRHD; in the second row) proved to be the best performing input dataset. Thus, we focus on
using this type of representation in the detailed experiments.

    Urban morphology can be encapsulated with a variety of cartographic rep-
resentations. In the model, the input data provides the initial conditions to the
generator and affects the ability of the model to learn efficiently.
    As this paper is the first attempt in the field for building data generation with
GAN, we seek to investigate the most suitable input-output pair for the task. We
experimented with three different input representations derived from two datasets
that are widely available: street networks (two variants) and land use data. In
these preliminary exploration, we focus on Singapore.
    Figure 4 shows the different input-target pairs used in the experiments for
training. OSM road network data (first two rows) are used to create two types
                                           9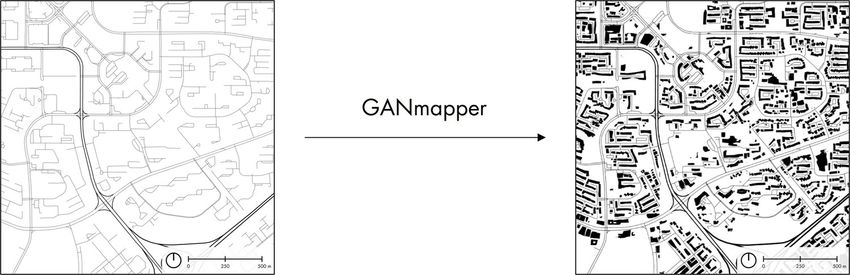
of inputs: (1) Single-Channel Black and White representation with road hier-
archy differentiated by line-width; and (2) Coloured Road Hierarchy Diagrams
(CRHDs) that represents road hierarchy in colour on top of line width (Chen
et al., 2021b). The target images are composed of Black and White input images
with building polygons obtained from OSM.
    The land use map of Singapore is used to create a third input-target pair as
an alternative representation. For this purpose, we have used open data1 by the
Urban Redevelopment Authority of Singapore. The different land use parcels
are colour-coded and represent different land use schemes. This image mim-
ics the image-mask pair used in other conditional GANs such as pix2pix for a
comparative study on the effect of input types on the prediction results.

3.5. Experiment Setup
    Four experiments are set up with different configurations and datasets to in-
vestigate the performance and feasibility of our method.
    In Experiment 1, we investigate the performance of the three types of input-
output pairs mentioned in the previous section to find the best performing pair.
We also compare the results of our model in all three input-output pairs with a
popular baseline Conditional GAN model proposed by Isola et al. (2017).
    In Experiment 2, we use the best performing input-output pair found in Ex-
periment 1 to compare the performance of results on 4 different tiles scaling
configurations, ranging from a neighbourhood scale of about 2km per tile to the
street-level scale of about 300m per tile (zoom levels 14, 15, 16, and 17). The
results of this experiment will help us understand how the method is influenced
by the different zoom levels of the data (i.e. scale or level of detail), and whether
the method is more reliable at generating small-scale maps or it can be used for
large-scale maps in which the level of detail of building footprints is finer.
    With an understanding of the performance of the model across different zoom
levels, Experiment 3 applies GANmapper to 9 different cities to investigate its
scalability and versatility. These 9 cities are from around the world, representing
different urban forms: Beijing, Jakarta, Los Angeles, London, Munich, New
York, Paris, Singapore, and Tokyo. The results will be compared across cities to
assess the performance and robustness of our model in different morphological
conditions around the world.
    Finally, Experiment 4 investigates the quality of the generated data when
the constituent tiles are stitched back together by the post-processing pipeline.

   1
     https://www.ura.gov.sg/Corporate/Planning/Master-Plan; last accessed on 28
July 2021.
                                         10
We chose one region each in 4 different cities (Singapore, Jakarta, Paris, Los
Angeles) to assess the spatial consistency of the assembled regions.
In all the four experiments, the model is trained with a train-test split of
80%/20% and the size of the dataset is recorded in each subsection.
3.6. Metrics for evaluation
Frechet Inception Distance (FID) proposed by Heusel et al. (2017) is one of
the most commonly adapted benchmarks for GAN performance. FID assesses
the quality of images created by a generative model by calculating the distance
between the feature vectors of real and generated images that are computed using
an Inception-v3 (Szegedy et al., 2016) image classification model. A lower FID
score indicates that the two groups of images are more similar in terms of the ex-
tracted feature vectors with a perfect score of 0.0 indicating that the two groups
are identical. Visually, a lower FID score on the generated images tends to cor-
relate well with realistic-looking images, indicating more morphological correct
representations in terms of the general shape, size and density of the generated
building footprints. Mathematically, FID can be expressed with the following
formula:
X X qX X
2
FID = µr − µg + T r( r + g−2 r g)
where Xr ∼ N(µr , r) and Xg ∼ N(µg , g) are the 2048-dimensional activations
P P
of the Inception-v3 pool3 layer for real and generated samples respectively.
In addition to FID, the Mean Intersection over Union (mIoU) between the in-
puts and generated images is also calculated in some experiments to measure the
degree of overlap of the generated images to the ground truth. Mathematically,
mIoU measures the number of pixels common between the input and generated
images divided by the total number of pixels present across both datasets.
A high mIoU score indicates that the generated images overlaps with the
input more and thus replicates the input data better. However, due to the gener-
ative nature of GANs, the generated results should look realistic in terms of the
overall building morphology but not overlap exactly with the input image. If the
generated image has a high mIoU score (close to 1), we can conclude that the
generator is overfitted to the training data which impedes the models’ ability to
generalise its learned patterns to new inputs.
3.7. Implementation
The model is implemented with Pytorch (Paszke et al., 2019), and QGIS
is used in data processing. We release GANmapper as open-source software.
11Further, in the repository, we also include the pre-processing and post-processing
pipelines, which may aid other researchers to extend the work.
4. Results and evaluation
4.1. Experiment 1 — Finding the best input configuration
In Experiment 1, we explore two different types of inputs: street networks
and land use parcels to assess their suitability for the building footprint genera-
tion.
As mentioned in Section 3.4, the street network inputs are generated from
different types of roads in a city. The primary roads are usually highways or
expressways that connect different districts; the secondary roads are usually av-
enues that connect neighbourhoods, and often demarcate the boundaries of one
neighbourhood to another; the tertiary roads are capillaries that penetrate the
neighbourhoods. Such street network maps are often used to classify urban mor-
phologies and inform the urban granularity and density of an area.
On the other hand, the land-use map of Singapore used in this experiment
only offers road network information until the secondary level. Tertiary capil-
laries are replaced by colour-coded land-use parcels that demarcate the building
type and their gross floor area ratio (GFA). These two factors play a significant
role in affecting the eventual building footprint in the parcel. For example, a
large parcel of land for residential use with a low GFA limit will often result in
small, scattered houses whereas a smaller parcel of land with the same GFA limit
could become a high-rise development.
Figure 5 shows a sample of the results from the two types of inputs. Re-
sults from the original pix2pix model architecture (Isola et al., 2017) using a
U-net (Ronneberger et al., 2015) generator architecture is also included as a
baseline. From the figure, we see that the GANmapper architecture generates
more realistic-looking images with sharper building footprint edges and better
reproduction of the ground truth’s urban texture compared to the pix2pix base-
line, affirming the importance of developing an approach tailored for geographic
information.
In both models, the street network input returns better visual performance
compared to the land-use map input. This difference is likely due to the fact that
the model is not yet able to extract representative features for each type of land-
use parcel. It is also possible that the colour mappings do not provide sufficient
information to the model on the building morphology. For example, the green
parcels representing residential areas could be both landed houses or elongated
12Figure 5: Results of using different input types: street network vs landuse maps, together with a
comparison with a baseline Conditional GAN (pix2pix), which our custom model outperforms.
The input (open) data in this example is courtesy of OpenStreetMap and the Urban Redevelop-
ment Authority of Singapore.
apartment blocks, causing confusion in the case of the generated image of Land-
use Map in Study Area 2.
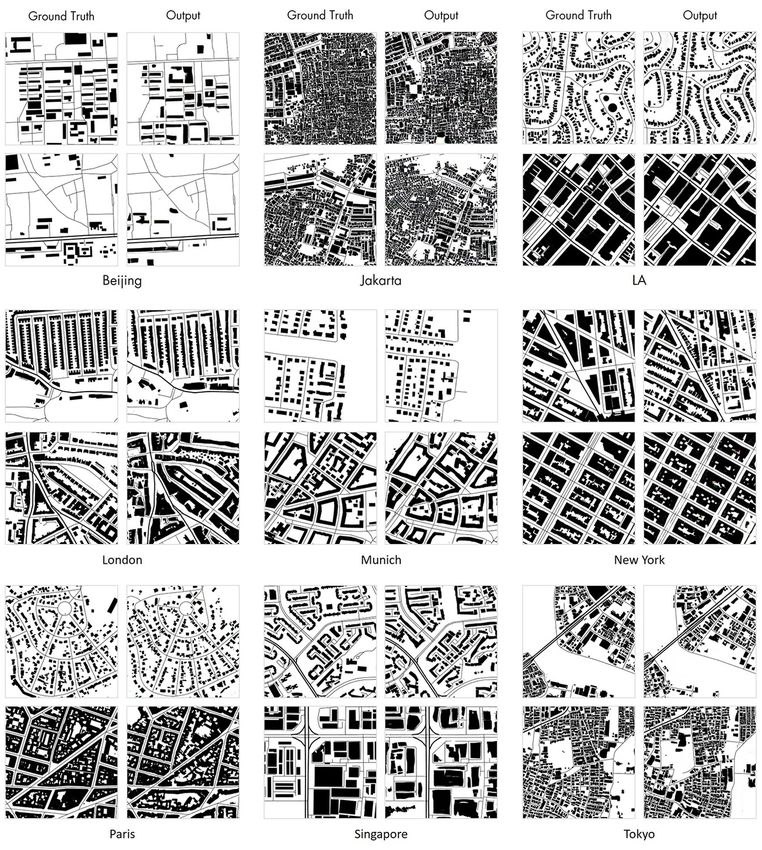
However, the Black-and-White street network is not without flaws either.
Figure 6 (on the left) shows the presence of artifacts in a sample of generated
images from the Black-and-White (B/W) input. The appearance of artifacts such
as the ones highlighted in the figure is generally due to the over-fitting of the
generator and confusion of the discriminator having too little information to dif-
ferentiate the real from the fake images.
This problem can be ameliorated by using Coloured Road Hierarchy Dia-
grams (CRHD) proposed by Chen et al. (2021b). CRHDs adds colour to dif-
ferentiate hierarchies in the road network on top of using road thickness. The
addition of colour creates 3-channel images which provide additional informa-
tion to the input to avoid over-fitting of the generator under the same training
13Figure 6: CRHD inputs minimise checkerboard artifacts highlighted in red boxes, which are
typical in GAN outputs.
settings. As seen in the Figure 6, outputs using CRHDs do not experience ar-
tifacts in vacant areas. Therefore, in the continuation of the work, we opt for
images of street networks that signify the types of roads using colours. Such im-
ages are fairly easy to generate and the data on the road type is widely available,
providing a substantial advantage over their B/W counterparts.
Comparing the average performance of the three types of inputs over all im-
ages in the test set with FID and mIoU score (Table 1), CRHD input style returns
the lowest FID score for our model architecture. A lower FID score indicates that
the extracted feature vectors of the generated images match with the extracted
feature of the ground-truth images more closely, resulting in more realistic and
ground-truth look-a-like images. This is resonant with the higher visual real-
ism compared to land-use maps in Figure 5 and the removal of checker-board
artifacts in Figure 6.
Looking at mIoU score that measures how close the generated pixels overlaps
the ground truth, pix2pix with B/W street input performs the best with a score of
14Table 1: FID Scores based on input types.
Input Style FID mIOU
pix2pix Ours pix2pix Ours
Roads (B/W) 131.8 104.4 0.565 0.420
Roads (CRHD) 134.0 98.3 0.455 0.484
Land use 216.2 243.4 0.497 0.457
0.565, while the highest score obtained by our model is 0.484 with CRHD input.
The low value for mIoU score is expected as the loss function of GANmapper
measures the real/fake in terms of visual similarities rather than pixel-wise simi-
larity. This difference means that although the generated image could have high
FID score with stylistically similar urban grain and density to the ground truth,
the generated footprints might not overlap the ground truths footprint closely.
4.2. Experiment 2 — Understanding the effect of tile scaling
As elaborated in Section 3.3, large areas need to be sliced into tiles for pre-
diction. Without expanding or contracting a study area, the scale of the tiles
or ‘zoom levels’ according to slippymap’s convention would affect the resultant
size of the dataset. For example, a fixed area of 1 kilometre square will produce
4 images (each tile will have a width of 500m) and 16 images at a finer scale
( 250m per tile).
Another factor that needs to be considered is the resolution of the input im-
ages. At 256x256 px resolution, fitting too large an area could result in loss
of information. Therefore, we need to experiment the ideal combination of the
spatial extent, and consequently, the level of detail.
To investigate the performance of the methodology under different scales, we
conduct training on 4 different datasets at the slippymap zoom level of 14, 15,
16, and 17 with CRHDs. Table 2 tabulates the scores and training sizes of the
different zoom levels in the same area and Figure 7 shows the different scales
of the levels and the quality of the generated outputs. The same figure also
illustrates the size of the spatial extent of each level.
Examining both FID scores and visual samples, higher zoom levels (16, 17)
performs graphically better than lower zoom levels (14, 15) with sharp footprints
and more accurate urban texture. The model trained on zoom level 17 achieved
the lowest FID score with morphologically correct and compelling looking build-
ing footprints. Conversely, the model trained on zoom level 14 had the worst FID
score and struggles more in producing polygon-like footprints. Nevertheless, it
15Figure 7: Four different zoom levels according to tiling conventions are explored in the exper-
iment. The values in metres indicate the width/height of each tile, suggesting the scale of each
tile at its specific zoom level.
still manages to be morphologically truthful and produces a similar urban texture
as the ground truth.
The reason for the difference in performance is probably due to both the
training size and the density of information in a tile. From the entire map of Sin-
gapore, 2,825 training images were generated at zoom level 17 while the same
region could only produce 150 images at zoom level 14 which is one order of
magnitude smaller. As with other GANs, a small number of training data could
result in over-fitting or unstable training, thus leading to worse performance. Fur-
thermore, at lower zoom levels such as 15 and below, the 256x256 resolution of
the input-output pair struggles to present the information in high fidelity. This is
especially poignant in zoom level 14 where the ground-truth building footprints
start to get ‘blurry’ and the hierarchical relationships between roads and building
footprints such as the thickness of the road and the street offset demarcated by
the blank spaces starts to become too small to be important.
Although zoom 17 performs best in terms of FID score and visual sharpness,
it misses out on contextual information such as the second example of zoom level
17 in Figure 7. In the example, the ground-truth shows a part of a large build-
ing footprint while the generated image returned smaller buildings instead as it
16Table 2: FID Scores by zoom level.
Zoom Scale Training B/W CRHD B/W CRHD
(tile width) Size FID (Test) FID (Test) FID (Full) FID (Full)
14 2,000m 150 123.56 137.32 72.45 80.74
15 1,000m 394 133.01 108.26 75.56 52.39
16 500m 864 83.73 77.87 42.20 38.52
17 300m 2825 63.23 52.65 38.14 24.41
generates the image solely based on the information of the input but not the sur-
rounding tiles. This lack of contextual information could create inaccuracies in
areas with large buildings when the tiles are stitched together which is explored
in the next subsection.
Therefore, the zoom level-accuracy trade-off needs to be considered for each
city. In a city with large building footprints, lower zoom levels such as 15 or
16 are preferred to retain contextual information while cities with smaller grains
could still use zoom level 17 for its high visual realism.
4.3. Experiment 3 — Applying GANmapper to multiple cities
So far, the experimental portion of this work focuses on one study area. In
this experiment, we test our model’s flexibility on a mixture of cities with dif-
ferent urban morphologies and urban textures, to understand how the approach
scales elsewhere. Eight additional cities are chosen and each city’s data is con-
verted into CRHD datasets with zoom level 16 which offers a balance between
training size and quality of prediction according to Experiment 2. Due to varia-
tions in urban areas, the size of the datasets varies from city to city. Furthermore,
ground-truths that contain no building or a very small number of buildings are
removed to avoid learning from incomplete areas.
Table 3 records the FID scores of the test sets for the selected cities and
Figure 8 shows the sample results of the test sets against the ground-truths. We
observe that the FID score varies across cities. Beijing had the least correct score
of 172.3 while Los Angeles had the best score of 54.35.
Visually inspecting the sample results, the model is able to capture the dom-
inant urban textures such as the small-grained settlements in Jakarta, the mean-
dering suburbs of Los Angeles, and the gridiron streets of New York. Building
footprints, especially those of smaller buildings, are generated as polygons with
sharp corners and a certain degree of randomness which enhances the realism of
the generated images. The model struggles a little in generating larger footprints.
The bigger buildings in Singapore and LA have rounded corners and fuzzier
17Figure 8: Synthetic results of GANmapper, together with the reference data, across several di-
verse cities around the world at zoom level 16.
edges that the smaller footprints, and the courtyards of New York’s townhouses
also suffer from fuzziness. Nevertheless, in almost all cases, the model respects
the roads so there are no overlaps: it is able to learn the appropriate road offsets
for each city, and understand the effect of different road hierarchies on the offset
and size of the footprints.
18Table 3: FID scores by city.
City Training Size FID (Test)
Beijing 832 172.28
Jakarta 620 122.25
Los Angeles 1410 54.35
London 2147 67.15
Munich 803 68.10
New York 1378 66.69
Paris 2762 62.80
Singapore 864 77.87
Tokyo 1323 72.81
Average 85.11
The model is also able to infer different densities of the footprints accord-
ing to the input. In the bottom example of Beijing (top left of Figure 8), the
model creates a sparse image even though the road network seems to suggest
a neighbourhood-like density and in examples of LA, Paris and Singapore, the
model is able to detect subtle morphological differences in the road networks
and accurately produce the corresponding building typology and density from
the inputs.
4.4. Experiment 4 — Investigating spatial consistency of the stitched outputs
So far, FID scores and visual inspections are conducted on the tile level, and
they have demonstrated promising performance. To evaluate the practicality of
the model, it is essential to understand its performance when the tiles are stitched
together into a larger urban area. In this experiment, we selected 3 disparate
models from Experiment 3, Jakarta (FID = 122.25), Los Angeles (FID = 54.35)
and Singapore (FID = 77.87) to evaluate the generated outputs against the ground
truth after the individual tiles are stitched together.
Figure 9 presents the ground truth-output pairs of Jakarta, Los Angeles and
Singapore. All pairs capture an area of approximately 2.5km2 and are stitched
together from 16 to 25 tiles. Generally, we can observe in the stitched outputs a
good reproduction of the correct urban texture in terms of the shape, orientation,
density and area of the building footprints.
The test area in Jakarta is selected to represent an area with ultra-dense urban
sprawl. The overall structure of the urban form is defined by the primary and
secondary roads but the tertiary roads are much more chaotic. We see that the
model is able to discern the difference in setbacks between tertiary roads and
19Figure 9: The stitched output of Jakarta, Los Angeles, and Singapore.
20secondary roads where the settlements are much closer to the tertiary road than
those close to the secondary roads. In addition, the model correctly depicts the
typology of the area in the east where a curved, river-like void space exists and
the blocks generated are much more regular than the rest of the area.
The test area in LA is chosen to be at an intersection of the urban sprawl and
downtown, separated by a highway. We see that the model is able to generate
two different typologies on each side of the central highway. The downtown
area generally consists of large commercial buildings that occupy an entire street
block whereas the residential area up in the north is filled with Single-Family
Houses (SFH) typically seen in the LA urban sprawl.
In Singapore, the test area is a typical public housing town with an amenity
node surrounded by long, slab high-rise apartment blocks. The model is able
to infer a correct representation of the residential block texture in the area but
fails to generate the larger footprints of the amenity buildings at the centre of the
neighbourhood. This limitation could be due to the fact that the street morphol-
ogy near the amenity blocks does not deviate from the rest of the neighbourhood,
thus leading the model to generate these high-rise residential buildings rather
than shopping malls. On the other hand, looking at the top portion and bottom
left of the output where the generated footprints are larger and wider, we can
conclude that the model is still able to generate typologies other than residential
blocks when the street morphology changes.
4.5. Discussions and limitations
From the examples shown in the previous sections, it is clear that our model
is able to produce realistic urban texture and building footprints in a variety of
urban morphologies and zoom levels. The GAN model is able to learn the ap-
propriate sizes and shapes of building footprints and generate clean polygons,
especially at higher zoom levels. The model is also able to learn the offsets of
buildings with the street and also represent the offsets between the footprints
realistically. When stitched together, the individual images are able to form con-
tinuous urban fabrics that highly represents the ground truth. Such promising
performance paves the way for practical uses in generating synthetic data in un-
mapped areas, and may motivate the development of new applications of GAN
in GIScience.
That been said, there are few limitations in the methodology that could affect
the consistency and the contiguity of the predicted urban texture when the tiles
are stitched together. Figure 10 exhibits some examples of cases of the model
that can be deemed as failed predictions. At zoom 16, tertiary capillaries seem
to be the dominant factor in creating the generated footprints. Tiles with detailed
21Figure 10: Example of cases with inferior performance.
road networks often return more compelling results. This effect can be seen in
the failure case in Beijing where the road network has provided too little con-
textual information and resulted in an unsuccessful prediction. The lack of a
detailed tertiary road network is a prevalent issue in the Beijing dataset which
also explains Beijing’s lower performance according to the FID score. It is pos-
sible that tertiary roads were not mapped completely in Beijing at the time of
writing, causing some areas to suffer from the lack of information, but also indi-
cating that our work, as it is the case with any other AI technique, is sensitive to
the quality of input data.
This error due to lack of information could be reduced by using a lower zoom
level such as zoom level 15 which increases the density of information of each
tile. Still, it is not recommended to train the model in an area that has incomplete
street or footprint data as the model could only be as good as the dataset is.
Jakarta comes second last in terms of FID score at 122.3 due to large varia-
tions in urban texture in some tiles. In the failed example of a setting in Jakarta,
we observe larger buildings being surrounded by smaller, informal settlements.
This occurs for many tiles and is a unique characteristic of Jakarta. The model
struggles in these areas by returning smaller settlements or vacant areas instead
of the larger building footprints as shown in the ground truth. In contrast to Bei-
jing, which requires more information per tile, the extremely fine urban grain in
Jakarta could benefit from a larger zoom level such as 17 so that each tile would
22contain more uniform typologies for interpretation.
In other cities such as New York, LA, Paris and London, there are cases
where the model lacks contextual information and produces the inaccurate urban
typology from the ground truth. For example, the ground truth in the Paris sam-
ple is a suburban area while the model has produced a Haussmann-like typology
typically found in Paris. Also, in the sample for New York, the model had gen-
erated a landed-house typology whereas the ground truth is in fact a Townhouse
typology. This problem is probably caused by the similarity of the street network
at the specific zoom level for the different typologies in the training set. In the
above-mentioned cases, the road networks outside of the City of Paris are simi-
larly laid out as those outside of Paris while those in Uptown Manhattan are also
similar to Midtown Manhattan, causing confusion in the generated typologies.
Figure 11: Stitched output of Paris, compared with different scales for the same area, reasserting
the influence of the zoom level on the performance of the method.
As mentioned in Section 7, lower zoom levels capture more contextual data
that helps the model to infer the correct urban typology. Thus, choosing the
correct zoom level could solve the confusion between different typologies ef-
fectively. Figure 11 shows that the problem of typology confusion or spatial
inconsistency is prominent in Paris at zoom level 16. Most of the generated tiles
are of lower density rather than the dense, courtyard-like typology in the ground
truth. Using a lower zoom level of 15, the contiguity problem is improved sig-
nificantly with most tiles correctly showing the proper density and texture as the
ground truth.
As the successful cases in Figure 9 had shown, the problem in texture conti-
guity is dependent on specific urban morphologies. While zoom level 16 works
well in some cities, cities like Paris requires at least zoom level 15 as its footprint
typology contrasts sharply between the City of Paris and the Greater Paris area
while the street networks remain similar.
23Another approach to this problem is to train different models to generate the
desired urban texture. For example, if the output area is within the City of Paris,
a model trained only with tiles within the City of Paris would perform better than
a model trained on the entire Paris metropolitan area.
It is also important to note that the training dataset is sourced from OSM
which is a volunteered geospatial dataset with heterogeneous quality. While the
quality is generally good, OSM contributors across the world may have different
approaches in mapping buildings (e.g. level of detail and definition of buildings).
Therefore, it remains to be investigated how different mapping approaches might
have an impact on the training process
We have demonstrated that a properly configured GANmapper is able to learn
the predominant urban texture of a city and generate realistic and morphologi-
cally correct urban pattern in a previously unseen area in the city or another
city that has a similar urban form. As long as the limitations are considered,
our method opens up practical uses in generating synthetic data for a variety of
applications.
According to Barrington-Leigh and Millard-Ball (2017), more than 80% of
the roads in the world are mapped in OSM (with presumably further develop-
ments since their study was conducted), whereas footprints are much less com-
plete. This approach provides an opportunity to train a model from an area that
is fully mapped in both street network and building footprints, and transfer the
learned patterns onto an area that has street networks but missing footprint data.
It is also beneficial for locations that already have building footprints mapped,
but partially, having our method to supplement them and help reach full com-
pleteness. Obviously, our method cannot be used to predict the exact size and
shape of each building, e.g. the generated cannot be used for cadastral purposes,
but it is quite accurate to generate the urban form. Such datasets may be found
useful by researchers at the urban scale, e.g. in urban climate and urban mor-
phology.
Urban planners could also use a few models trained in different cities to
rapidly visualise how different a city could look like using different models on a
target area. In addition, growth simulations of a city can also be conducted with
our method. By providing the intended new road networks, building footprints
that fit into the existing urban fabric could be generated quickly without manual
visualisations.
245. Conclusion
Generative adversarial networks have been seldom applied in use cases with
geographic information so far. In this paper, we take GAN to new heights in GI-
Science, by introducing a new application: geographical content filling. Lever-
aging on their relationship, our contribution uses more commonly found and
coarse geospatial data (land use and road network) to predict less common fea-
tures at the finer scale (building footprints) without data and measurements on
them (e.g. satellite imagery or land surveying). We hope that this new appli-
cation of GAN with geospatial data, inherently introducing a new approach for
mapping, may catalyse further investigations how can GAN be leveraged in GI-
Science.
As mapping features such as building footprints continue to be complex and
time-consuming, they remain unmapped in much of the world. We postulate that
GANmapper could be used as a solution to create datasets that approximately
reveal the urban form, which despite the synthetic nature of the data, may be
found valuable by various use cases such as population estimation, urban mor-
phology, energy, and climate simulations (Xu et al., 2017; Wang et al., 2017;
Yuan et al., 2019; Wang et al., 2020; Fleischmann et al., 2021; Barbour et al.,
2019; Schug et al., 2021; Shang et al., 2021). For many of these applications, the
exact geometry of each building is not essential, and such applications benefit
from aggregated building data (e.g. total area covered by buildings), which our
approach accomplishes well.
We believe that other geographic information can be synthesised as well, as
our experiments suggest that using land-use maps as input produces respectable
results as well. Further, we believe that our content filling approach may be
used to enhance the level of detail of existing datasets. For example, generating
tertiary road networks may be possible given primary and secondary road net-
works as input. The foreseeable challenge is in vectorization and scaling up in
resolution.
Among other applications, we anticipate that data derived with GANmapper
may serve as reference data for quality checks. For example, it may be used to
detect missing buildings/built-up areas in datasets such as OpenStreetMap. For
future work, we plan to explore such use cases, but also enhance the prediction
workflow. For example, we plan to develop certain rules that would help cleaning
or post-processing the data in tandem with GAN, such as removing buildings
from locations where they are unlikely to be found (e.g. inside a roundabout).
25Data and Codes Availability Statement
The data and code that support the findings of this study are available on
Github at https://github.com/ualsg/GANmapper.
Acknowledgements
We gratefully acknowledge the input data used in this research. We thank the
members of the NUS Urban Analytics Lab for the discussions. This research is
part of the project Large-scale 3D Geospatial Data for Urban Analytics, which
is supported by the National University of Singapore under the Start Up Grant
R-295-000-171-133.
Notes on contributors
Abraham Noah Wu is a research assistant at the National University of Sin-
gapore. He holds a Master Degree in Architecture from the National University
of Singapore.
Filip Biljecki is an assistant professor at the National University of Singa-
pore. He holds a PhD degree in 3D GIS from the Delft University of Technology
in the Netherlands.
References
Abady, L., Barni, M., Garzelli, A., Tondi, B., 2020. GAN generation of synthetic multispectral
satellite images, in: Bruzzone, L., Bovolo, F., Santi, E. (Eds.), Image and Signal Processing
for Remote Sensing XXVI, International Society for Optics and Photonics. SPIE. pp. 122 –
133. URL: https://doi.org/10.1117/12.2575765, doi:10.1117/12.2575765.
Anderson, J., Sarkar, D., Palen, L., 2019. Corporate Editors in the Evolving Landscape of
OpenStreetMap. ISPRS International Journal of Geo-Information 8, 232. doi:10.3390/
ijgi8050232.
Baier, G., Deschemps, A., Schmitt, M., Yokoya, N., 2021. Synthesizing optical and SAR imagery
from land cover maps and auxiliary raster data. IEEE Transactions on Geoscience and Remote
Sensing , 1–12doi:10.1109/tgrs.2021.3068532.
Barbour, E., Davila, C.C., Gupta, S., Reinhart, C., Kaur, J., González, M.C., 2019. Planning for
sustainable cities by estimating building occupancy with mobile phones. Nature Communi-
cations 10, 3736. doi:10.1038/s41467-019-11685-w.
Barrington-Leigh, C., Millard-Ball, A., 2017. The world’s open-source street map is more than
80% complete. PLoS One 12, 1–20.
Beaulieu-Jones, B.K., Wu, Z.S., Williams, C., Lee, R., Bhavnani, S.P., Byrd, J.B., Greene, C.S.,
2019. Privacy-preserving generative deep neural networks support clinical data sharing. Cir-
culation: Cardiovascular Quality and Outcomes 12, e005122.
26Biljecki, F., 2020. Exploration of open data in Southeast Asia to generate 3D building models.
ISPRS Annals of Photogrammetry, Remote Sensing and Spatial Information Sciences VI-
4/W1-2020, 37–44. doi:10.5194/isprs-annals-vi-4-w1-2020-37-2020.
Biljecki, F., Chew, L.Z.X., Milojevic-Dupont, N., Creutzig, F., 2021. Open government geospa-
tial data on buildings for planning sustainable and resilient cities. arXiv:2107.04023.
Boeing, G., 2021. Street Network Models and Indicators for Every Urban Area in the World.
Geographical Analysis doi:10.1111/gean.12281.
Botta, F., Gutiérrez-Roig, M., 2021. Modelling urban vibrancy with mobile phone and Open-
StreetMap data. PLOS ONE 16, e0252015. doi:10.1371/journal.pone.0252015.
Bowles, C., Gunn, R., Hammers, A., Rueckert, D., 2018. Gansfer learning: Combining labelled
and unlabelled data for gan based data augmentation. arXiv preprint arXiv:1811.10669 .
Bright, J., Sabbata, S.D., Lee, S., Ganesh, B., Humphreys, D.K., 2018. OpenStreetMap data for
alcohol research: Reliability assessment and quality indicators. Health & Place 50, 130–136.
doi:10.1016/j.healthplace.2018.01.009.
Brock, A., Donahue, J., Simonyan, K., 2018. Large scale gan training for high fidelity natural
image synthesis. arXiv preprint arXiv:1809.11096 .
Brovelli, M.A., Minghini, M., Molinari, M., Mooney, P., 2016. Towards an automated compar-
ison of OpenStreetMap with authoritative road datasets. Transactions in GIS 21, 191–206.
doi:10.1111/tgis.12182.
Bshouty, E., Shafir, A., Dalyot, S., 2019. Towards the generation of 3D OpenStreetMap building
models from single contributed photographs. Computers, Environment and Urban Systems ,
101421doi:10.1016/j.compenvurbsys.2019.101421.
Calafiore, A., Palmer, G., Comber, S., Arribas-Bel, D., Singleton, A., 2021. A geographic
data science framework for the functional and contextual analysis of human dynamics within
global cities. Computers, Environment and Urban Systems 85, 101539. doi:10.1016/j.
compenvurbsys.2020.101539.
Chen, J., Stouffs, R., Biljecki, F., 2021a. Hierarchical (Multi-Label) Architectural Image Recog-
nition and Classification, in: Proceedings of the 26th International Conference of the Asso-
ciation for Computer-Aided Architectural Design Research in Asia (CAADRIA) 2021, pp.
161–170.
Chen, T.H.K., Qiu, C., Schmitt, M., Zhu, X.X., Sabel, C.E., Prishchepov, A.V., 2020. Mapping
horizontal and vertical urban densification in Denmark with Landsat time-series from 1985
to 2018: A semantic segmentation solution. Remote Sensing of Environment 251, 112096.
doi:10.1016/j.rse.2020.112096.
Chen, W., Wu, A.N., Biljecki, F., 2021b. Classification of urban morphology with deep learning:
Application on urban vitality. arXiv preprint arXiv:2105.09908 .
Chen, X., Mishra, N., Rohaninejad, M., Abbeel, P., 2018. PixelSNAIL: An improved autore-
gressive generative model, in: Dy, J., Krause, A. (Eds.), Proceedings of the 35th International
Conference on Machine Learning, PMLR. pp. 864–872.
Courtial, A., Touya, G., Zhang, X., 2021. Generative adversarial networks to generalise ur-
ban areas in topographic maps. The International Archives of the Photogrammetry, Re-
mote Sensing and Spatial Information Sciences XLIII-B4-2021, 15–22. doi:10.5194/
isprs-archives-xliii-b4-2021-15-2021.
Döllner, J., 2020. Geospatial Artificial Intelligence: Potentials of Machine Learning for 3D Point
Clouds and Geospatial Digital Twins. PFG – Journal of Photogrammetry, Remote Sensing and
Geoinformation Science , 1 – 10doi:10.1007/s41064-020-00102-3.
27Engel, J., Agrawal, K.K., Chen, S., Gulrajani, I., Donahue, C., Roberts, A., 2019. Gansynth:
Adversarial neural audio synthesis. arXiv preprint arXiv:1902.08710 .
Esch, T., Heldens, W., Hirner, A., Keil, M., Marconcini, M., Roth, A., Zeidler, J., Dech, S.,
Strano, E., 2017. Breaking new ground in mapping human settlements from space – The
Global Urban Footprint. ISPRS Journal of Photogrammetry and Remote Sensing 134, 30–42.
doi:10.1016/j.isprsjprs.2017.10.012.
Fan, H., Kong, G., Zhang, C., 2021. An Interactive platform for low-cost 3D building modeling
from VGI data using convolutional neural network. Big Earth Data 5, 49–65. doi:10.1080/
20964471.2021.1886391.
Fan, H., Zipf, A., Fu, Q., Neis, P., 2014. Quality assessment for building footprints data on
OpenStreetMap. International Journal of Geographical Information Science 28, 700 – 719.
doi:10.1080/13658816.2013.867495.
Fleischmann, M., Feliciotti, A., Kerr, W., 2021. Evolution of Urban Patterns: Urban Morphology
as an Open Reproducible Data Science. Geographical Analysis doi:10.1111/gean.12302.
Fleischmann, M., Feliciotti, A., Romice, O., Porta, S., 2020. Morphological tessellation as
a way of partitioning space: Improving consistency in urban morphology at the plot scale.
Computers, Environment and Urban Systems 80, 101441. doi:10.1016/j.compenvurbsys.
2019.101441.
Frid-Adar, M., Klang, E., Amitai, M., Goldberger, J., Greenspan, H., 2018. Synthetic data aug-
mentation using gan for improved liver lesion classification, in: 2018 IEEE 15th international
symposium on biomedical imaging (ISBI 2018), IEEE. pp. 289–293.
Geis, C., Leichtle, T., Wurm, M., Pelizari, P.A., Standfus, I., Zhu, X.X., So, E., Siedentop,
S., Esch, T., Taubenbock, H., 2019. Large-Area Characterization of Urban Morphology—
Mapping of Built-Up Height and Density Using TanDEM-X and Sentinel-2 Data. IEEE Jour-
nal of Selected Topics in Applied Earth Observations and Remote Sensing 12, 2912–2927.
doi:10.1109/jstars.2019.2917755.
Goodfellow, I., Bengio, Y., Courville, A., 2016. Deep Learning. The MIT Press.
Goodfellow, I.J., Pouget-Abadie, J., Mirza, M., Xu, B., Warde-Farley, D., Ozair, S., Courville,
A., Bengio, Y., 2014. Generative adversarial networks. arXiv preprint arXiv:1406.2661 .
Han, Z.Y., Wang, J., Fan, H., Wang, L., Zhang, P., 2018. Unsupervised generative modeling
using matrix product states. Physical Review X 8, 031012.
Harig, O., Hecht, R., Burghardt, D., Meinel, G., 2021. Automatic delineation of urban growth
boundaries based on topographic data using germany as a case study. ISPRS International
Journal of Geo-Information 10, 353. doi:10.3390/ijgi10050353.
He, K., Zhang, X., Ren, S., Sun, J., 2016. Deep residual learning for image recognition, in:
Proceedings of the IEEE conference on computer vision and pattern recognition, pp. 770–
778.
Herfort, B., Lautenbach, S., Albuquerque, J.P.d., Anderson, J., Zipf, A., 2021. The evolution of
humanitarian mapping within the OpenStreetMap community. Scientific Reports 11, 3037.
doi:10.1038/s41598-021-82404-z.
Heusel, M., Ramsauer, H., Unterthiner, T., Nessler, B., Hochreiter, S., 2017. Gans trained by a
two time-scale update rule converge to a local nash equilibrium. Advances in neural informa-
tion processing systems 30.
Hinton, G.E., Salakhutdinov, R.R., 2006. Reducing the dimensionality of data with neural net-
works. science 313, 504–507.
Hochreiter, S., Schmidhuber, J., 1997. Long short-term memory. Neural computation 9, 1735–
28You can also read