Fossil fuel subsidies in Latin America and the Caribbean - José Eduardo Alatorre Economics of Climate Change Unit Sustainable Development and ...

Page created by Anne Bell
 
CONTINUE READING
Fossil fuel subsidies in Latin America and the Caribbean - José Eduardo Alatorre Economics of Climate Change Unit Sustainable Development and ...
Fossil fuel subsidies in
 Latin America and the Caribbean

September 2021

José Eduardo Alatorre
Economics of Climate Change Unit
Sustainable Development and Human Settlements Division
Economic Commission for Latin America and the Caribbean
Fossil fuel subsidies in Latin America and the Caribbean - José Eduardo Alatorre Economics of Climate Change Unit Sustainable Development and ...
Context: The dimensions of sustainable development

           Economic
  Economic structure               Economic
       Indebtedness                                           Environmental
  External constraint                                         Local and global pollution
       Energy matrix
                                   Sustainable
                                  development
                Social                        Environmental
                         Social
        Health; public
         expenditure
Fossil fuel subsidies in Latin America and the Caribbean - José Eduardo Alatorre Economics of Climate Change Unit Sustainable Development and ...
Climate change: We are not on the right track
Fossil fuel subsidies in Latin America and the Caribbean - José Eduardo Alatorre Economics of Climate Change Unit Sustainable Development and ...
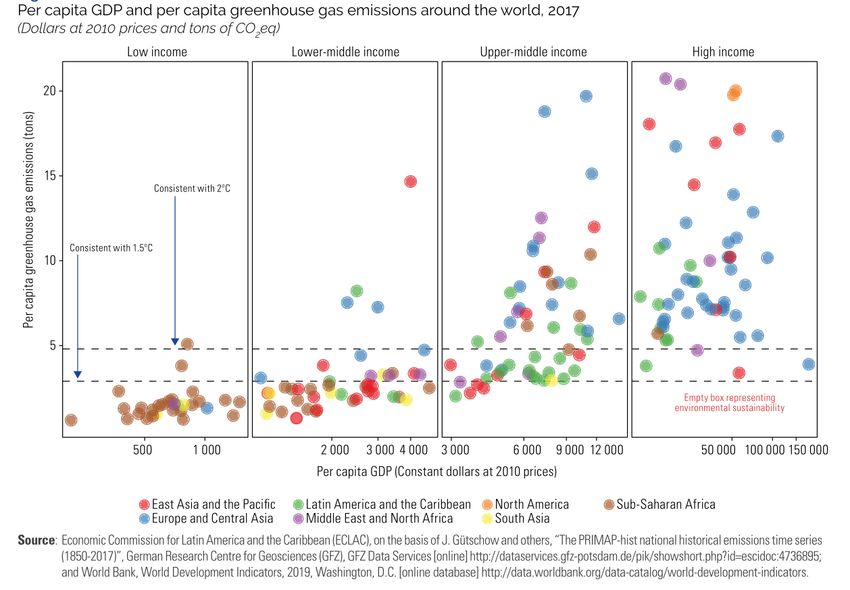
56% of emissions in LAC are emissions from energy use. 75% in the
Caribbean
                              LAC, Final energy consumption by sector, 2018
                                               (Percentage)

 Source: Own elaboration with data from IEA.
Fossil fuel subsidies in Latin America and the Caribbean - José Eduardo Alatorre Economics of Climate Change Unit Sustainable Development and ...
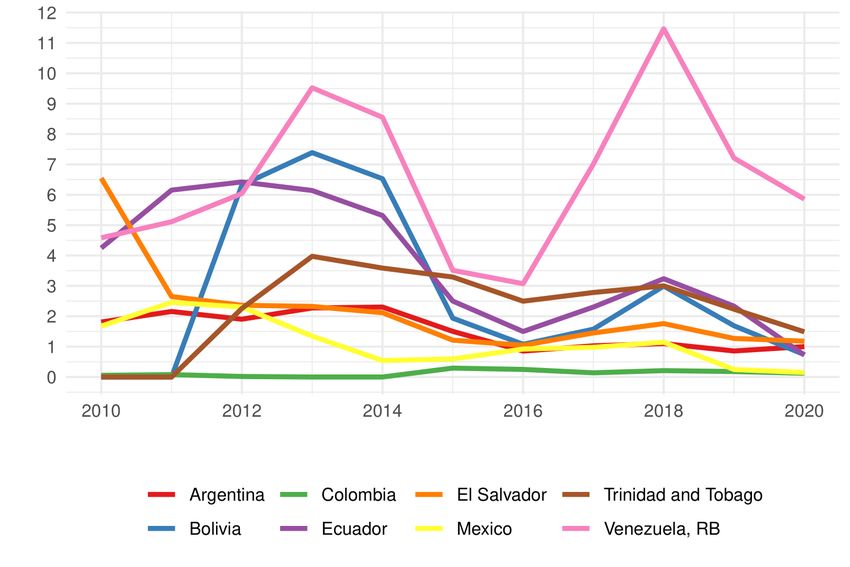
Car ownership is growing faster than the population and the economy

                                           Population, GDP and number of vehicles: Average
                                                     annual growth: 2005 - 2015
                                                                (%)
8
7
6
5
4
3
2
1
0

                                                                  Población         PIB       Número de vehículos

      Source: Comisión Económica para América Latina y el Caribe (CEPAL), sobre la base de información de Organización Internacional de Constructores de Automóviles (OICA) y Banco Mundial,
      World Development Indicators.
Fossil fuel subsidies in Latin America and the Caribbean - José Eduardo Alatorre Economics of Climate Change Unit Sustainable Development and ...
Consumption has a detrimental effect on human health
and welfare

                        Source: A. Bárcena y otros, La emergencia del cambio climático en América Latina y el Caribe: ¿seguimos
                        esperando la catástrofe o pasamos a la acción?, Libros de la CEPAL, N°160 (LC/PUB.2019/23-P), Santiago,
                        Comisión Económica para América Latina y el Caribe (CEPAL), 2020.
Fossil fuel subsidies in Latin America and the Caribbean - José Eduardo Alatorre Economics of Climate Change Unit Sustainable Development and ...
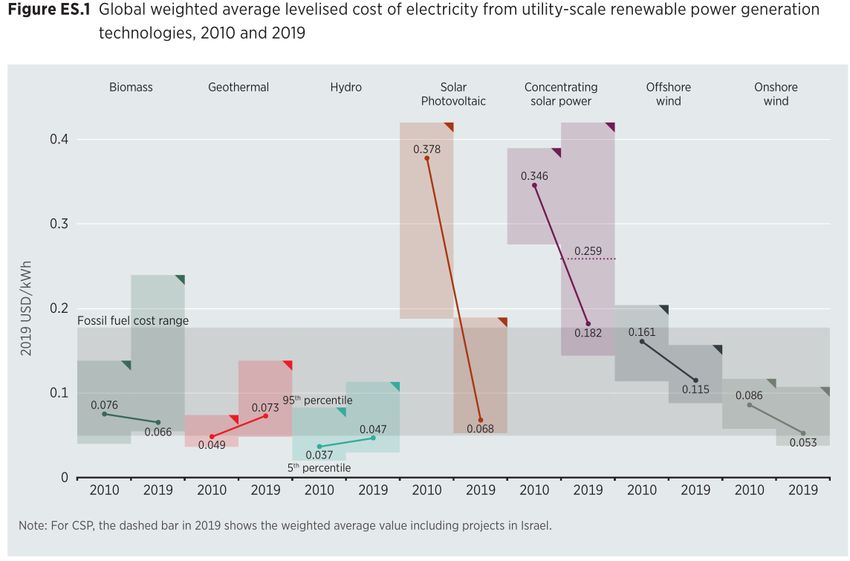
On average, LAC tax revenue is lower, and our social policy is less
      effective in reducing inequality.
                 Tax revenue (% of GDP), 2018.
         (Total tax revenues as a percentage of GDP)
               Cuba                                                                                42.3
     Promedio OCDE¹                                                                  34.3                       Gini coefficient pre and post taxes and transfers, 2017 or latest
           Barbados                                                                 33.1
               Brasil                                                               33.1                                                 available year.
               Belice                                                        29.7
            Uruguay                                                         29.2
           Argentina                                                        28.8
             Jamaica                                                      27.8
             Guyana                                                       27.4
              Bolivia                                                25.4
   Trinidad y Tobago                                               24.2
          Costa Rica                                               24.0
      Promedio ALC²                                              23.1
          Nicaragua                                              23.0
           Honduras                                           22.3
          El Salvador                                       21.1
                Chile                                       21.1
            Ecuador                                         20.6
         Santa Lucía                                      20.0
           Colombia                                       19.4
           Bahamas                                   17.6
                Perú                               16.4
             México                                16.1
            Panamá                            14.6
           Paraguay                          14.0
República Dominicana                        13.2                                                          OCDE et al. (2020), Estadísticas tributarias en América Latina y el Caribe 2020, OECD Publishing, Paris,
          Guatemala                        12.1                                                           https://doi.org/10.1787/68739b9b-en-es.
                        0.0   5.0   10.0   15.0     20.0         25.0     30.0     35.0     40.0   45.0
Subsidies benefit high income households...

              Argentina, Chile, Guatemala and Mexico: structure of direct consumption of fossil
                         fuels for transport (petrol, diesel and biodiesel), 2012–2016
                                                 (Percentages)
 70.0                                                                                                      65
 60.0

 50.0

 40.0
                                                                                                                                           32
 30.0                                26                                  28
                                                                    19                                                                19
 20.0                        16 18                             14                                     16                         14
                  9 11                                    11
                                                                                                                          8 10
 10.0       4 6
                7                               5 6 8                                             8                     6
        1 3                               1 3
                                              4
                                                                                    1 2 3 5                     1 2
                                                                                                                    3 5
                                                                              0 0 1
  0.0
        VII
        VIII

        VII
        VIII

        VII
        VIII

        VII
        VIII
         III

          V
           I

          X

         III

          V
           I

          X

         III

          V
           I

          X

         III

          V
           I

          X
         VI

         VI

         VI

         VI
         IV
          II

         IX

         IV
          II

         IX

         IV
          II

         IX

          II

         IV

         IX
        Argentina (ENGHO 2012 - 2013)         Chile (EPF 2016)                 Guatemala (Encovi, 2014)           Mexico (ENIGH 2016)

   Source: A. Bárcena y otros, La emergencia del cambio climático en América Latina y el Caribe: ¿seguimos esperando la catástrofe o pasamos a la
   acción?, Libros de la CEPAL, N°160 (LC/PUB.2019/23-P), Santiago, Comisión Económica para América Latina y el Caribe (CEPAL), 2020.
...and are expensive
LAC: Fossil fuel consumption subsidies, 2020        LAC: Fossil fuel consumption subsidies, 2010-2020
                  (% of GDP)                                             (% of GDP)

      Fuente: IEA Energy subsidies – Topics - IEA
Delays the adoption of renewables

 Fuente: IRENA (2020), Renewable Power Generation Costs in 2019, International Renewable Energy Agency, Abu Dhabi.; y Global Renewables
 Outlook
Concluding remarks

• There are environmental, social and economic reasons for reforming
  fossil fuel subsidy schemes.

• Subsidy schemes need to be reevaluated.

• Knowing the magnitude and destination of the subsidies allows us to
  assess their efficiency.
Fossil fuel subsidies in
 Latin America and the Caribbean

September 2021

José Eduardo Alatorre
Economics of Climate Change Unit
Sustainable Development and Human Settlements Division
Economic Commission for Latin America and the Caribbean
You can also read