Focal Ischemic Injury to the Early Neonatal Rat Brain Models Cognitive and Motor Deficits with Associated Histopathological Outcomes Relevant to ...
←
→
Page content transcription
If your browser does not render page correctly, please read the page content below
International Journal of
               Molecular Sciences

Article
Focal Ischemic Injury to the Early Neonatal Rat Brain Models
Cognitive and Motor Deficits with Associated Histopathological
Outcomes Relevant to Human Neonatal Brain Injury
Brett J. Kagan *,† , Charlotte M. Ermine, Stefano Frausin                       , Clare L. Parish, Jess Nithianantharajah
and Lachlan H. Thompson

                                          The Florey Institute of Neuroscience and Mental Health, University of Melbourne, Melbourne 3010, Australia;
                                          charlotte.ermine@florey.edu.au (C.M.E.); Stefano.Frausin@florey.edu.au (S.F.); clare.parish@florey.edu.au (C.L.P.);
                                          jess.nithianantharajah@florey.edu.au (J.N.); lachlant@unimelb.edu.au (L.H.T.)
                                          * Correspondence: brett@corticallabs.com
                                          † Present address: Cortical Labs, Level 6, 99 Commercial Rd, Melbourne 3004, Australia

                                          Abstract: Neonatal arterial ischemic stroke is one of the more severe birth complications. The injury
                                          can result in extensive neurological damage and is robustly associated with later diagnoses of cerebral
                                          palsy (CP). An important part of efforts to develop new therapies include the on-going refinement
                                          and understanding of animal models that capture relevant clinical features of neonatal brain injury
                                          leading to CP. The potent vasoconstrictor peptide, Endothelin-1 (ET-1), has previously been utilised
                                in animal models to reduce local blood flow to levels that mimic ischemic stroke. Our previous work

                                          in this area has shown that it is an effective and technically simple approach for modelling ischemic
Citation: Kagan, B.J.; Ermine, C.M.;      injury at very early neonatal ages, resulting in stable deficits in motor function. Here, we aimed to
Frausin, S.; Parish, C.L.;                extend this model to also examine the impact on cognitive function. We show that focal delivery of
Nithianantharajah, J.; Thompson, L.H.
                                          ET-1 to the cortex of Sprague Dawley rats on postnatal day 0 (P0) resulted in impaired learning in a
Focal Ischemic Injury to the Early
                                          touchscreen-based test of visual discrimination and correlated with important clinical features of CP
Neonatal Rat Brain Models Cognitive
                                          including damage to large white matter structures.
and Motor Deficits with Associated
Histopathological Outcomes Relevant
                                          Keywords: endothelin-1; cerebral palsy; neonatal stroke; white matter injury; pairwise discrimination;
to Human Neonatal Brain Injury. Int.
J. Mol. Sci. 2021, 22, 4740. https://
                                          touchscreen testing; rodent models
doi.org/10.3390/ijms22094740

Academic Editor: Alistair J. Gunn
                                          1. Introduction
Received: 11 March 2021                        Neonatal arterial ischemic stroke is one of the more serious complications of preterm
Accepted: 28 April 2021                   birth [1,2]. Survival rates for preterm infants have increased over time, correlating with an
Published: 29 April 2021
                                          increase in diagnoses of chronic neurological afflictions such as cerebral palsy (CP) [3–6].
                                          Although tissue damage affects both white and grey matter, it is the extent of white matter
Publisher’s Note: MDPI stays neutral      injury that has been identified as a critical indicator for CP, where greater damage predicts
with regard to jurisdictional claims in
                                          a less favourable prognosis [3,7–9]. There are very few effective treatment options for CP
published maps and institutional affil-
                                          and the need to identify new ones will require animal models that capture key clinical
iations.
                                          features at both histopathological and functional levels.
                                               The most widely used approaches to model neonatal brain injury in rodents are based
                                          on the protocol originally established by Rice and Vannucci [10] and typically involve
                                          some form of arterial occlusion followed by a period of hypoxia. While this approach has
Copyright: © 2021 by the authors.         been tremendously valuable for our understanding of the pathophysiology of early brain
Licensee MDPI, Basel, Switzerland.        injury, the procedures are technically demanding, often involve a level of mortality and
This article is an open access article
                                          high variability in pathological outcome. It is also a method that has been performed most
distributed under the terms and
                                          commonly in rodents around postnatal day 7–10 (P7–10), a time that approximates aspects
conditions of the Creative Commons
                                          of human brain development equivalent to near- and full-term infants [10–12]. However,
Attribution (CC BY) license (https://
                                          earlier neonatal rodent ages between P1 and P5 more closely match pre-term infants
creativecommons.org/licenses/by/
                                          based on key developmental hallmarks [13], but present additional technical challenges
4.0/).

Int. J. Mol. Sci. 2021, 22, 4740. https://doi.org/10.3390/ijms22094740                                              https://www.mdpi.com/journal/ijms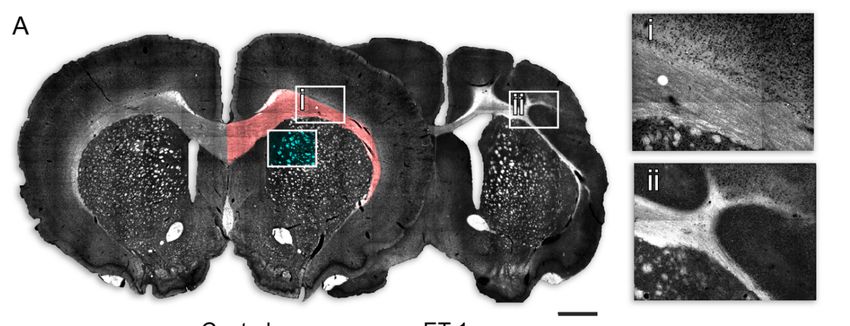
Int. J. Mol. Sci. 2021, 22, 4740                                                                                             2 of 15

                                   including this earlier neonatal period being more resistant to damage through conventional
                                   hypoxia-ischemia insults [14–16].
                                         Recently we reported that intracerebral injection of the potent vasoconstrictor peptide
                                   endothelin-1 (ET-1) as a technically simplified model for highly reproducible ischemic
                                   damage to the rat brain as early as P0 [17]. This resulted in a stable deficit in motor function
                                   persisting into adulthood, along with robust and consistent pathohistological damage
                                   characterized by cortical, striatal and subcortical white matter atrophy. Here, we aimed
                                   to further develop this model with a focus on assessing impaired cognitive function, a
                                   common clinical feature of pre-term brain damage [18].
                                         Compared to motor impairment, robust modelling of cognitive deficits following neona-
                                   tal brain injury in rodents has been less consistently described (for a review, see [19,20]), and
                                   has been dependent on the both the type of cognitive test applied and the model of injury.
                                   Our previous study showed that ischemic injury modelled by intra-cerebral injection of
                                   ET-1 into neonatal rats at P0 resulted in persistent motor impairment, but no cognitive
                                   deficits associated with recognition memory based on a test of novel object recognition [17].
                                   To further explore cognitive impacts in this model, here we used a test for associative
                                   learning and memory, the pairwise visual discrimination task using the Bussey–Saksida
                                   touchscreen operant system. This method of testing has been found to be highly sensitive
                                   to various disruptions, including stress, lesions, and pharmacological interventions [21–23].
                                   We report that ET-1 induced ischemia in the early (P0) neonatal rat brain models impor-
                                   tant features of pre-term clinical brain injury, including significant cognitive and motor
                                   impairments with underlying hemispheric atrophy and white matter damage.

                                   2. Results
                                   2.1. ET-1 Induced Neonatal Ischemia Results in Deficits in Motor Coordination
                                         Twelve weeks after neonatal delivery of ET-1 or saline, all animals were tested on the
                                   accelerating rotarod over 10 consecutive days. The results show that saline control animals
                                   improved over this period such that there was a progressive increase in latency to fall, with
                                   most animals reaching the test endpoint of 300 s without falling by day 10 (Figure 1A).
                                   Animals from the ET-1 group initially improved but plateaued at a significantly lower level
                                   of performance that did not improve beyond a latency to fall of approximately 170 s.
                                         A RM ANOVA was run to compare groups on rotarod latency to fall data (Figure 1A)
                                   over 10 days of testing. A significant interaction between time and group was found,
                                   F(9, 14) = 2.95, Wilks’ Lambda = 0.35, p = 0.034, ηp 2 = 0.66, Power = 0.80. The direction of
                                   this interaction was followed up focusing on the average latency to fall for both groups
                                   across the final three days of testing (Figure 1B) showed that ET-1-treated animals had a sig-
                                   nificantly impaired capacity to perform (t-test for average latency to fall across final 3 days
                                   of testing, Control group (266.33 s ± 25.68), ET-1 group (171.85 s ± 80.20), t(22) = 4.35,
                                   p = 0.006).
responses was greater in the ET-1 group when compared to the control group (Control =
295.86 trials ± 80.48; ET-1 = 384.41 trials ± 134.86; t(22) = 1.61, p = 0.122, Figure 1E), this was
not statistically different. However, analysis of the total number of correction trials (Figure
1F) showed that the ET-1 group (823.65 correction trials ± 295.74) performed significantly
Int. J. Mol. Sci. 2021, 22, 4740 more correction trials compared to the Control group (Control = 587.00 correction trials ±
3 of 15
127.22; ET-1 = 823.65 correction trials ± 295.74; t(22) = 2.74, p = 0.012). Collectively, these
data indicate that the ET-1 insult robustly impairs associative learning and memory.
Figure 1. Motor and cognitive changes following early neonatal ischemic injury. (A) At 18 weeks of age, latency to fall on
Figure 1. Motor and cognitive changes following early neonatal ischemic injury. (A) At 18 weeks of age, latency to fall on
the accelerating rotarod over 10 days shows that the control group improves with training to a significantly greater extent
the accelerating
compared rotarod over
to ET-1-treated 10 days(B)
animals. shows thatto
Latency the control
fall on thegroup
rotarodimproves with training
represented as averageto aperformance
significantly over
greater
theextent
last 3
compared
days shows tothe
ET-1-treated animals.
ET-1-treated animals(B) are
Latency to fall onimpaired.
significantly the rotarod (C)represented
Proportionas ofaverage
animalsperformance
reaching theover the last
criterion for3learn-
days
shows
ing on the
the ET-1-treated animals are task
pairwise discrimination significantly impaired.
over 20 sessions of (C) Proportion
testing. of animals
Less animals in thereaching
ET-1 groupthe criterion
were ablefortolearning
acquire the on
the pairwise
learning discrimination
criterion within 20task over 20
sessions. (D)sessions
Of thoseofanimals
testing. Less animals
that did reachinthe
thecriterion
ET-1 group werecontrol
in both able toand
acquire
ET-1the learning
groups, no
significant
criterion differences
within could(D)
20 sessions. beOfobserved for thethat
those animals total
didtrials
reachtaken to reachinthe
the criterion bothcriterion. (E) ET-1
control and Totalgroups,
numbernoofsignificant
incorrect
responses and
differences (F) be
could correction
observed trials for total
for the all animals testedtoshowed
trials taken reach thethecriterion.
ET-1 group (E)performed
Total number moreof correction trials thanand
incorrect responses the
control group. Error bars = 1 SEM, * p < 0.05, ** p < 0.01, *** p < 0.001, independent t-test, (Group size:
(F) correction trials for all animals tested showed the ET-1 group performed more correction trials than the control group. Control n = 7; ET-1
lesion n = 17).
Error bars = 1 SEM, * p < 0.05, ** p < 0.01, *** p < 0.001, independent t-test, (Group size: Control n = 7; ET-1 lesion n = 17).
2.3.
2.2. Early NeonatalNeonatal
ET-1 Induced IschemiaIschemia
Results in Reduced
Impairs Adult Cortical
Associative LearningandinStriatal Volume
the Pairwise Visual
Discrimination Touchscreen Task
At 24 weeks, histological analysis was performed, including measurement of cortical
and striatal
Sixteen area
weeks inafter
serialneonatal
sectionsdelivery
as shown in Figure
of ET-1 2A. animals
or saline, Coronal completed
sections ofaimmuno-
pairwise
histochemistry for NeuN
discrimination task in 12 series
to evaluate across
cognitive the rostro-caudal
performance relatedaxis from representative
to associative sa-
learning and
line (Figure 2A) and ET-1 (Figure 2B) -treated animals illustrate the gross morphological
memory. After 20 sessions of training on the pairwise visual discrimination task, while the
majority of animals in the saline group (85.7%) were able to acquire the learning criterion
(≥85% correct responses on two consecutive day), approximately a third of the animals in
the ET-1-treated group (35.3%) were able to achieve this (Figure 1C). A Kaplan–Meier sur-
vival analysis confirmed that there was a significant difference in the proportion of animals
in each group reaching the learning criterion (Mantel Cox X2 (2, n = 24) = 5.16, p = 0.023).
Of the animals that successfully acquired the pairwise discrimination task and reached
the learning criterion, comparison of the total number of trials taken to reach the criterion
showed no significant difference between groups (t-test; t(22) = 0.73, p = 0.473, Figure 1D).
Comparing all animals that were tested, although the total number of incorrect responses
was greater in the ET-1 group when compared to the control group (Control = 295.86
trials ± 80.48; ET-1 = 384.41 trials ± 134.86; t(22) = 1.61, p = 0.122, Figure 1E), this was notInt. J. Mol. Sci. 2021, 22, 4740 4 of 15
statistically different. However, analysis of the total number of correction trials (Figure 1F)
showed that the ET-1 group (823.65 correction trials ± 295.74) performed significantly more
Int. J. Mol. Sci. 2021, 22, 4740 4 of 15± 127.22;
correction trials compared to the Control group (Control = 587.00 correction trials
ET-1 = 823.65 correction trials ± 295.74; t(22) = 2.74, p = 0.012). Collectively, these data
indicate that the ET-1 insult robustly impairs associative learning and memory.
impact of the ischemic injury, including hydrocephaly as well as cortical and striatal atro-
phy. InNeonatal
2.3. Early addition Ischemia
to thinning, corticalinmalformation
Results in ET-1-treated
Reduced Adult Cortical andanimals was
Striatal character-
Volume
ised by scarring around the injection site and involution reminiscent of ulegyric folding
At 24 weeks, histological analysis was performed, including measurement of cortical
seen in cerebral palsy (Figure 2B,D).
and striatal area in serial
Extrapolation of thesections as shown in
area measurements Figure
in serial 2A. Coronal
sections was used sections of immunohisto-
to estimate corti-
chemistry for NeuN in 12 series across the rostro-caudal axis from
cal and striatal volume. There was no significant change in contralateral cortical sizerepresentative saline
(Figure 2A) 2E);
(Figure andhowever,
ET-1 (Figure 2B) -treated
the ipsilateral cortexanimals illustratereduced
was significantly the gross morphological
in volume in ET-1- impact
compared
of the ischemic to saline-treated animals
injury, including (Figure 2F; ET-1as
hydrocephaly = 51.26
well mm 3 ± 4.73, Saline = 64.15 mm3
as cortical and striatal atrophy. In
addition to thinning, cortical malformation in ET-1-treated animalswas
± 4.77, t(22) = 6.05, p < 0.001). Similarly, the contralateral striatal volume wasunchanged
characterised by
between groups (Figure 2G) but was significantly reduced in the ipsilateral hemisphere
scarring around the injection site and involution 3reminiscent of ulegyric folding seen in
of ET-1-treated animals (Figure 2H; ET-1 = 22.64 mm ± 2.75, Saline = 27.23 mm3 ± 3.43,
cerebral palsy (Figure
t(22) = 3.47, p = 0.002).2B,D).
Figure 2. Quantification of cortical and striatal volumes 24 weeks after ischemic injury. (A) The cortical (cyan) and striatal
Quantification
Figure 2. (red) of cortical and striatal volumes 24 weeks after ischemic injury. (A) The cortical (cyan) and striatal
regions quantified are illustrated in coronal sections from a representative control animal immunohistochemically
(red) regions quantified
labelled for NeuN. are
(B)illustrated in coronal sections
Immunohistochemistry for NeuN from a representative
in representative coronal control
sections animal
spanningimmunohistochemically
the rostro-caudal
axisNeuN.
labelled for 24 weeks(B)after ET-1 induced cortical ischemia
Immunohistochemistry for NeuN illustrates gross anatomical
in representative impactsections
coronal including ventricular
spanning enlargement
the rostro-caudal axis
(boxed area enlarged in (D)). Representative images of control (C) and ET-1 (D) cortical areas illustrate the cortical thinning
24 weeks after ET-1 induced cortical ischemia illustrates gross anatomical impact including ventricular enlargement (boxed
and hydrocephaly resulting from ischemic injury. Quantification of cortical volume showed no significant change between
area enlarged in (D)).
the control andRepresentative
ET-1 groups in theimages of control
contralateral (C) and
hemisphere ET-1
(E) but (D) corticalreduced
a significantly areas volume
illustrate theipsilateral
in the cortical hem-
thinning and
isphere in ET-1-treated animals (F). Similarly, striatal volume was not changed in the contralateral
hydrocephaly resulting from ischemic injury. Quantification of cortical volume showed no significant change between hemisphere (G) but the
was reduced in the ipsilateral hemisphere of animals with neonatal ischemic injury compared to the control group (H).
control and ET-1 groups in the contralateral hemisphere (E) but a significantly reduced volume in the ipsilateral hemisphere
in ET-1-treated animals (F). Similarly, striatal volume was not changed in the contralateral hemisphere (G) but was reduced
in the ipsilateral hemisphere of animals with neonatal ischemic injury compared to the control group (H). Scale bars = 1 mm.
Error bars = 1 SEM, ** p < 0.01, *** p < 0.001, independent t-test, (Group size: Control n = 7; ET-1 lesion n = 17).Int. J. Mol. Sci. 2021, 22, 4740 5 of 15
Extrapolation of the area measurements in serial sections was used to estimate cor-
tical and striatal volume. There was no significant change in contralateral cortical size
(Figure 2E); however, the ipsilateral cortex was significantly reduced in volume in ET-1-
compared to saline-treated animals (Figure 2F; ET-1 = 51.26 mm3 ± 4.73, Saline = 64.15 mm3
± 4.77, t(22) = 6.05, p < 0.001). Similarly, the contralateral striatal volume was unchanged
between groups (Figure 2G) but was significantly reduced in the ipsilateral hemisphere
of ET-1-treated animals (Figure 2H; ET-1 = 22.64 mm3 ± 2.75, Saline = 27.23 mm3 ± 3.43,
t(22) = 3.47, p = 0.002).
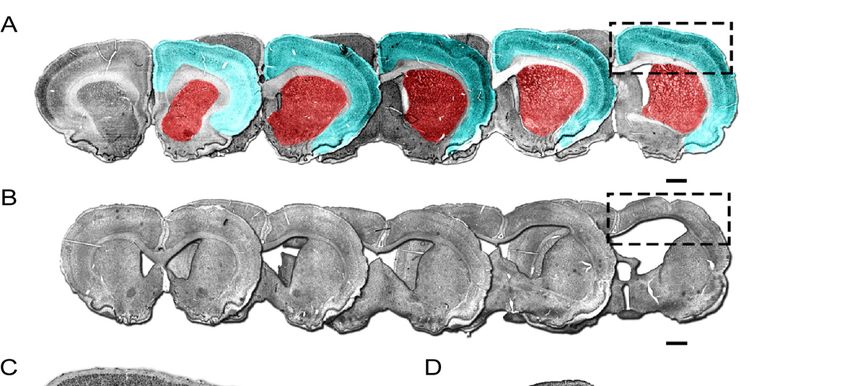
2.4. ET-1 Induced Neonatal Ischemia Results in Specific Patterns of White Matter Damage
White matter structures including the corpus callosum (CC) and periventricular white
matter bundles (PVWMB) were identified by darkfield microscopy (Figure 3A,B). Both
structures were affected by ischemic injury and this was particularly conspicuous for the
CC ipsilateral to ET-1 injection, which appeared malformed and significantly reduced in
size compared to saline injected animals. This was confirmed by area measurement in
coronal sections at the level of injection. Both the contralateral and ipsilateral CC area was
reduced in size in ET-1-treated animals relative to controls (Figure 3C,D); however, only the
difference on the ipsilateral side reached statistical significance (ET-1 = 2.11 mm2 ± 0.42,
Saline = 2.88 mm2 ± 0.34, t(22) = 4.28, p < 0.001). The relative size of PVWMBs in each
group was measured and represented as the percentage of white matter in a fixed field-of-
view in a dorso-medial area of the striatum directly adjacent to the lateral ventricle. This
showed that PVWMBs were significantly reduced in ET-1 animals in both the contralateral
(Figure 3E; ET-1 = 22.00%, ± 4.79, Saline = 26.20% ± 3.24, t(22) = 0.800, p = 0.046) and ipsi-
lateral hemispheres (Figure 3F; ET-1 = 15.59% ± 5.39, Saline = 25.87% ± 3.95, t(22) = 3.13,
p = 0.005).
2.5. Atrophy Resulting from Neonatal Ischemia Is Associated with Neuronal Loss
To determine if reduction in tissue volume reflected actual neuronal loss, as opposed to
merely a reduction in the extracellular space, neuronal density was measured. This showed
that neuronal density was either not significantly different or reduced in the striatum and
cortex of ET-1 compared to saline-treated animals (Figure 4A–E) and thus the atrophy was
representative of neuronal loss, rather than collapse of extracellular matrix in which case
neuronal density would be expected to be increased. The ipsilateral cortex of ischemic
animals in fact showed a significant decrease in neuronal density (Figure 4C; ET-1 = 6826.59
NeuN+/mm2 ± 1118.49, Saline = 9118.71 NeuN+/mm2 ± 1203.81) and thus a loss of
neuronal numbers beyond a linear reduction in line with the reduced tissue volume.
2.6. Neonatal Ischemia Results in a Chronic Neuroinflammatory State Persisting up to 24 Weeks
Immunohistochemistry for Iba1 identified microglia as an indicator of inflammation
24 weeks after ET-1 or saline injection (Figure 4F). Inspection of coronal sections showed
that early neonatal ischemic injury resulted in a robust inflammatory response that re-
mained at 24 weeks, characterised by a pattern of microglia that appeared much denser in
number and with many more cells with an activated, amoeboid morphology, relative to
control animals (Figure 4F). Quantification by optical density in fixed fields of view showed
that, microglial activation remained significantly elevated in the ET-1-treated animals
relative to controls 24 weeks after injury (Figure 4G–J). This was evident in both ipsilateral
cortex (ET-1 6.36% ± 1.47, control 4.23% ± 2.25; t(22) = 2.53, p = 0.019) and striatum (ET-1
5.16% ± 2.44, control 2.52 ± 1.13; t(22) = 2.71, p = 0.013). Although microglial activation also
appeared greater in the corresponding contralateral regions, this did not reach statistical
significance for cortex (t(22) = 1.58, p = 0.129) or striatum (t(22) = 1.36, p = 0.189).in each group was measured and represented as the percentage of white matter in a fixed
field-of-view in a dorso-medial area of the striatum directly adjacent to the lateral ventri-
cle. This showed that PVWMBs were significantly reduced in ET-1 animals in both the
contralateral (Figure 3E; ET-1 = 22.00%, ± 4.79, Saline = 26.20% ± 3.24, t(22) = 0.800, p =
Int. J. Mol. Sci. 2021, 22, 4740 6 of 15
0.046) and ipsilateral hemispheres (Figure 3F; ET-1 = 15.59% ± 5.39, Saline = 25.87% ± 3.95,
t(22) = 3.13, p = 0.005).
FigureFigure
3. Changes to the size and morphology of major white matter tracts following neonatal ischemia. (A) Representative
3. Changes to the size and morphology of major white matter tracts following neonatal ischemia. (A) Representative
darkfield images of coronal sections from a control and ET-1 group illustrate changes to white matter, with the area used
darkfield images of coronal sections from a control and ET-1 group illustrate changes to white matter, with the area used
for quantification for corpus callosum (red) and PVWMBs (cyan) indicated and boxed areas enlarged to show normal
for quantification for corpus callosum (red) and PVWMBs (cyan) indicated and boxed areas enlarged to show normal
morphology of the corpus callosum for control animals (i) in comparison with the gross morphological changes following
morphology of the corpus callosum for control animals (i) in comparison with the gross morphological changes following
neonatal ischemia (ii). 20X magnificaiton (B,C) Quantification of area in coronal sections showed no change in contrala-
neonatal ischemia (ii). 20X magnificaiton (B,C) Quantification of area in coronal sections showed no change in contralateral
teral corpus callosum (B) but a significant reduction in size of the ipsilateral corpus callosum (C) because of neonatal
corpus callosum (B) but a significant reduction in size of the ipsilateral corpus callosum (C) because of neonatal ischemia.
ischemia. Measurement of the size of the PVWMBs as the fractional contribution of white matter in a fixed field of view
Measurement of the size of the PVWMBs as the fractional contribution of white matter in a fixed field of view showed a
showed a significant reduction in PVWMB size in both the contralateral (D) and ipsilateral (E) hemispheres. Scale bar = 1
significant reduction in PVWMB size in both the contralateral (D) and ipsilateral (E) hemispheres. Scale bar = 1 mm. Error
bars = 1 SEM, * p < 0.01, ** p < 0.01, *** p < 0.001, independent t-test, (Group size: Control n = 7; ET-1 lesion n = 17).Int. J. Mol. Sci. 2021, 22, 4740 7 of 15
Int. J. Mol. Sci. 2021, 22, 4740 7 of 15
Figure 4. Immunohistochemical assessment of neuronal loss and microglial response to early neonatal ischemic injury.
Figure 4. Immunohistochemical assessment of neuronal loss and microglial response to early neonatal ischemic injury.
(A) Immunohistochemistry for NeuN showing neurons in representative fields of view from cortex and striatum of control
(A) Immunohistochemistry for NeuN showing neurons in representative fields of view from cortex and striatum of
and ET-1-treated animals at 24 weeks. Quantification showed that the number of neurons in ET-1 compared to control
controlwas
groups andunchanged
ET-1-treated animals at 24
in contralateral weeks.
cortex Quantification
(B) but significantlyshowed
reducedthat the
in the number cortex
ipsilateral of neurons
(C) andin was
ET-1unchanged
compared
to control groups was unchanged in contralateral cortex (B) but significantly reduced in the ipsilateral
in both the contralateral (D) and ipsilateral (E) striatum. (F) Immunohistochemistry for Iba1 showing microglial density cortex (C) and
was unchanged in both the contralateral (D) and ipsilateral (E) striatum. (F) Immunohistochemistry
in representative fields of view from cortex and striatum of control and ET-1-treated animals at 24 weeks. Quantification for Iba1 showing
showed
microglialthat microglial
density density in ET-1
in representative compared
fields to control
of view from cortexgroups was unchanged
and striatum of controlin contralateral
and ET-1-treated cortex
animals(G)atbut
24signif-
weeks.
icantly increased
Quantification in ipsilateral
showed cortex (H)
that microglial and was
density also unchanged
in ET-1 compared to incontrol
contralateral
groupsstriatum (I) and significantly
was unchanged in contralateralincreased
cortex
in
(G)ipsilateral (J) striatum.
but significantly Scaleinbars:
increased A, C; 100
ipsilateral µm.(H)
cortex Error
andbars
was =also
1 SEM, * p < 0.01,
unchanged ** p < 0.001, striatum
in contralateral independent
(I) andt-test, (Group
significantly
size: Control
increased n = 7; ET-1(J)
in ipsilateral lesion n = 17).
striatum. Scale bars: A, C; 100 µm. Error bars = 1 SEM, * p < 0.01, ** p < 0.001, independent t-test,
(Group size: Control n = 7; ET-1 lesion n = 17).Int. J. Mol. Sci. 2021, 22, 4740 8 of 15
2.7. Histopathological Features Correlate with Motor and Cognitive Deficits
To determine whether there were significant correlations between histopathological
features of ischemic injury and behavioural outcomes, two-sided Pearson’s correlations
were performed. Behavioural measures consisted of rotarod performance as an average of
the final 3 days of testing and the percentage of animals to reach criterion in the touchscreen
task. Histological measures included cortex and striatal atrophy, size of the corpus callosum
and PVWMBs, and neuronal numbers for cortex and striatum. These are presented both
for ipsilateral or contralateral hemispheres and summarised in Table 1.
Table 1. Pearson’s r correlation coefficients between histological measurements and behavioural
assessment scores show a number of significant associations between specific histopathological
outcomes and functional deficits. It is interesting to note that these relationships all exist only for
histological changes ipsilateral to the ischemic injury, suggesting a lateralisation of impairment that
could manifest in measures of motor and cognitive behaviour. * p < 0.05, ** p < 0.01.
Hemisphere Measurement Rotarod Touchscreen
Cortical Volume 0.40 * 0.46 *
Striatal Volume 0.35 0.39
NeuN density (cortex) 0.55 ** 0.48 *
Ipsilateral
NeuN density (striatum) 0.36 0.44 *
Corpus Callosum area 0.20 0.40 *
PVWMB area 0.32 0.04
Cortical Volume 0.22 −0.07
Striatal Volume 0.35 0.27
NeuN density (cortex) 0.37 0.32
Contralateral
NeuN density (striatum) 0.03 0.08
Corpus Callosum area 0.21 0.33
PVWMB area −0.14 −0.29
All significant correlations were associated with damage ipsilateral to the ischemic
injury. Significant positive correlations were found between cortical atrophy and both
rotarod and touchscreen scores. Similarly, significant positive correlations were found
between neuronal density in the cortex and with functional performance in the rotarod and
touchscreen tests. Thus, greater neuronal numbers are associated with higher performance
across behavioural measures. A significant positive correlation was also found between
neuronal numbers in the striatum and touchscreen performance, indicating that greater
preservation of striatal neurons is linked with a greater ability to perform pairwise dis-
crimination tasks. Significant positive correlation was also found between CC volume and
touchscreen performance.
2.8. White Matter Damage Is a Significant Predictor of Pairwise Discrimination Performance
Given the correlations described above but also taking into consideration the incon-
sistent capacity for half the animals to meet the basic criterion for learning the pairwise
discrimination task, we sought to determine whether any histological variable was a sig-
nificant predictor of learning. Animals were grouped for the dependent variable based
on whether they were considered to have learned the pairwise discrimination task. This
yielded two groups, learned (n = 12) and not learned (n = 12). A discriminant analysis was
performed where the key predictive variables were cortical and striatum volume, PVWMB
density, and CC area, for measurements both ipsilateral and contralateral to the lesion.
Only a single variable, ipsilateral CC area, was found to significantly explain the variance
in group member, Wilks’ Lambda = 0.81, χ2 = 4.56, F(1, 22) = 5.20, p = 0.033. This outcome
had an eigenvalue of 0.24 and the single variable explained 19% of the variance in whether
animals managed to learn the pairwise discrimination task. This result suggests that the
ability to learn a relatively simple pairwise discrimination task is dependent on processes
that involve the corpus callosum.Int. J. Mol. Sci. 2021, 22, 4740 9 of 15
3. Discussion
These results show that local injection of the vasoconstrictor ET-1 into the cortex
of early neonatal rats on postnatal day 0 results in behavioural and histopathological
features consistent with human prenatal brain injury leading to cerebral palsy (CP). The
significant deficits in balance and gross motor coordination measured on the accelerating
rotarod are consistent with motor impairments in CP, with clinical spasticity observed in
70–80% of patients, and 10–20% displaying an athetoid or dyskinetic phenotype [24,25].
The stable motor deficit is consistent with multiple studies using the well-established
Rice-Vannucci methods of hypoxic-ischemia (HI) in neonatal rodents, typically at the
later development stage of P7–P10 [26–30], which approximates certain hallmarks of
human brain development equivalent to near or full-term infants [10–12]. Here, we show
that modelling of cortical ischemic injury as early as P0, which approximates human
neurodevelopmental hallmarks closer to pre-term infants [13], also results in significant
and chronic gross motor impairment. This is in line with similar findings from our recent
work showing stable motor deficit, but no cognitive impairment based on a novel object
task after ET-1 induced ischemic injury to the rat striatum at P0 [17].
Here, we have further explored the cognitive impact of early neonatal ischemic injury
using a touchscreen approach and show impairment persisting into the chronic phase after
injury. While motor function is often prominent and emphasised in disease modelling, as-
sessing cognitive impacts such as deficits in working memory, processing speed and overall
intellectual ability are common features of human neonatal ischemic stroke [31–33]. In the
present study, we detected that ET-1 induced ischemic injury leads to robust impairments
in the capacity for associative learning and memory. Not only were animals less likely to
reach the learning criterion on the pairwise discrimination task at similar levels to controls,
but they made more errors, specifically, correction errors suggesting deficits in the ability to
adjust future responding from negative feedback. This is consistent with previous findings
using other methods of neonatal injury, including induced hypoxic-ischemic stroke at later
neonatal ages, and also other tests, such as the Morris water maze where cognitive function
has been found to be impaired [34–36]. Notably, in our previous study employing a similar
approach resulting in a similar histopathological outcome and gross motor impairment, we
did not detect cognitive impairment in a novel object recognition test [17]. This highlights
the greater sensitivity of the touchscreen test in the model. It should also be noted, that
while only roughly two-thirds of ET-1-treated animals failed to reach criterion, this does
not mean that those who did pass were unaffected cognitively. Overall, lesioned animals
also performed significantly more correction trials. This suggests that for those who still
could reach criterion, significantly more trials were required to get to a similar level of
performance and were likely affected by a more subtle deficit. However, this study was
not designed to assess specific neural thresholds required in associative learning; however,
it forms an interesting topic for future investigations. The finding that some animals in
the ET-1 group did reach criterion in the pairwise discrimination test does show a level
of variability similar to that which presents clinically in human neonatal ischemic stroke,
possibly related to the location and size of the initial ischemic injury.
These functional motor and cognitive impairments were accompanied by a histopatho-
logical phenotype that captures important features associated with the diagnosis of CP,
including reduced brain volume, cortical malformation, hydrocephaly and damage to
major white matter tracts [37–40]. Moreover, this is commonly observed in HI models,
where atrophy occurs ipsilateral to the ligation site [26,27,29]. Quantification of neuronal
density showed that the atrophy was indeed associated with neuronal loss, as opposed
to collapse of the extra-cellular compartment as we have reported previously for both
neonatal [17] and adult [41] models of ET-1 induced ischemic injury in rats. We also ob-
served significant atrophy of white matter structures including the CC and PVWMBs in
the dorso-medial striatum; comparable to human clinical data [1,6,25,42–46]. Damage to
white matter, particularly axonal injury is also a common clinical observation following
neonatal brain damage with evidence of a primary axonopathy [1,6,25,42–46] and has alsoInt. J. Mol. Sci. 2021, 22, 4740 10 of 15
been captured in previous work in rodents following bilateral carotid artery occlusion in
neonatal rats [47,48]. Notably, discriminant analysis of the correlation between histopatho-
logical outcomes and functional deficit showed damage to the ipsilateral corpus callosum
to have the strongest association with impaired cognitive performance. Such a finding
aligns closely with clinical observations that white matter pathology tends to be the most
predictive of future cerebral palsy related disability and that the degree of white matter
deficits correlates with severity of CP symptoms [46,49–52].
Another interesting feature of the histological analysis was the chronic nature of a
neuroinflammatory state persisting to 24 weeks. Previous work has implicated microglial
over-activation in exacerbating secondary brain damage following neonatal ischemic
stroke, likely through a combination of oxidative injury, triggering apoptosis, and/or
phagocytosis of cells that may potentially recover [53]. This persistent state of chronic
microglial activation following a single ischemic event early in life may be an interesting
target for therapeutic intervention during the chronic phase after injury. Furthermore, it
would be interesting to assess whether this heightened inflammatory state predisposes to
an increased pathological response to subsequent injuries.
In summary, we conclude that focal delivery of ET-1 into the early (P0) neonatal rat
brain offers a technically simple approach to model important clinical features of early
neonatal brain injury leading to CP. Importantly, this included an impairment of cognitive
performance related to associative learning and correlated with damage to white matter.
The work also highlights chronic inflammation as an interesting target for therapeutic
intervention. It represents a useful model for testing of new therapies for CP both in the
acute and chronic phases following neonatal brain injury.
4. Materials and Methods
4.1. Animals and Ethics
Ethical approval was granted on the 14 September 2016, by the Florey Institute of
Neuroscience and Mental Health Animal Ethics Committee (AEC no. 16-070-FINMH). All
experiments were conducted following the guidelines of the National Health and Medical
Research Council of Australia Code of Practice and use of Animals for Experimental
Purposes in Australia. A total of 24 neonatal Sprague Dawley rats (10 females; 14 males)
were obtained from two time-mated dams. At postnatal day 0 (P0) animals were randomly
assigned to either a control (vehicle) or an ET-1 ischemia group. Rats were housed with
mothers until weaned at 4 weeks when they were then group housed (3–4 rats per cage) in
individually ventilated cages. All housing was under standard lighting conditions with a
constant ambient temperature of approximately 22 ◦ C. Rats had free access to food and
water prior to commencing food restriction for behavioural testing (detailed below). Key
variables such as weight and ratio of sex between groups were assessed and found to not
differ significantly between groups therefore males and females were treated as one group.
4.2. Surgical Procedures
Rat pups were anesthetised at age P0 through induced hypothermia on wet ice for
approximately five minutes and placed in a cooled Cunningham adaptor stage fitted to a
stereotaxic apparatus (Kopf, Bergfelden, Germany). A lateral incision exposed the skull
in order to locate bregma. An injection of 0.5 µL of ET-1 (n = 17, 7 females, 10 males;
400 pmol) or saline vehicle (n = 7, 3 females, 4 males) was delivered to the frontal cortex
via a micro-syringe fitted with a glass capillary 0.5 anterior and 2.8 lateral to bregma,
and 0.5 mm below the dural surface. After injection, the cannula was left in place for
five minutes before being withdrawn. The incision was sutured and treated with topical
anaesthetic and antiseptic.
4.3. Behavioural Testing
The accelerating rotarod and pairwise discrimination tests were used to assess motor
function and aspects of cognitive function, respectively (Figure 5A).rized images. For neurons, total NeuN numbers were counted via the automated function
in ImageJ. For microglia, where many of the cells were overlapping, optical density was
calculated as the fraction of the field of view occupied by positive signal for Iba1. Dark-
field imaging was used to visualise and quantify white matter area, including the corpus
Int. J. Mol. Sci. 2021, 22, 4740 callosum (CC) measured as an area and periventricular white matter bundles (PWMB) 11 of 15
measured as the fractional contribution of white matter to the fixed field of view (20× ob-
jective).
Figure 5.
5. (A)
(A)Timeline
Timelineshowing
showingtime
timeofof
ET-1 induced
ET-1 inducedneonatal ischemia,
neonatal behavioural
ischemia, behaviouraltesting andand
testing brain tissue
brain collection.
tissue collec-
(B) Representative image of the Bussey-Saksida rat touch screen chamber (C) Visual stimuli used in the pairwise
tion. (B) Representative image of the Bussey-Saksida rat touch screen chamber (C) Visual stimuli used in the pairwise discrim-
ination task. task.
discrimination
4.3.1.
4.6. Accelerating
Statistical Rotarod
Analysis
Motor
IBM function
® SPSS was assessed
® Statistics Version 22 at 12 weeks
(IBM, of age,NY,
Armonk, to allow
USA)animals
was used totocomplete
managemost data
of their
and runnatural growth,
statistical using
analysis. Thethedescriptive
accelerating datarotarod.
provided Animals
in thewere
text placed
includeon a rotarod
means and
standard deviations, while graphs show means and standard error of the mean (SEM).and
sized for rats (Ugo Basile, Gemonio, Italy) initially rotating at constant speed of 4 rpm An
then accelerating
alpha of p < 0.05 was to 50adopted
rpm over to 300 s. Latency
establish to fallsignificance,
statistical from the rod was assessed
providing only twice
a 5%
daily with
chance of aapproximately
false positive 45 minWhere
error. between each test
suitable over 10 consecutive
assumptions were met,days.independent T-
tests were run to determine whether statistically significant differences existed between
4.3.2. Pairwise Discrimination Touchscreen Testing
groups. For histological analysis, discriminant analysis was used to predict group mem-
Cognitive
bership where the touchscreen testing
key predictive was assessed
variables startingand
were cortical at 16 weeks of
striatum age. For
volume, touch-
PVWMB
screen testing, animals were food restricted to and maintained at
density, and CC area, for measurements both ipsilateral and contralateral to the lesion.approximately 80–90% of
their free-feeding body weight throughout testing. At the conclusion
For behavioural analysis, repeated measures analysis of variance (RM ANOVA), t-tests or of the touchscreen
test, animals were
Kaplan–Meier placed
survival back on
analysis a free
were feeding diet.
used.
Testing was conducted in standard Bussey–Saksida touchscreen chambers for rats
(Campden
Author Instruments
Contributions: Ltd. UK/Lafayette
Conceptualization, Instruments,
B.J.K., C.L.P., J.N., andLafayette, IN USA, Figure
L.H.T.; methodology, 5B).
B.J.K., J.N.,
Testing
and chambers
L.H.T.; software,are trapezoidal
B.J.K.; in B.J.K.
validation, shapeand (30C.M.E.;
cm high × 33analysis,
formal cm longB.J.K.
(screen-magazine)
and C.M.E.; inves- ×
25 cm wide
tigation, (atC.M.E.,
B.J.K., screen)andorS.F.;
13 wide (at magazine)
resources, C.L.P., andand housed
L.H.T.; within aB.J.K.;
data curation densewriting—original
fibreboard box.
draft preparation,
The floor B.J.K.; writing—review
is perforated stainless steel andraisedediting,
above B.J.K., C.M.E.,
a tray. J.N., andare
Chambers L.H.T.; visualization,
equipped with a
B.J.K. and C.M.E.; supervision,
fan, touchscreen monitor (15.0 L.H.T.
inch,and C.L.P.;
screen project administration,
resolution 1024 × 768),B.J.K., L.H.T. and C.L.P.;
tone generator, house
light (LED), magazine unit and pellet dispenser. Following commencing food-restriction,
animals were pretrained through 5 stages [23] to train them to make instrumental responses
(i.e., nose-pokes) to visual stimuli displayed on the touchscreen in order to obtain a reward.
In brief, animals were first habituated to the apparatus (Stage 1) by being placed in the
chamber for 30 min a day over two days with reward pellets freely available in the reward
magazine. In Stage 2, a visual stimulus is displayed for 30 s on one of two response
windows on the touchscreen, and terminated with a tone, reward magazine illumination
and the delivery of a reward (one pellet). Next, Stage 3 required animals to touch the
stimulus to obtain a reward. Stage 4 extended Stage 3, but now required animals to
trigger stimulus presentation referred to as trial initiation. Lastly, the final stage (Stage 5)
discouraged animals from touching blank response windows during stimulus presentation
by punishing indiscriminate (‘incorrect’) choices. Each pretraining stage required a set
performance criterion to be reached before each animal could advance to the next stage as
described previously [23].
The day immediately following the completion of pretraining, animals were individ-
ually advanced onto the Pairwise Discrimination (PD) task, which required learning theInt. J. Mol. Sci. 2021, 22, 4740 12 of 15
association that responses to one of two images (Figure 5C) presented concurrently was
correct and thus rewarded, while responses to the other was incorrect and not rewarded.
Incorrect responses led to a correction trial, where the previous trial was repeated until a
correct response was made. Correction trials were not included in the tally of trials per
session. Animals received daily sessions of a maximum of 60 trials or 60 min for 20 sessions,
or until animals acquired the learning criterion of ≥85% correct responses (completing
60 trials) on 2 consecutive days.
4.4. Tissue Processing and Histological Assessment
At 24 weeks of age, animals were processed for histological assessment. Following
a terminal dose of pentobarbitone (100 mg/kg; Virbac, Peakhurst, Australia) animals
were transcardially perfused with 50 mL 0.2 M phosphate buffered saline and 250 mL
paraformaldehyde (PFA, 4% in 0.2 M phosphate buffer with 0.2% picric acid). The brains
were collected and post-fixed in PFA for 2 h, followed by cryo-protection in 20% sucrose PBS
solution for one to two days. The brains were snap frozen on dry ice and coronal sections
were collected in series at 40 µm using a freezing-microtome (Leica, Wetzlar, Germany).
Immunohistochemistry was performed on free-floating sections as previously de-
scribed [54]. Primary antibodies specific for NeuN (1:500; Abcam, ab104225, Cambridge,
MA, USA) or Iba1 (1:1000; Wako, West Grove, PA, USA, 019-19741) were incubated
overnight to detect neurons or microglial, respectively. After washing, the tissue was incu-
bated with anti-rabbit biotinylated secondary antibody (1:400, Jackson ImmunoResearch,
711-065-152, USA) with 2% donkey serum for 2 h, followed by washing and incubation
in avidin-biotin complex (ABC Elite kit, Vectastain; Vector Laboratories, Burlingame, CA,
USA) for 1 h. A peroxidase-driven precipitation of diaminobenzidine (DAB) was used to
visualise chromogenic labelling, catalysed with a 1% H2 O2 solution and terminated by
washing in PBS.
4.5. Histological Quantification
Images were captured using a Leica DM6000 B upright light microscope equipped
with a motorised stage to capture whole coronal sections labelled for NeuN. Cortical
and striatal area were measured at rostro-caudal levels corresponding to approximately
2.20, 1.30, 0.48, −0.30 and −1.30 mm relative to bregma. The volume of each structure
was extrapolated from the cumulative area according to the method of Cavalieri [55].
Quantification of NeuN+ neurons or Iba1+ microglia were performed using a fixed field
of view (20× objective) and thresholding of the photomicrographs in ImageJ to produced
binarized images. For neurons, total NeuN numbers were counted via the automated
function in ImageJ. For microglia, where many of the cells were overlapping, optical
density was calculated as the fraction of the field of view occupied by positive signal for
Iba1. Darkfield imaging was used to visualise and quantify white matter area, including
the corpus callosum (CC) measured as an area and periventricular white matter bundles
(PWMB) measured as the fractional contribution of white matter to the fixed field of view
(20× objective).
4.6. Statistical Analysis
IBM® SPSS® Statistics Version 22 (IBM, Armonk, NY, USA) was used to manage data
and run statistical analysis. The descriptive data provided in the text include means and
standard deviations, while graphs show means and standard error of the mean (SEM).
An alpha of p < 0.05 was adopted to establish statistical significance, providing only a 5%
chance of a false positive error. Where suitable assumptions were met, independent T-tests
were run to determine whether statistically significant differences existed between groups.
For histological analysis, discriminant analysis was used to predict group membership
where the key predictive variables were cortical and striatum volume, PVWMB density, and
CC area, for measurements both ipsilateral and contralateral to the lesion. For behaviouralInt. J. Mol. Sci. 2021, 22, 4740 13 of 15
analysis, repeated measures analysis of variance (RM ANOVA), t-tests or Kaplan–Meier
survival analysis were used.
Author Contributions: Conceptualization, B.J.K., C.L.P., J.N., and L.H.T.; methodology, B.J.K., J.N.,
and L.H.T.; software, B.J.K.; validation, B.J.K. and C.M.E.; formal analysis, B.J.K. and C.M.E.; investi-
gation, B.J.K., C.M.E., and S.F.; resources, C.L.P., and L.H.T.; data curation B.J.K.; writing—original
draft preparation, B.J.K.; writing—review and editing, B.J.K., C.M.E., J.N., and L.H.T.; visualization,
B.J.K. and C.M.E.; supervision, L.H.T. and C.L.P.; project administration, B.J.K., L.H.T. and C.L.P.;
funding acquisition, L.H.T. and C.L.P. All authors have read and agreed to the published version of
the manuscript.
Funding: This work was supported NHMRC project grant 1130734. The Florey Institute of Neuro-
science and Mental Health acknowledges the strong support from the Victorian Government and
in particular the funding from the Operational Infrastructure Support Grant. C.L.P. is an NHMRC
Senior Research Fellow.
Institutional Review Board Statement: Ethical approval was granted on the 14th of September,
2016, by the Florey Institute of Neuroscience and Mental Health Animal Ethics Committee (AEC
no. 16-070-FINMH). All experiments were conducted following the guidelines of the National Health
and Medical Research Council of Australia Code of Practice and use of Animals for Experimental
Purposes in Australia.
Informed Consent Statement: Not applicable.
Data Availability Statement: Data will be made available by any reasonable request via email to the
corresponding author as per MDPI Research Data Policies.
Acknowledgments: The authors would like to thank Mong Tien for their assistance in technical and
lab management support. The authors would like to thank the Florey Institute of Neuroscience and
Mental Health Behaviour Facility, in particular Brett Purcell and Travis Featherby.
Conflicts of Interest: The authors declare no conflict of interest. The funders had no role in the design
of the study; in the collection, analyses, or interpretation of data; in the writing of the manuscript, or
in the decision to publish the results.
Abbreviations
CP Cerebral palsy
ET-1 Endothelin-1
PD Pairwise discrimination
ITI Inter-trial interval
IHC Immunohistochemical
DAB diaminobenzidine
ABC avidin-biotin complex
CC Corpus callosum
PVWMB periventricular white matter bundles
HI Hypoxic ischemia
References
1. Tsai, A.J.; Lasky, R.E.; John, S.D.; Evans, P.W.; Kennedy, K.A. Predictors of Neurodevelopmental Outcomes in Preterm Infants
with Intraparenchymal Hemorrhage. J. Perinatol. Off. J. Calif. Perinat. Assoc. 2014, 34, 399–404. [CrossRef] [PubMed]
2. Berger, R.; Garnier, Y.; Jensen, A. Journal of the Society for Gynecologic Investigation Perinatal Brain Damage: Underlying
Mechanisms and Neuroprotective Strategies. J. Soc. Gynecol. Investig. 2002, 9, 319–328. [CrossRef]
3. Rees, S.; Harding, R.; Walker, D. The Biological Basis of Injury and Neuroprotection in the Fetal. Int. J. Dev. Neurosci. 2012, 29,
551–563. [CrossRef] [PubMed]
4. Allen, M.C. Neurodevelopmental Outcomes of Preterm Infants. Curr. Opin. Neurol. 2008, 21, 123–129. [CrossRef]
5. Vincer, M.J.; Allen, A.C.; Joseph, K.S.; Stinson, D.A.; Scott, H.; Wood, E. Increasing Prevalence of Cerebral Palsy among Very
Preterm Infants: A Population-Based Study. Pediatrics 2006, 118, e1621–e1626. [CrossRef] [PubMed]
6. Back, S.A.; Luo, N.L.; Mallinson, R.A.; O’Malley, J.P.; Wallen, L.D.; Frei, B.; Morrow, J.D.; Petito, C.K.; Roberts, C.T.;
Murdoch, G.H.; et al. Selective Vulnerability of Preterm White Matter to Oxidative Damage Defined by F2-Isoprostanes. Ann.
Neurol. 2005, 58, 108–120. [CrossRef] [PubMed]Int. J. Mol. Sci. 2021, 22, 4740 14 of 15
7. Fernández-López, D.; Faustino, J.; Derugin, N.; Vexler, Z.S. Acute and Chronic Vascular Responses to Experimental Focal Arterial
Stroke in the Neonate Rat. Transl. Stroke Res. 2013, 4, 179–188. [CrossRef]
8. Chicha, L.; Smith, T.; Guzman, R. Stem Cells for Brain Repair in Neonatal Hypoxia-Ischemia. Childs Nerv. Syst. 2014, 30, 37–46.
[CrossRef]
9. Inder, T.E.; Anderson, N.J.; Spencer, C.; Wells, S.; Volpe, J.J. White Matter Injury in the Premature Infant: A Comparison between
Serial Cranial Sonographic and MR Findings at Term. Am. J. Neuroradiol. 2003, 24, 805–809.
10. Rice, J.E.; Vannucci, R.C.; Brierley, J.B. The Influence of Immaturity on Hypoxic-ischemic Brain Damage in the Rat. Ann. Neurol.
Off. J. Am. Neurol. Assoc. Child. Neurol. Soc. 1981, 9, 131–141. [CrossRef]
11. Vannucci, R.C.; Vannucci, S.J. A Model of Perinatal Hypoxic-Ischemic Brain Damage. Ann. N. Y. Acad. Sci. 1997, 835, 234–249.
[CrossRef] [PubMed]
12. Semple, B.D.; Blomgren, K.; Gimlin, K.; Ferriero, D.M.; Noble-Haeusslein, L.J. Brain Development in Rodents and Humans:
Identifying Benchmarks of Maturation and Vulnerability to Injury across Species. Prog. Neurobiol. 2013, 106, 1–16. [CrossRef]
[PubMed]
13. Mallard, C.; Vexler, Z.S. Modeling Ischemia in the Immature Brain: How Translational Are Animal Models? Stroke 2015, 46,
3006–3011. [CrossRef] [PubMed]
14. Grafe, M.R. Developmental Changes in the Sensitivity of the Neonatal Rat Brain to Hypoxic/Ischemic Injury. Brain Res. 1994, 653,
161–166. [CrossRef]
15. Back, S.A.; Han, B.H.; Luo, N.L.; Chricton, C.A.; Xanthoudakis, S.; Tam, J.; Arvin, K.L.; Holtzman, D.M. Selective Vulnerability of
Late Oligodendrocyte Progenitors to Hypoxia–Ischemia. J. Neurosci. 2002, 22, 455–463. [CrossRef] [PubMed]
16. McClure, M.M.; Threlkeld, S.W.; Fitch, R.H. The Effects of Erythropoietin on Auditory Processing Following Neonatal Hypoxic–
Ischemic Injury. Brain Res. 2006, 1087, 190–195. [CrossRef]
17. Wright, J.L.; Chu, H.X.; Kagan, B.J.; Ermine, C.M.; Kauhausen, J.A.; Parish, C.L.; Sobey, C.G.; Thompson, L.H. Local Injection of
Endothelin-1 in the Early Neonatal Rat Brain Models Ischemic Damage Associated with Motor Impairment and Diffuse Loss in
Brain Volume. Neuroscience 2018. [CrossRef]
18. Westmacott, R.; MacGregor, D.; Askalan, R.; deVeber, G. Late Emergence of Cognitive Deficits after Unilateral Neonatal Stroke.
Stroke 2009, 40, 2012–2019. [CrossRef]
19. Clowry, G.J.; Basuodan, R.; Chan, F. What Are the Best Animal Models for Testing Early Intervention in Cerebral Palsy? Front.
Neurol. 2014, 5. [CrossRef]
20. Rumajogee, P.; Bregman, T.; Miller, S.P.; Yager, J.Y.; Fehlings, M.G. Rodent Hypoxia-Ischemia Models for Cerebral Palsy Research:
A Systematic Review. Front. Neurol. 2016, 7, 57. [CrossRef]
21. Talpos, J.C.; Fletcher, A.C.; Circelli, C.; Tricklebank, M.D.; Dix, S.L. The Pharmacological Sensitivity of a Touchscreen-Based
Visual Discrimination Task in the Rat Using Simple and Perceptually Challenging Stimuli. Psychopharmacology 2012, 221, 437–449.
[CrossRef] [PubMed]
22. Bryce, C.A.; Howland, J.G. Stress Facilitates Late Reversal Learning Using a Touchscreen-Based Visual Discrimination Procedure
in Male Long Evans Rats. Behav. Brain Res. 2014, 278C, 21–28. [CrossRef]
23. Horner, A.E.; Heath, C.J.; Hvoslef-Eide, M.; Kent, B.A.; Kim, C.H.; Nilsson, S.R.O.; Alsiö, J.; Oomen, C.A.; Holmes, A.; Saksida,
L.M.; et al. The Touchscreen Operant Platform for Testing Learning and Memory in Rats and Mice. Nat. Protoc. 2013, 8, 1961–1984.
[CrossRef] [PubMed]
24. Krigger, K.W. Cerebral Palsy: An Overview. Am. Fam. Physician 2006, 73, 91–100. [PubMed]
25. Rennie, J.M.; Hagmann, C.F.; Robertson, N.J. Outcome after Intrapartum Hypoxic Ischaemia at Term. Semin. Fetal. Neonatal Med.
2007, 12, 398–407. [CrossRef]
26. Alexander, M.; Garbus, H.; Smith, A.L.; Rosenkrantz, T.S.; Fitch, R.H. Behavioral and Histological Outcomes Following Neonatal
HI Injury in a Preterm (P3) and Term (P7) Rodent Model. Behav. Brain Res. 2014, 49, 1841–1850. [CrossRef]
27. Bona, E.; Johansson, B.; Hagberg, H. Sensorimotor Function and Neuropathology Five to Six Weeks after Hypoxia-Ischemia in
Seven-Day-Old Rats. Pediatr. Res. 1997, 42, 678–683. [CrossRef]
28. Fan, L.; Lin, S.; Pang, Y.; Lei, M.; Zhang, F.; Rhodes, P.; Cai, Z. Hypoxia-Ischemia Induced Neurological Dysfunction and Brain
Injury in the Neonatal Rat. Behav. Brain Res. 2005, 165, 80–90. [CrossRef]
29. Jansen, E.M.; Low, W.C. Long-Term Effects of Neonatal Ischemic-Hypoxic Brain Injury on Sensorimotor and Locomotor Tasks in
Rats. Behav. Brain Res. 1996, 78, 189–194. [CrossRef]
30. Lubics, A.; Reglodi, D.; Tamás, A.; Kiss, P.; Szalai, M.; Szalontay, L.; Lengvári, I. Neurological Reflexes and Early Motor Behavior
in Rats Subjected to Neonatal Hypoxic-Ischemic Injury. Behav. Brain Res. 2005, 157, 157–165. [CrossRef]
31. Westmacott, R.; Askalan, R.; Macgregor, D.; Anderson, P.; Deveber, G. Cognitive Outcome Following Unilateral Arterial Ischaemic
Stroke in Childhood: Effects of Age at Stroke and Lesion Location. Dev. Med. Child. Neurol. 2010, 52, 386–393. [CrossRef]
32. Fernández-López, D.; Natarajan, N.; Ashwal, S.; Vexler, Z.S. Mechanisms of Perinatal Arterial Ischemic Stroke. J. Cereb. Blood Flow
Metab. 2014, 34, 921–932. [CrossRef] [PubMed]
33. Golomb, M.R.; Garg, B.P.; Edwards-Brown, M.; Williams, L.S. Very Early Arterial Ischemic Stroke in Premature Infants. Pediatr.
Neurol. 2008, 38, 329–334. [CrossRef]
34. Ikeda, T.; Mishima, K.; Yoshikawa, T.; Iwasaki, K.; Fujiwara, M.; Xia, Y.X.; Ikenoue, T. Selective and Long-Term Learning
Impairment Following Neonatal Hypoxic-Ischemic Brain Insult in Rats. Behav. Brain Res. 2001, 118, 17–25. [CrossRef]You can also read