Fiscal redistribution policies for fostering social harmony in selected places
←
→
Page content transcription
If your browser does not render page correctly, please read the page content below
Information Note
                                             Fiscal redistribution policies for
Research Office
                                             fostering social harmony
Legislative Council Secretariat              in selected places
                                                                                                IN15/20-21

   1.           Introduction

   1.1       Social harmony can be defined as a condition of society in
   which stability is achieved by upholding values such as mutual trust,
   respect and inclusiveness. 1      With its roots traced back to the ancient
   Chinese philosophy of Confucianism, social harmony has been reinvigorated by
   the Central Government in the 2000s 2, and later, by the Hong Kong Government
   in the 2005 Policy Address, which emphasised social harmony as the building
   block of stability and prosperity. Nonetheless, social harmony is a complex
   construct hardly attributed to one single factor or measured by a single
   indicator. In an attempt to gauge social harmony, some scholars have used a
   myriad of factors ranging from public governance (e.g. law and order), to the
   social aspect (e.g. tolerance of diverse values) and economic aspect of social
   harmony (e.g. extent of economic inequality). 3

   1.2        While economic inequality in terms of income and wealth commonly
   exist in societies, unchecked inequality is considered to have adverse effects on
   social harmony. In fact, income inequality is at its historical high in most
   countries of the Organisation for Economic Co-operation and Development
   ("OECD") since the end of the Second World War. 4 The Gini coefficient of
   market income 5 stood at an average of above 0.46 in OECD economies in 2018.
   The richest 10% of the OECD population earn about nine times more than the
   poorest 10%, up from seven times a quarter century ago. 6 Wealth inequality
   is even more pronounced, with the richest 10% of households in OECD

   1
        See Ip (2014), and Bell and Mo (2013).
   2
        The former President Hu Jintao has called for the building of a "harmonious society" based on
        principles such as fairness and justice, trustworthiness and fraternity, stability and order, etc. See
        中 華 人 民 共 和 國 中 央 人 民 政 府 (2006).
   3
        See Ip (2014) and Hong Kong Professionals and Senior Executives Association (2014).
   4
        See United Nations (2014).
   5
        It is a common gauge of income inequality before government taxes and transfers (i.e. market
        income inequality). It ranges from 0 to 1, with 1 being complete inequality. See OECD (2020b).
   6
        See OECD (undated).
economies owing half of the total net wealth in the form of property and
financial assets. 7 Hong Kong is no exception. Income inequality as measured
by Gini coefficient has also hit a four-decade high in 2016, raising concerns over
increasing poverty and the availability of opportunities for climbing up the
income and social ladder.
1.3 A growing body of literature suggests that the consequences of
growing inequality are detrimental to society. A widening income and wealth
gap can adversely affect social mobility, which can be intra-generational or
inter-generational. 8 Rising inequality can also generate a greater sense of
unfairness, erode trust among people and in governments, and even fuel
tensions and divides that jeopardize political, economic and social stability. 9
1.4 At the request of Hon WONG Ting-kwong, the Research Office has
conducted a study on fiscal redistribution policies adopted in selected places to
address economic inequality, which is considered an important factor of social
harmony. Singapore and New Zealand are chosen for the study. While both
are advanced Asia-Pacific economies like Hong Kong, they have managed to
taper economic inequalities with a holistic range of redistributive measures
targeted at low- and/or middle-income people. Singapore has made home
ownership affordable to most families, apart from its emphasis on early
childhood development and human capital investment on lower-wage workers.
Likewise, New Zealand has extended assistance to the working poor, especially
families with children, with income subsidies. It has also stepped up efforts to
promote home ownership by introducing flexible housing options (e.g. rent to
buy) to help targeted households progressively move up the housing ladder.
1.5 This information note first reviews the global trends on fiscal
redistribution policies with reference to OECD countries and China, and moves
on to the section on Hong Kong to examine its inequality trend and
redistributive measures to tackle the issue. This is followed by a discussion of
the redistributive approaches in the two selected places, focusing on policy
areas critical to a person's well-being, including (a) housing, (b) employment,
and (c) support for families with children.
7
See Balestra and Tonkin (2018).
8
Intra-generational mobility refers to the ability for people to move between socioeconomic classes
within their own lifetime. Inter-generational mobility occurs when a person moves up or down
the socioeconomic ladder compared to his/her parents. See World Economic Forum (2020).
9
See Keeley (2015) and Clements et al. (2015).
22. Global trends on fiscal redistribution
2.1 Globally, the policy response to growing economic inequality is
multidimensional. Redistributive policies reduce the inequality of disposable
income (i.e. income after taxes and transfers), primarily through income
redistribution towards lower-income households via taxes and transfers. 10
For example, cash transfers such as unemployment and social assistance secure
the minimum living standards of low-income groups. Personal income taxes
play a crucial role in equalizing disposable income, whereas capital gains taxes
on properties and wealth taxes on inheritance are used in some places to
enhance the progressivity of the tax regime. Meanwhile, in-kind benefits such
as subsidized education can lower income inequality through their impact on
future earnings and access to opportunities for individuals, thus reducing the
need for fiscal redistribution.
2.2 Overall, taxes and transfers are estimated to have curtailed income
inequality by an average of 25% in OECD economies. 11 Yet owing to different
redistributive policies with different mix and size, the redistributive effect – as
measured by the difference in the Gini coefficient before and after taxes and
transfers – varies widely across OECD economies (Figure 1). The redistributive
effect is the highest in some Nordic and Central European countries, all
characterized by relatively large cash transfers financed by higher taxation.
These are followed by places such as Japan and New Zealand, where transfers
are smaller but targeted at low-income groups or spent on old-age pensions.
A higher redistributive effect may have positive association with social mobility
and social harmony. According to the World Economic Forum's Global Social
Mobility Index, the Nordic countries took the top spots in the list of
82 economies, while several Asia-Pacific economies such as Japan, Singapore
and New Zealand made it to the top 25. 12 Norway and Finland also scored
among the highest in the Social Harmony Index compiled by scholars to measure
the extent of harmony with indicators such as peaceful order and respect for
diversity. 13
10
See Clements et al. (2015).
11
See Causa et al. (2017).
12
See World Economic Forum (2020).
13
See Bell and Mo (2014).
3Figure 1 – Reduction in Gini coefficient in selected OECD economies, 2018
(or latest year available)
0.700
0.509 0.529 0.500 0.504 0.513 0.505 0.495
0.469 0.454 0.462
0.500 0.429
0.402
0.460
0.390
0.300 0.366 0.349 0.345
0.339 0.319 0.325
0.301 0.289
0.269 0.262
0.100
Before taxes and transfers After taxes and transfers
Note: (1) It is based on data from 37 OECD member countries (excluding Colombia) in 2018 or the latest
year available.
Source: OECD (2020b).
2.3 While taxes and transfers are common policy tools for redistribution,
transfers have reduced income inequality more than taxes in OECD countries,
contributing to 75% of the reduction. 14 In particular, transfers related to
housing, employment and support for children and families have gained
particular attention from policymakers. Due to rising housing cost, the share
of owner-occupied housing in the total housing stock has been static or even
declined in nearly all OECD countries since 2000. On the other hand, amid
rising housing prices and a shortage of subsidized housing 15 , private rental
housing has been on consistent growth across all age groups (except seniors).
Instead of using grants to subsidize home purchases, more OECD countries have
turned to providing housing allowances for low-income households to rent in
the private market, with relevant spending at about 0.3% of GDP since 2009.
While housing is the biggest spending item of households in OECD countries,
14
See Joumard et al. (2012) and Causa et al. (2017).
15
Since the Global Financial Crisis, public investment in housing development has halved to less than
0.1% of GDP across OECD countries on average. See OECD (2020a).
4housing assets make up about half of total household assets. 16 Unequal access
to home ownership is therefore considered to have profound implications on
wealth accumulation, potentially widening wealth inequality. 17
2.4 On Employment, social transfers in the form of cash benefits are
common measures to help the unemployed, vulnerable job seekers and/or the
in-work poor in OECD countries. Such transfers have reduced the in-work
poverty rate by half on average in OECD.18 However, owing to concerns that
welfare may act as an impediment to economic efficiency by eroding work
incentives and creating welfare dependency 19 , there has been a shift of
emphasis to a redistributive policy focusing on human capital investment –
strengthening one's capacity to generate income – rather than merely relying
on cash assistance. 20 For example, skills training and hiring subsidies are
increasingly used to expand the employment opportunities for those facing
disadvantages, such as older unemployed workers in ageing societies.
2.5 Supporting families with dependent children is another crucial aspect.
Children's early years set the stage for future growth and can have lifelong
impact on their income and social outcomes. 21 Yet since the onset of the
Global Financial Crisis a decade ago, child poverty rates have risen in two-thirds
of OECD countries, with one in seven children living in income poverty. 22
To combat child poverty, OECD countries have generally pledged to support
parental employment by making work pay and improving access to affordable
childcare, and has enhanced family benefits for poor families with children.
On average, every 1% increase in social spending per capita is associated with a
1% decrease in child poverty rate. 23
2.6 Beyond OECD countries, other economies have made considerable
efforts to tackle inequality by uplifting the poor. One example is China, which
has pledged in the 14th Five Year Plan (2021-2025) to make further progress on
redistribution to narrow inequality between rural and urban areas. 24 The
Mainland has progressively developed a near-universal social security system,
16
Ibid.
17
See Causa et al. (2019).
18
See OECD (2009).
19
See International Monetary Fund (1998).
20
See Cingano (2014) and International Monetary Fund (2018b).
21
See UNICEF (undated).
22
The poverty threshold is set at 50% of median equivalized income. See Thevenon et al. (2018).
23
See OECD (2018).
24
See 中 華 人 民 共 和 國 中 央 人 民 政 府 (2020).
5under which health insurance and old-age pensions have been expanded to
provide coverage to rural residents and non-working urban residents. 25
A means-tested social assistance scheme known as "最 低 生 活 保 障 ", also
called Dibao (低 保 ), is in place to provide basic income support for the poor,
although social spending in China still trails behind other economies. 26
2.7 Job creation is another focus of China's poverty alleviation strategy.
The Mainland has created temporary jobs 27 and has actively supported the
development of e-commerce entrepreneurship as a means to promote social
mobility. A World Bank study suggests that the growth of e-commerce
infrastructure and logistics has revitalized the rural village economy by widening
the market access for producers. The number of "Taobao villages", defined as
villages engaged in e-commerce with annual transaction volume of over
10 million yuan (HK$12 million) and at least 100 active online shops, rose from
20 in 2013 to some 4 300 in 2019. 28 Since the early 1980s, through reform and
opening-up, as well as extensive poverty alleviation efforts in rural areas, China
has lifted more than 700 million people out of poverty, which accounted for
more than 70% of global poverty.29
3. Hong Kong
3.1 As with other developed economies, Hong Kong measures income
inequality with the Gini coefficient, which is compiled by the Census and
Statistics Department ("C&SD") every five years, with the latest figures compiled
in 2016. Gini coefficient compiled by C&SD primarily measures (a) disparity of
cash income; and (b) effect of taxation and in-kind social benefits. Estimation
of cash income disparity is based on original household income, which covers
employment income, other cash income (e.g. dividend), and cash social benefits
25
See International Labour Organization (2018) and Gao et. al. (2018).
26
Social assistance spending, which includes spending on Dibao and other assistance programmes,
is about 0.7% of China's GDP, compared to 1.6% in emerging economies and 2.1% in OECD
economies. See International Monetary Fund (2018a).
27
One example is the creation of "public welfare posts (公 益 性 崗 位 )" (e.g. cleaning and elderly
care jobs) in poor villages so that people can improve public local services while supporting
themselves. Some 30 000 "poverty alleviation workshops (扶 貧 車 間 )" have also been set up
in idle houses in impoverished communities, allowing the poor to earn a living close to home by
taking up simple industrial and agricultural processing work. See China.org.cn (2020) and
Xinhua (2021).
28
See World Bank (2019).
29
See World Bank (2018).
6(e.g. Old Age Living Allowance and Comprehensive Social Security Assistance
("CSSA")). In the 1970s and 1980s, the Gini coefficient was on rapid rise amid
economic advancement, indicating widening income inequality (Figure 2). The
acceleration was mainly due to inflow of immigrants from the Mainland and
economic restructuring, leading to significant changes in the labour market and
earnings structure. 30
3.2 Since the mid-1990s, growth of Gini coefficient has moderated, in
particular after the statutory minimum wage was implemented in 2011 and cash
social benefits (e.g. Old Age Living Allowance) was increased in the early 2010s.
In recent years, the Government has allocated more resources to alleviate
poverty. In 2020-2021, the recurrent expenditure on social welfare was
estimated at HK$90.9 billion, a 56% increase compared with 2015-2016.
Among the expenditure items, elderly services made up the second largest
component after CSSA.
Figure 2 – Income disparity measured by Gini Coefficient, 1971-2016(1)
0.533 0.537 0.539
0.525
0.518 Effect of
(-0.062) (-0.066) tax (23%) and
in-kind soical
benefits (77%)
0.476 0.475 0.475 0.473
0.466 0.470
0.451 0.453
0.43 0.429
1971 1976 1981 1986 1991 1996 2001 2006 2011 2016
Original monthly household income Post-tax post-social transfer monthly household Income
Note: (1) Data for post-tax post-social transfer household income is not available prior to 1996.
Sources: Financial Secretary's Office (2017), Census and Statistics Department (2007) and (2017).
3.3 Taxes and in-kind social benefits have the effect of narrowing
household income disparity. As indicated in Figure 2, Gini coefficient after
adjusting for outflows of taxation and inflows of in-kind social benefits was
0.473 in 2016, representing a reduction of 0.066. The magnitude of reduction
was slightly higher than that in 2011, indicating increased strength of
redistributive policies over the period. Taxes accounted for 23% of the effect
30
See Financial Secretary's Office (2017).
7while in-kind benefits accounted for 77%. Under C&SD's measurement
framework, taxation covered salaries tax and property tax, as well as general
rates and government rent, whereas in-kind social benefits included housing,
education and medical benefits. 31
3.4 As illustrated in Figure 3, taxation and in-kind social benefit transfers
have increased the average monthly household income of the first to eighth
decile groups. After redistribution, income inequality between the rich and
the poor has narrowed. The average monthly household income of the
bottom decile group grew by 126% to HK$6,390. The top decile group's
income decreased by about 10% to HK$148,510. Hong Kong features a low
taxation regime with a tax-to-GDP ratio of less than 13% in 2019. Still, taxation
plays a role to achieve a more even distribution of income and reduce the
inequality of wealth. There are suggestions of increasing the progressivity of
existing taxes and/or introducing new taxes like capital gains tax, to help
broaden the tax base on one hand and counter the inequality gap on the other. 32
The Financial Secretary has said that while it is not the right time to introduce
new taxes, the Government will study the feasibility of incorporating
progressivity in the current rating system.
Figure 3 – Percentage distribution and average monthly household income
before and after tax and in-kind social transfer, 2016
(%) HK$164,281
Original monthly household income
50 Post-tax post-social transfer monthly household income HK$148,510
41.0
40 35.7
HK$64,595
30 HK$49,060
HK$26,510
HK$64,530
20 HK$6,390
HK$46,635 16.1 15.7
11.6 11.9
HK$21,837 9.0 9.6
10 7.1 7.9
HK$2,831 4.1 5.1 5.4 6.4
2.0 2.7 3.0 3.9
0.7 1.0
1st 2nd 3rd 4th 5th 6th 7th 8th 9th 10th
Decile group
Source: Census and Statistics Department (2017).
31
In-kind social benefits include housing benefits pertaining to public rental housing and subsidized
home ownership housing; education benefits are imputed based on school type and education
level; medical benefits cover student medical service, elderly health care voucher scheme, etc.
32
For detailed analysis about progressive taxation, please see Legislative Council Secretariat (2021a).
83.5 Although the Government has markedly increased the expenditures
on social welfare in recent years, poverty and housing have remained the most
concerned issues in society. On poverty, based on the analytical framework of
the poverty line endorsed by the Commission of Poverty, there were still
474 000 poor households in 2019 after recurrent cash intervention. 33
In particular, for households without members in employment (i.e. unemployed
households and economically inactive households), child poverty was
particularly acute at over 70% (Figure 4).
3.6 Since 2012, the Government has launched the means-tested Working
Family Allowance Scheme to promote self-reliance. The Scheme targets
households earning not more than 50% median income of economically active
households. For a four-person household with two children, the allowance
amount was up to HK$2,600 per month in 2018, and increased to HK$4,200 in
2020. According to the Hong Kong Poverty Situation Report 2019,
113 600 poor working households met the income and working-hour
requirements of the Scheme. This number is markedly higher than the overall
61 100 households who benefited from the scheme in 2019. The low
participation might be due to a lack of awareness of the Scheme or household
assets being exceeding the specified limit. 34
3.7 Employed persons in poor working households are also characterized
by lower-skilled occupation and lower education level, with 80.5% attaining
upper secondary level or less. To help upskill the workforce, the Employees
Retraining Board has been offering training courses for those with education
level at sub-degree or below. Depending on the income level, the cost of
training can be subsidized at different degrees or waived. In 2018-2019, there
were 58 000 trainees pursuing the skills upgrading courses.
33
The poverty line framework is based on the "relative poverty" concept set at 50% of the median
monthly household pre-intervention income. The framework includes only recurrent cash
measures. According to Census and Statistics Department (2020), if including also non-recurrent
cash measures and in-kind benefits, there were 287 400 households in poverty in 2019. However,
this serves as supplementary information only and detailed analysis on socio-characteristics by
poor household type is not provided.
34
For a four-person household, the household asset limit is HK$548,000, excluding owner-occupied
properties. However, the Hong Kong Poverty Situation Report 2019 states that it is unsure how
many poor working households have exceeded the asset limit.
93.8 Likewise, the elderly poverty rate is the highest among all age groups.
However, the Government indicated that some elderly households had a certain
amount of assets or received support from their children by direct payment.
Since these items are not covered under the current poverty measurement
framework, it is possible that the actual living standard of these elderly has been
underestimated. 35 Indeed, the Hong Kong Poverty Situation Report 2019
estimates that, if the value of these elderly's owner-occupied mortgage-free
housing is converted to monthly receivable life annuity payouts, over 70% of
them would not be living below the poverty line. Yet to encourage employers
to hire elderly workers, the Labour Department has in place an employment
programme with the provision of on-the-job training allowance. The monthly
allowance provided to participating employers is up to HK$5,000 per elderly
employee for up to 12 months.
Figure 4 – Characteristics of poor household groups after recurrent cash
intervention
Poor households
Poor Unemployed Economically All poor All
working households inactive households households
households households
Number of households 154 200 20 300 299 400 474 000 2 611 900
Average household size 3.3 2.5 1.8 2.3 2.7
Median monthly household HK$14,300 HK$4,500 HK$3,700 HK$6,800 HK$28,000
income
Monthly average poverty gap HK$3,800 HK$7,300 HK$4,400 HK4,300 –
• Proportion of children aged 22.8% 14.7% 10.8% 16.4% 14.6%
under 18
(poverty rate of children) (12.3%) (74.5%) (76.5%) (17.8%) –
• Proportion of elders aged 65+ 11.1% 17.2% 57.5% 34.4% 15.4%
(poverty rate of elders) (9.9%) (79.4%) (59.7%) (32.0%) –
Occupation and education of the
employed persons
• Higher-skilled/Lower-skilled 15.9%/84.1% – – 15.9%/84.1% 44.0%/56.0%
• Post-secondary/Upper 19.5%/80.5% – – 19.5%/80.5% 44.4%/55.6%
secondary or less
Housing
• Public rental housing 47.7% 38.2% 34.4% 38.9% 30.6%
• Private housing tenants 8.7% 11.0% 6.1% 7.2% 16.0%
• Owner-occupiers 40.7% 46.8% 55.0% 50.0% 49.8%
• With mortgages/ loans 8.5% 11.1% 4.3% 6.0% 16.0%
• Without mortgages/ loans 32.2% 35.6% 50.6% 44.0% 33.9%
Source: Census and Statistics Department (2020).
35
See GovHK (2021b).
103.9 Poverty alleviation was part of the Government's efforts for fostering
social harmony. Back in 2005, the then Chief Executive remarked in the Policy
Address the importance of social harmony. To promote this in the face of rapid
social change, he committed that the Government would continue to, among
others, make efforts to seriously address the problem of poverty to break the
cycle of inter-generational poverty and take good care of the disadvantaged;
and do the best to maintain the stability of the middle class, with the creation
of a favourable environment for their personal advancement through providing
more learning opportunities and promoting economic development. 36
3.10 Nevertheless, lack of quality and affordable housing has been
considered one of the areas hindering social harmony in recent years. While
the supply of public rental housing has failed to meet the growing demand,
home ownership rate has reduced across every household decile group, except
the lowest decile group (Figure 5). On the other hand, the opposite trend was
seen in tenancy. According to C&SD's household expenditure survey published
in June 2021, private housing cost (mainly rent and management fees)
accounted for the largest part of household expenditures, at 44% on average.
Figure 5 – Socio-economic characteristics by decile group in 2016 and changes
relative to 2006(1)
1st 2nd 3rd 4th 5th 6th 7th 8th 9th 10th Overall
Average domestic 1.5 1.8 2.3 2.7 2.8 3.0 3.2 3.3 3.3 3.2 2.7
household size
Median household 2,780 7,560 12,000 16,490 21,360 28,000 35,000 45,750 62,500 112,300 24,890
income (HK$) (+21%) (+26%) (+33%) (+37%) (+40%) (+44%) (+48%) (+50%) (+49%) (+47%) (+46%)
Population above 51.2 44.6 18.4 14.5 13.3 11.4 10.3 9.1 8.2 7.7 15.7
age 65 (%) (+5.3) (+22.5) (+6.0) (+3.1) (+3.8) (+2.8) (+2.8) (+1.8) (+1.5) (+1.1) (+3.8)
Owner-occupiers (%) 55.2 29.2 27.5 33.6 42.2 48.3 54.3 60.3 66.4 67.7 48.5
(+5.9) (-1.9) (-8.6) (-6.0) (-5.3) (-6.6) (-5.7) (-6.1) (-5.5) (-3.3) (-4.3)
Tenants (%) 37.6 67.2 69.9 63.8 55.3 49.2 43.5 37.3 31.5 30.3 48.6
(-9.7) (-0.2) (+7.3) (+4.5) (+3.9) (+5.3) (+4.5) (+4.8) (+4.3) (+2.2) (+2.7)
Tenure - Public 30.9 54.5 48.3 42.0 37.3 32.9 27.5 19.5 9.0 1.8 30.4
rental housing (%) (-11.5) (-0.2) (+0.9) (-3.2) (-0.3) (+3.7) (+2.5) (+2.5) (-0.3) (-0.8) (-0.7)
Note: (1) Figures in brackets denote changes in percentage points relative to year 2006, except median household
income where the changes represent percentage change.
Sources: Census and Statistics Department (2007) and (2017).
36
See Office of the Chief Executive (2005).
113.11 Many low- and middle-income young households and singletons have
been struggling to meet the basic needs of adequate housing, in the face
of soaring property prices and rentals (Figure 6). 37 According to a
government-funded study on social mobility published in 2016, young people
tended to believe that "their living standard is not fair compared with their
efforts in the job". 38 There is a view that prolonged rise in housing prices amid
close-to-zero interest rate environment has not only eroded housing
affordability, but also widened significantly the wealth gap between home
owners and those who are not.39 However, the Government does not measure
the situation of wealth inequality in Hong Kong.
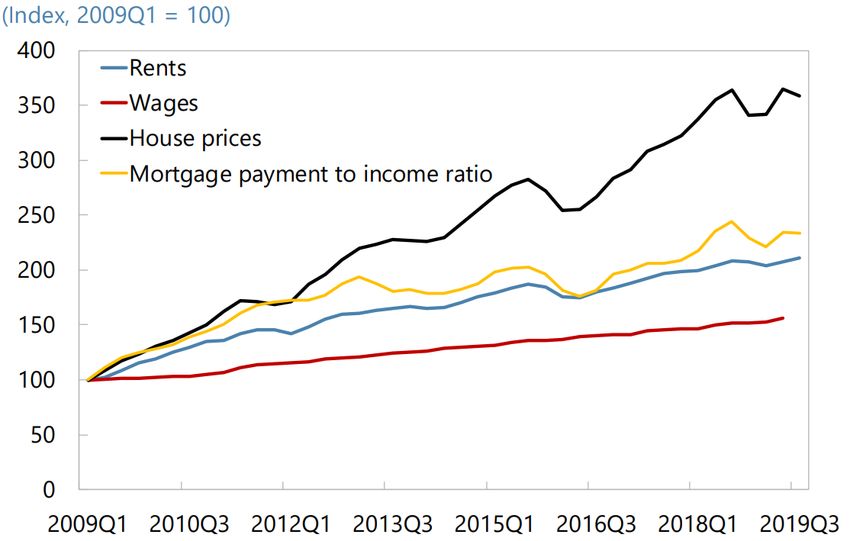
Figure 6 – Trend of Hong Kong's housing prices, rents and wages
Source: International Monetary Fund (2019).
4. Singapore
4.1 With an open capital market and economy like Hong Kong's, Singapore
is not immune to the global trend of rising inequality. The Gini coefficient of
37
For details about housing supply, please see Legislative Council Secretariat (2021b).
38
See Chinese University of Hong Kong (2016).
39
See Hong Kong Monetary Authority (2019).
12market income in Singapore has hovered above 0.40 since 1980, indicating a
high level of inequality by global standard. 40 The evolution of income
inequality in Singapore falls into three main stages (Figure 7). 41 In the early
years of nation-building, basic social welfare was compensated by an
exponential growth in education and job opportunities. In the 1980s,
Singapore's Gini coefficient of market income trended slightly downwards. Yet
income inequality began to worsen in the 1990s to mid-2000s, as globalization,
importation of foreign workers, and the shift towards a knowledge-based
economy had widened the wage gap between skilled and unskilled workers,
leading to more uneven income growth. 42 The Gini coefficient of market
income climbed in the 1990s and 2000s to reach the peak of 0.482 in 2007.
Since the late 2000s, Singapore has taken a more holistic approach to tackling
income inequality by expanding support in housing, employment and
healthcare. In 2020, government transfers and taxes through relief packages
reduced the Gini coefficient from 0.452 to 0.375, the largest decline in nearly
two decades. 43
Figure 7 – Gini Coefficient in Singapore, 1980-2020(1)
0.482
0.472
0.440 0.439
0.452
0.442 0.425
0.410
0.414
0.375
1980 1990 2000 2007 2010 2020
Before taxes and transfers (market income) After taxes and transfers (disposable income)
Note: (1) The Gini coefficient is based on household income from work per household member. The
dotted line gives a rough estimate of the trend as data for particular years are not available.
Data for after taxes and transfers are not available before 2000.
Sources: Singapore Department of Statistics (2021a) and Ministry of Finance (2015).
40
The United Nations regards a Gini Coefficient of 0.4 as the "international alert line" for income
inequality. See UN Habitat (2016).
41
See Ministry of Finance (2015).
42
Ibid and Dhamani (2008).
43
See Department of Statistics Singapore (2021b).
134.2 Singapore does not appear to publish official data on wealth
inequality. According to a global wealth report 44, Singapore's Gini coefficient
of wealth inequality plunged in 2011 after the Global Financial Crisis, and has
fluctuated above 0.7 in the past decade. It trended upward to 0.757 in 2019,
compared with the European average of 0.824 and the world's 0.885.
4.3 Singapore policymakers have been concerned about the impact of
rising inequality on social harmony. In a parliamentary address in 2018, the
Prime Minister reportedly noted: "Singapore's politics will turn vicious, its
society will fracture and the country will wither" if the country allows
inequalities to create "a rigid and stratified social system". 45 He thus
highlighted the need to strengthen social welfare nets and ensure the paths to
upward mobility are available to all. However, rather than using high taxation
to finance welfare transfers, Singapore stresses a low-tax model, which
translates into lower social spending but targeted support for the needy in such
areas as housing, early childhood development and employment, among
others. 46
Affordable housing policy as social stabilizer
4.4 In the 1950s to 1960s, Singapore faced a shortage of housing with
a quarter million population living in overcrowded dwellings with poor
sanitation. Racial and social tensions were high, as ethnic groups were living
in segregated quarters under the British colonial rule. 47 Since Singapore
gained independence in mid-1960, the city-state has made housing policy a
priority. Home ownership is considered a key pillar in Singapore's
nation-building, as it lends support to social mobility and stability by developing
a sense of rootedness among people. 48 Hence, Singapore established the
Housing and Development Board ("HDB"), tasking it with building affordable
public housing with socially cohesive neighbourhoods. Salient features of
Singapore's housing policies are highlighted below:
44
The Global Wealth Databook provides estimates for wealth distribution for over 200 countries.
See Credit Suisse (2019).
45
See The Straits Times (2018).
46
Although Singapore's social spending as a percentage of GDP rose from about 5% in 2007 to 8% in
2017, it still lags behind the OECD average of 20%. See Ministry of Finance (2015), Ministry of
Social and Family Development (2018) and OECD (2020e).
47
See Public Service Division (2015a).
48
See Public Service Division (2015b).
14(a) Home ownership over rental housing: HDB offers both rental
housing and subsidized flats for sale at a significant discount off
the market prices via the Home Ownership Scheme. 49 HDB flats
overall provide homes to 80% of Singapore's resident population,
of which, around 90% own their homes. 50 This compares with a
much lower owner-occupancy rate for public housing in
Hong Kong. 51 On the other hand, public rental housing in
Singapore is intended to meet the housing needs of the most
disadvantaged households, accounting for just 5% of public
housing. 52 Public rental housing is not an alternative to home
ownership, but a stepping stone and safety net for the most needy
families. The standard tenancy period is normally two years
subject to renewal, and the waiting time is generally less than
two months for applicants who are not particular about location 53;
(b) Extensive and progressive home ownership assistance:
Since 1968, the government has allowed people to use a portion
of their Central Provident Fund ("CPF") savings for home
purchase. 54 A host of housing grants are also available for
Singapore citizens (Appendix), with lower-income households
usually receiving larger grants. To illustrate, a first-timer family
earning less than S$1,500 (HK$8,800) per month receives up to
S$80,000 (HK$468,000) for buying a new HDB flat, on top of the
discounted flat price, or up to S$160,000 (HK$937,000) for a resale
HDB flat in the open market; 55 and
49
It is worth noting that a precondition for large-scale development of affordable public housing in
Singapore lies in adequate land supply, which has been made possible through massive land
reclamation and compulsory acquisition from private landowners. For details, please see
Legislative Council Secretariat (2013).
50
See Housing & Development Board (2020b).
51
Around 45% of Hong Kong's population live in public housing, and of those, 34% own their homes.
See Transport and Housing Bureau (2020).
52
Singapore's public rental housing targets households with no other housing option and family
support, and those earning not more than S$1,500 (HK$8,800) per month. Monthly rent starts
from as low as S$26 (HK$152) for a one-room apartment. See Housing & Development
Board (2020a) and Development Asia (2018).
53
See Ministry of National Development (2020) and Legislative Council Secretariat (2013).
54
CPF is Singapore's defined-contribution retirement savings scheme. The maximum amount of
CFP savings that a first-time buyer can withdraw for buying an HDB flat on bank loan is capped at
120% of the purchase price or valuation, whichever is lower. See Money Sense (2018).
55
See Gov.sg (2020a).
15(c) Promoting social integration: Singapore introduced in 1989 the
Ethnic Integration Policy to promote social harmony and foster a
more balanced racial mix in HDB estates. For example, HDB flats
must be allocated and sold based on pre-determined ethnic
quotas to provide opportunities for social mixing among people of
different races, while mixing small and large flats helps ensure the
mixing of income levels. While this quota policy has been
characterized by a government official as "intrusive", it is
considered effective in promoting social integration of different
races and income groups. 56
4.5 In sum, Singapore's pro-home ownership policy has helped
lower-income households to move up the housing ladder, enabling
two generations of Singaporeans to own their homes. A 2018 government
report showed that 87% of those in the bottom 20% by household income
owned their own homes, similar to the overall home ownership rate of 90%,
which is one of the highest in the world. 57 Yet Singapore's housing policy is not
free from concerns. Some are worried that the priority over home ownership
translates into fewer housing resources for public rental tenants and deepens
housing inequality, as reflected by the differences between rental and
ownership flats in terms of quality. 58 There are also concerns that
CPF-financed home ownership risks premature depletion of retirement funds.
In response, the government has pledged to speed up the redevelopment of
older public rental blocks and help family tenants plan for home ownership, and
introduced schemes to let retirees monetize their housing equity in return for a
monthly income for life.
56
See Gov.sg (2020b) and Centre for International Governance Innovation (2018).
57
See Ministry of Social and Family Development (2018).
58
For example, limited space and privacy is cited as a common issue for public housing
tenants since only 1- and 2-room flats are available for rent, while there are HDB flats of various
sizes (1- to 5-room) for sale. It is also argued that short tenancies of two years create insecurity
for tenants. See Channel News Asia (2018).
16Uplifting children/pupils from disadvantaged families
4.6 Early childhood development is another area that has gained traction
in Singapore's policy agenda to mitigate income inequality. The government
has boosted financial support for parents by giving the first-born citizen child a
S$8,000 (HK$46,800) cash gift through the Baby Bonus Scheme. Parents also
receive an initial deposit of S$3,000 (HK$17,500) into the Child Development
Account ("CDA"), a special savings account which can be used for their children's
healthcare and educational expenses. The government then matches every
dollar the parents saved into CDA 59, and makes ad-hoc top-ups to the account
to benefit less well-off families. Besides, extensive subsidies are provided to
keep childcare affordable. Low-income families with working mothers receive
additional subsidies for infant/child care services, on top of universal basic
subsidy. They may pay as little as S$3 (HK$18) per month for full-day childcare
at subsidized preschools. 60
4.7 Other than financial support, Singapore has set up a dedicated agency
to oversee aspects of children's development below the age of seven.
Established in 2013, the Early Childhood Development Agency ("ECDA") is tasked
with ensuring equal access to quality and affordable early childhood
development programmes. An example is KidSTART, an early intervention
programme piloted by EDCA to assist lower-income families and their children,
all the way from pregnancy to preschool. 61 Through partnerships with public
hospitals, KidSTART has qualified professionals making regular home visits and
providing supported playgroup sessions 62 for new parents to hone their skills
about child's growth and nutrition. KidSTART has benefited more than
1 000 children since it started in 2016, and the government plans to expand the
programme to reach another 5 000 children by 2023. 63
4.8 Furthermore, Singapore has strengthened afterschool care for pupils
who lack a conducive home environment. Every primary school in Singapore
has a school-based student centre ("SSC"), where students from disadvantaged
59
The maximum amount of dollar-for-dollar matching from the government is capped at S$3,000
(HK$17,500) for the first child, with the amount increased for subsequent children.
60
See Early Childhood Development Agency (2020).
61
KidSTART is eligible for households (a) with Singapore Citizen children aged up to six; (b) with a
gross monthly income of S$2,500 (HK$14,600) or less; and (c) living in one of the pilot regions.
62
Unlike ordinary playgroups, these sessions are delivered by ECDA-trained facilitators, and are
specially designed to help parents learn about child development and develop parent-child
bonding through purposeful play sessions with their toddlers aged one to three.
63
See Public Service Division (2020).
17families can attend afterschool enrichment programmes such as homework
supervision and recreational activities at a subsidized rate. 64 Similarly,
afterschool programmes such as academic coaching and mentorship activities
are offered at secondary schools to reduce absenteeism and drop-out rates.
In 2020, 27 000 pupils were enrolled in SSCs, while some 3 000 benefited from
afterschool programmes in secondary schools. 65 In part owing to government
efforts to improve the quality of schooling, Singapore consistently ranks top of
the World Bank's Human Capital Index. The 2020 index showed that children
in Singapore could realize on average 88% of their potential productivity when
they grow up, compared with 81% in Hong Kong and 70% in high-income
economies. 66
Workfare as the fourth pillar of social security
4.9 Unlike many advanced economies, Singapore has neither a universal
minimum wage nor targeted unemployment assistance for employees. 67
The government attaches importance to "workfare" – the philosophy that work
is the most appropriate form of social assistance. 68 Workfare serves as the
fourth pillar of social security 69 in Singapore, aimed at assisting vulnerable and
low-wage workers to achieve self-reliance and upward income mobility, thereby
reducing inequality.
4.10 In face of a rapidly ageing population 70 , Singapore has enhanced
support for older jobseekers and the long-term unemployed, who tend to be
more vulnerable in the labour market. Apart from offering financial assistance
64
Children from low-income families (with gross monthly household income of S$4,500 (HK$26,300)
or less) can get up to 98% subsidy of programme fees.
65
See Public Service Division (2020).
66
See World Bank (2020).
67
Singapore adopts the Progressive Wage Model to set out salary floors and progression pathways
for workers in specific sectors such as cleaning and security, but not for other sectors.
Unemployed workers may receive a temporary cash allowance with medical, utilities and other
assistance under ComCare, the means-tested social assistance programme.
68
See Civil Service College Singapore (2007).
69
The other three pillars are home ownership, CPF and healthcare assurance. See Singapore
Budget (2015).
70
Currently, about 60% of Singapore's labour force is 40 years or older, up from 30% in the
1960s-1980s. See Gov.sg (2020c).
18to low-income seniors through the Silver Support Scheme 71 , Singapore has
encouraged elderly and middle-age employment with considerable wage
support. Employers can receive monthly wage support capped at S$3,000
(HK$17,533) for hiring and reskilling non-managerial citizens aged 40 or above
and/or those who are unemployed for six months or more. Whereas in
Hong Kong, there is a monthly allowance of up to HK$5,000 for employers
providing on-the-job training for elderly job seekers aged 60 or above, for six to
12 months.
4.11 Different from Hong Kong where support for low-wage workers is
scattered through various departments and schemes 72, Singapore provides the
bottom 20% low-income workers with targeted support through the one-stop
Workfare programme. 73 Launched in 2007, the Workfare programme consists
of two components:
(a) Workfare Income Supplement ("WIS"): It provides low-income
workers with (i) CPF top-ups for retirement, and (ii) a wage
supplement of up to an extra 30% of their monthly income. 74
The amount of WIS payouts also increases with age to provide
more protection for older workers. For example, an employee
aged 60 or older receives an annual payout of up to S$4,000
(HK$23,400), more than doubled the amount for an employee
aged 35-44. Since inception, WIS has benefited some
930 000 workers, with payouts totalling S$7.8 billion
(HK$45.6 billion); 75 and
(b) Workfare Skills Support ("WSS"): It encourages low-wage workers
to receive upskilling training that leads to better employment
outcomes. Eligible workers receive a training allowance of
71
The scheme provides quarterly cash payment to supplement the retirement income of eligible
seniors aged 65 or above, whose income is in the bottom 20%. The amount of payout ranges
from S$180 to S$900 (HK$1,050-HK$5,230), depending on household income and housing type.
Since the launch of the scheme in 2016, about S$2.2 billion (HK$12.8 billion) have been paid out
to over 180 000 seniors.
72
For example, the Working Family Allowance Office provides an income supplement for low-income
working households. The Employment Retraining Board have provided time-limited training
allowances for the unemployed and underemployed to upgrade their skills amid the COVID-19
pandemic. For more details, see paragraphs 3.6-3.7.
73
To qualify for Workfare, one should be a Singapore citizen; aged 35 or above; have a monthly
income not exceeding S$2,300 (HK$13,400) and live in a property whose annual value does not
exceed S$13,000 (HK$76,000).
74
The worker receives 40% of his/her WIS payment in cash and the remaining in CPF contributions.
75
See Workfare (2021).
19S$6 (HK$35) per hour (up to 180 hours) and a cash reward capped
at S$1,000 (HK$5,800) per year for completing training.
Sponsoring employers are also eligible for absentee payroll
funding at 95% of their employees' hourly basic salary (with no
dollar cap). While WSS may not have an immediate impact on
wages, it invests in human capital through skills training that can
pay off in the form of higher future earnings. Through the
Workfare programme, the bottom 20% of wage earners
reportedly saw their real incomes increase by 40% cumulatively in
the last decade. 76
4.12 Despite the aforementioned efforts to enhance support in housing,
early childhood development and employment support, Singapore has kept the
overall tax burden low to maintain its economic competitiveness. In 2018, its
tax revenue accounted for 13% of GDP, less than half of the OECD average. 77
Nevertheless, Singapore has vowed to increase the progressivity of its tax
regime to enhance redistribution. For example, it has raised personal income
taxes for the highest earners to 22%. Singapore's property tax is also
progressive in nature, with tax rates ranging from 10% to 20% for vacant and
rented properties. 78 There are currently no wealth taxes in Singapore,
although the government has noted that there is scope to further review such
taxes to meet the growing social spending needs. 79
5. New Zealand
5.1 In New Zealand, income inequality after taxes and transfers, as
measured by the Gini coefficient, hovered between 0.25 and 0.35 in the
last three decades (Figure 8). During the late 1980s to the mid-1990s, there
had been a rapid and significant rise in income inequality, largely as a result of
76
See Ho and Tan (2020).
77
See OECD (2020d).
78
Property tax in Singapore is a tax on property ownership, which applies also to owner-occupier
residential properties, at lower progressive rates. In addition to property tax, rental income from
properties is also subject to income tax. Whereas in Hong Kong, property tax applies only to
rental properties at a flat rate of 15%. Owner-occupier residential properties are not subject to
property tax. See Inland Revenue Authority of Singapore (2021) and GovHK (2021a).
79
See Ministry of Finance (2021).
20reduction in tax rates and social benefits, as well as wage setting reform. 80
Since the mid-1990s, income inequality had exhibited a fairly flat trend. The
volatility after 2010 was due partly to the impact of the global financial crisis and
associated economic downturn and recovery. According to its government,
taxes and transfers have reduced the Gini coefficient by 20%-22% during 2003
to 2013. In the latest estimates, the reduction has narrowed slightly to
18%-19% in 2017 and 2018.
5.2 On wealth inequality, New Zealand conducted its first survey on
household wealth in 2015 and the second one in 2018. Based on the survey
findings, 70% of household net worth was concentrated in the top 20% of
households. The net worth of the richest 20% of New Zealand households has
risen 29% since 2015, reaching a median of NZ$1.75 million (HK$9.73 million)
(Figure 9). Wealth assets comprised predominantly owner-occupied housing
and investments in other real estate and financial assets. 81
Figure 8 – Trend of income inequality in New Zealand(1)
0.55
0.45
0.401
Gini
(2018)
0.35
0.327
(2018)
0.25
0.15
1981 1986 1991 1996 2001 2006 2011 2016
Note: (1) The data in the above table covers the population from age 18 to 65.
Source: Ministry of Social Development (2019b).
80
In 1991, New Zealand abolished the traditional system of centralized wage fixing. Since then,
labour has been treated as a marketable service and the wage as a market price, agreed freely
between employers and individuals or groups in decentralized contract negotiations. See
Wolfgang (1995).
81
See Stats NZ (2018).
21Figure 9 – Median net worth by household net worth quintile
NZ$ ('000)
2,000 2015 2018
1,750
1,500 1,356
1,000
709
561
500
289 340
97 97
8 9
1st 2nd 3rd 4th 5th
Household net worth quintile
Source: Stats NZ (2018).
5.3 The causes of income and wealth inequality in New Zealand are
considered to be mainly due to wage inequality, increasing housing costs, and
unequal educational outcomes. 82 Especially, when income inequality is
higher, the opportunities for economic advancement are considered more
unequally distributed among children. Recognizing this, the New Zealand
government has attached high importance to supporting people into work and
ensuring income adequacy of families with children. In particular, the policy of
Working for Families ("WfF") introduced in 2004 was considered effective in
narrowing the income inequality. 83
Raising income of low-to-middle households
5.4 The WfF package was introduced during 2004 to 2007 by the Ministry
of Social Development as a reform to the former family assistance schemes.
The initiative supports working-age parents in low and middle-income families
to seek and stay in employment, by ensuring that they are financially better off
82
See Carey (2015) and New Zealand Council of Christian Social Services (undated).
83
See The Treasury (2009).
22from working. 84 There are mainly three types of financial support, which are
income-tested rather than asset-tested:
(a) Family Tax Credit85: it is a weekly payment accessible by all low
and middle-income families with dependent children, regardless
of whether the parents are working or not. For a household with
two dependent children, the maximum subsidy is currently at
NZ$204 (HK$1,130) per week. The annual income threshold is
currently NZ$42,700 (HK$236,560), beyond which the amount of
subsidy will progressively reduce;
(b) In-Work Tax Credit: it is an additional weekly payment for working
parents, provided that they are not receiving other welfare
benefit. Households with two dependent children are eligible to
receive up to NZ$72.5 (HK$402) a week. As part of the response
to COVID-19, the work-hour requirement is now lifted; and
(c) Minimum Family Tax Credit: it is a top-up payment for low-wage
families with dependent children. The payment ensures
after-tax family income reaching at least NZ$588 (HK$3,270) a
week, on condition that one or both parents in a two-parent family
work a minimum of 30 work hours a week. The guaranteed
income is more than the amount of benefits that are paid to
eligible job seekers.
5.5 At the time of introduction, the WfF package was expected to account
for 4.4% of total government spending. 86 The bulk of money was paid to
families below the median and especially to those well below it. 87 According
to a study, it was estimated that after the reform in 2007, a family with
two children earning NZ$15,000 (HK$83,500) a year was entitled to WfF benefits
exceeding 100% of the earnings; a family with the same structure earning
NZ$25,000 (HK$139,100) a year would be entitled to 46% of the earnings. 88
84
See Welfare Expert Advisory Group (2018).
85
Though the benefits are labelled as "tax credit", they are nothing related to tax payment by
families. Yet it is processed and paid through the Inland Revenue Department.
86
See St. John et al. (2008).
87
See Ministry of Social Development (2019b).
88
See Johnson (2005).
23However, earnings were subject to income tax, at marginal rates from 15% to
21% 89, so the take-home amount was reduced.
5.6 After completion of the reform, households in the lowest 40% income
groups saw their income increase by 13%-17%, effectively reducing the income
gap between high income and low income households. 90 The share of children
living in poverty had dropped by eight percentage points. In 2018, the WfF
package was further enhanced as part of the government's effort to reduce child
poverty. It is estimated that 385 000 families with dependent children will on
average receive an additional NZ$75 (HK$416) per week. Meanwhile, the
government has introduced a "Best Start" scheme to provide a universal
non-means-tested weekly payment for new born babies in the first year of the
baby's life. The benefit will continue in the second and third years for low- and
middle-income families on a means-tested basis. Based on the financial
account in FY2018-2019, WfF related assistance accounted for nearly 10% of the
New Zealand government's transfer payments and subsidies, the second largest
expenditure item after retirement income support. 91
Labour market policies to promote employment
5.7 Besides family income support, New Zealand has pursued various
active labour market policies, with one of the aims being to achieve equity, by
"helping job seekers who are more disadvantaged to more fairly share the
amount of the employment available in the economy". Apart from efforts on
job matching and training, since 2012, the government has been providing wage
subsidies under the Flexi-wage Scheme to support employers to hire people
who are at risk of long-term unemployment, or disadvantaged in the labour
market due to, for example, a lack of education and training. The level of
subsidies is generally provided at NZ$276 (HK$1,500) a week, for a total of 24 or
36 weeks, covering also the costs of training, mentoring and/or in-work
89
This was based on the period from 2000 to 2008, and applied to income level not more than
NZ$38,000 (HK$211,400).
90
See Ministry of Social Development (2010).
91
New Zealand has long put in place the pay-as-you-go retirement income system, known as
New Zealand Superannuation ("NZS"), which features universal access by all citizens or permanent
residents aged 65 or above, irrespective of their income or assets. In 2018-2019, superannuation
expenditures accounted for 52% of total transfer payments and subsidies of the New Zealand
government. Due to ageing population and public opposition to pension reform, its government,
after extensive public debate, established in 2001 the New Zealand Superannuation Fund to
partially prefund the future cost of the pension benefits. See The Treasury (2019) and Ministry
of Social Development (2019b).
24support. Employers are required to pay at least the minimum wage and
continue the employment after the benefit has ended. A total of
40 167 Flexi-wage subsidy applications were approved between July 2014 and
June 2020. 92
5.8 The latest available information indicated that flexi-wage expenditures
accounted for 5%-8% of total expenditures on employment assistance between
2012-2013 and 2015-2016. The scheme is considered to have significant
positive impacts, with the generation of NZ$7 (HK$38) benefits for every dollar
invested. 93 According to an evaluation report conducted by the government,
various active labour policies have contributed to a very low proportion of
long-term unemployment in New Zealand. Levels of up-skilling and retraining
by those already in work are also amongst the highest in the OECD countries.
However, unemployment rates and incomes of youth and ethnic minorities are
found to be poorer than the rest of the population, like the situation in many
other economies. 94 According to the same report, the government is
conducting a range of education reviews, including on vocational training and
ethnic education, with a view to developing a long-term and adaptive
education/skills approach to supporting these young cohorts. 95
Easing the burden of high housing costs on low-income households
5.9 The New Zealand government recognizes that housing affordability is
an important contributor to well-being. To ease the rental burden of
low-income households, the New Zealand government provides public rental
housing, the rental of which is income-based, generally at 25% of the household
income. If the household income is higher than the income threshold,
additional rent will be charged. Income-based rent may be more equitable to
tenants compared with a flat amount. However, in New Zealand, public rental
housing rent is capped at the market rent, 96 meaning that high income
households at most pay the market rent. Yet, tenants may be required to
92
See Beehive (2021). Amid the COVID-19 situation, the New Zealand government has committed
to injecting NZ$311 million (HK$1.69 billion) in 2021 to expand employment support.
93
See Ministry of Social Development (2019a).
94
Indeed, compared with other OECD countries, New Zealand has a high proportion of young people
who leave school early and do not achieve basic secondary school-level qualifications.
95
See Welfare Expert Advisory Group (2019).
96
It is calculated as 50% of the amount over the income threshold. Where the rent so calculated is
more than the actual market rent price for the property, the tenant only pays the market rent
amount.
25move out if they no longer meet the eligibility, which is reviewed every three
years.
5.10 As for low-income people including young singles renting a flat or
house in the private market, they may be supported through a rental subsidy
known as Accommodation Supplement. 97 To qualify for this benefit, the
accommodation costs must be above a certain rental threshold, which differs
according to the type of housing tenure, number of dependent children, etc. 98
The amount of rental subsidy is calculated based on geographical location,
family size, accommodation cost, income and accommodation type; and is
subject to a ceiling. According to an impact study conducted by the
government, during September 2016, recipients were on average paying
NZ$266 (HK$1,480) a week for housing rental, of which 31% was subsidized by
Accommodation Supplement. 99 Though benefited over 192 000 recipients,
the scheme has been criticized as not very effective in relieving the burden of
high housing costs on low-income households, partly because part of the
subsidy is shifted towards landlords. 100 Due to continued rent inflation in
New Zealand, many private tenants have reportedly been in rental stress even
with the subsidy. Government expenditure on this accommodation benefit is
not negligible. It was projected to exceed 0.5% of GDP in FY2018-2019. 101
Helping households get on the home ownership ladder
5.11 Housing assets, nevertheless, often constitute a major part of wealth
and a cause for wealth inequality in society. According to the government
statistics, the fourth and fifth quintiles of New Zealand households accounted
for 33.3% and 40.2% of the owner-occupied housing assets respectively
(Figure 10). The top quintile even held 64.8% of the other real estate assets.
97
Accommodation Supplement can be used to cover mortgage and boarding cost, but the average
weekly subsidy rate is lower than that for rental. According to Ministry of Social
Development (2017), about two-thirds of the recipients were renting.
98
See Ministry of Social Development (undated).
99
See Ministry of Social Development (2017).
100
See Carey (2015).
101
See OECD (2019).
26You can also read