Firms' participation in the COVID-19 loan programme - Lucas Marc Fuhrer, Marc-Antoine Ramelet, Jörn Tenhofen - Swiss ...
←
→
Page content transcription
If your browser does not render page correctly, please read the page content below
Firms‘ participation in the COVID-19 loan programme
Lucas Marc Fuhrer, Marc-Antoine Ramelet, Jörn Tenhofen

SNB Working Papers
25/2020
Legal Issues

DISCLAIMER

The views expressed in this paper are those of the author(s) and
do not necessarily represent those of the Swiss National Bank.
Working Papers describe research in progress. Their aim is to
elicit comments and to further debate.

COPYRIGHT©

The Swiss National Bank (SNB) respects all third-party rights, in
particular rights relating to works protected by copyright (infor-
mation or data, wordings and depictions, to the extent that these
are of an individual character).

SNB publications containing a reference to a copyright (© Swiss
National Bank/SNB, Zurich/year, or similar) may, under copyright
law, only be used (reproduced, used via the internet, etc.) for
non-commercial purposes and provided that the source is menti-
oned. Their use for commercial purposes is only permitted with
the prior express consent of the SNB.

General information and data published without reference to a
copyright may be used without mentioning the source. To the
extent that the information and data clearly derive from outside
sources, the users of such information and data are obliged to
respect any existing copyrights and to obtain the right of use from
the relevant outside source themselves.

LIMITATION OF LIABILITY

The SNB accepts no responsibility for any information it provides.
Under no circumstances will it accept any liability for losses or
damage which may result from the use of such information.
This limitation of liability applies, in particular, to the topicality,
accuracy, validity and availability of the information.

ISSN 1660-7716 (printed version)
ISSN 1660-7724 (online version)

© 2020 by Swiss National Bank, Börsenstrasse 15,
P.O. Box, CH-8022 Zurich
Firms’ participation in the COVID-19 loan
                   programme∗
                Lucas Marc Fuhrer, Marc-Antoine Ramelet and Jörn Tenhofen

                                            December 28, 2020

                                                   Abstract

           This paper analyses the determinants of firm participation in the Swiss COVID-19 loan
       programme, which aims to bridge firms’ liquidity shortfalls that have resulted from the pan-
       demic. State guaranteed COVID-19 loans are widely used by Swiss firms, with 20% of all
       firms participating, resulting in a sizeable programme of 2.4% of GDP. We use a complete
       firm-level dataset to study the determinants of firm participation. Our results can be sum-
       marised as follows. First, participation was largely driven by the exposure of a firm to
       lockdown restrictions and to the intensity of the virus in the specific region. Second, we
       show that less liquid firms had a significantly higher probability of participating in the pro-
       gramme. Third, we find no clear evidence that firm indebtedness affected participation in
       the programme and no evidence that pre-existing potential zombie firms participated more
       strongly in the loan programme. Fourth, we show that the programme reached younger and
       smaller firms, which could be financially more vulnerable as they are less likely to obtain
       outside finance during a crisis. Overall, we conclude that given its objective, the programme
       appears to be successful.

       JEL Classification: D22, H81
       Keywords: COVID-19, loan programme, guarantees, firm behaviour

   ∗
    We thank Romain Baeriswyl, Roman Baumann, Petra Gerlach, Oliver Gloede, Carlos Lenz, the participants of
the research seminar at the Swiss National Bank as well as an anonymous referee for very helpful and constructive
comments. Moreover, we are grateful to Marius Faber, Maı̈lys Korber, Christoph Meyer, Christoph Odermatt,
Kejo Starosta, Markus von Allmen, and Reto Wernli for help with the data. The various datasets used in this paper
were kindly provided by the State Secretariat for Economic Affairs, the Federal Statistical Office, the Institute
of Financial Services of the Lucerne University of Applied Sciences and Arts, and the Faculty of Business and
Economics of the University of Basel. The views, opinions, findings, and conclusions or recommendations expressed
in this paper are strictly those of the authors. They do not necessarily reflect the views of the Swiss National
Bank. The Swiss National Bank takes no responsibility for any errors or omissions in, or for the correctness of,
the information contained in this paper. Corresponding author: Jörn Tenhofen, E-Mail: joern.tenhofen@snb.ch

                                                       1

                                                       1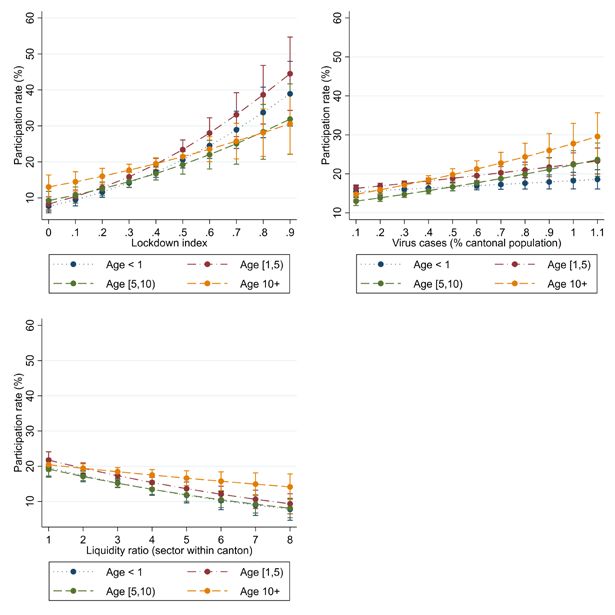
1       Introduction
Aside from its impact on public health, the COVID-19 pandemic caused a major economic
shock. Governments reacted with a series of large-scale economic measures, ranging from short-
time work schemes to credit support facilities. In Switzerland, the COVID-19 emergency loan
programme was one of the key measures used to address the economic fallout of the pandemic.
The Federal Council announced the programme on 25 March 2020 and stated the following ob-
jective: “Last Friday, 20 March 2020, the Federal Council presented a comprehensive package
of measures to cushion the economic impact of the coronavirus pandemic. Bridging credit facil-
ities should provide companies with sufficient liquidity to cover their current overheads despite
turnover reductions associated with the new coronavirus.”
    This paper studies the key determinants of firm participation in the COVID-19 loan pro-
gramme. The aim of our analysis is to assess whether the loan programme can be considered
successful given the objective stated by the government. Additionally, we evaluate whether the
programme comes with potential negative side effects. Understanding why firms chose to partici-
pate in the programme is important for at least two reasons. First, the success of the programme
can be evaluated. Second, lessons can be learned for potential future loan programmes.
    Participation in the COVID-19 loan programme was sizeable, as 20% of all firms participated
in this programme comprising a guaranteed loan volume of 2.4% of annual GDP. Participation is
even more sizeable when considering the fact that approximately 60% of all small and medium-
sized enterprises (SMEs) in Switzerland were debt-free prior to the crisis. The COVID-19 loan
programme enabled firms to receive a government-guaranteed bank loan quickly (usually within
one business day) and with a minimum of bureaucracy. Firms could easily obtain the loan,
and the requirements were minimal. As loans are guaranteed by the government and banks
can refinance the loans at the central bank, loan supply was perfectly elastic. Because of this,
whether a firm took a COVID-19 loan purely reflects loan demand. Loan conditions were also
favourable and included a 100% guarantee and an attractive interest rate of 0% in the first year
for small loans, as well as a rather long loan maturity of at least 5 years.1
    We analyse firm participation in the COVID-19 programme by estimating a binary response
model.2 Our analysis focuses on the following questions: First, we evaluate whether a firm’s
exposure to lockdown restrictions and to the virus intensity in the specific region can explain its
participation in the loan programme. Second, we assess whether firms with a weaker liquidity
position had a higher participation rate. Likewise, we analyse whether participation is higher
for more indebted firms and whether it is particularly more so for pre-existing potential zombie
firms, i.e. firms with a relatively low profitability and high indebtedness before the pandemic hit.
Finally, we document whether the loan programme reached potentially more vulnerable firms,
such as younger and smaller companies. To address these questions, we build a comprehensive
firm-level dataset combining various data sources. In particular, we match the complete set
    1
    These are the conditions as originally announced and effective until the end of the application period.
    2
    In that sense, we focus on the extensive margin and not the intensive margin of the programme. We focus
on the former, as we can better separate demand and supply effects for the participation decision, as explained
in Section 3.

                                                      2

                                                      2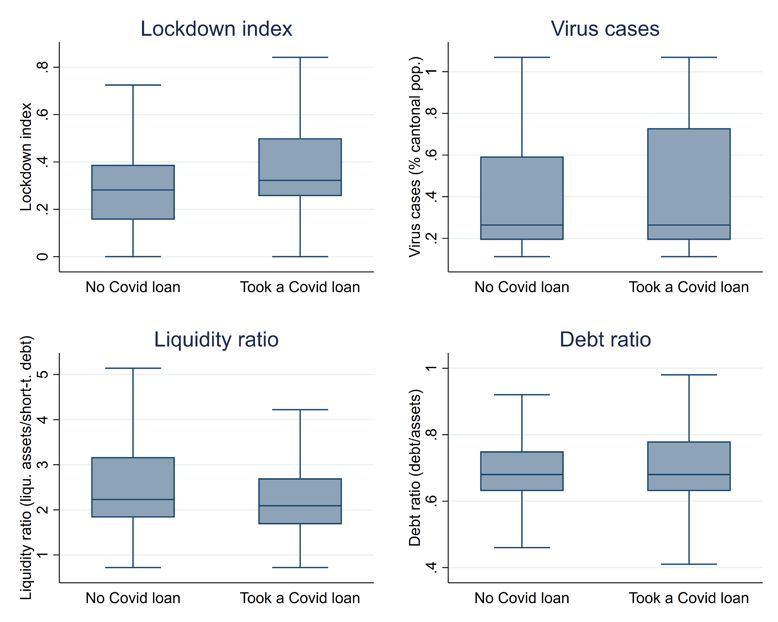
of firms in Switzerland from the register of commerce (BUR database) to the list of firms
participating in the loan programme (JANUS database).
    Our findings can be summarised as follows. First, we show that participation in the loan
programme is positively related to the exposure of a firm’s activity to lockdown restrictions
as well as to the regional virus intensity, which we use as a proxy for households becoming
more cautious. Second, we show that firms with an ex ante weaker liquidity position had a
higher probability to participate in the programme. Importantly, these effects are economically
meaningful; we can explain a wide range of firm participation rates. Hence, we find supporting
evidence for the loan programme’s success in reaching its objective. Third, we find no clear
evidence that firm indebtedness affected participation and no evidence that participation was
higher for firms with an ex ante relatively low profitability and high indebtedness, i.e., what we
identify as zombie firms.3 Fourth, we show that the programme reached younger and smaller
firms. Hence, the loan programme reached firms for which access to outside finance is typically
more challenging – particularly during a crisis. Overall, our results are robust to different
specifications and rely on several measures that exploit variation across sectors, regions and
firm sizes.4
    Our contribution to the literature is two-fold. First, our paper contributes to the growing
literature that studies the COVID-19 loan programme in Switzerland. For instance, firm par-
ticipation in the programme is analysed by Brülhart, Lalive, Lehmann, and Siegenthaler (2020)
and Zoller-Rydzek and Keller (2020). Our paper complements these studies, which are based
on surveys, by instead using a complete firm-level dataset. Moreover, we use what we believe
to be exogenous measures of lockdown restrictions at a relatively granular level. Additionally,
we explicitly account for firms’ liquidity position, which seems to be an economically important
driver for participation in the loan programme. Second, we contribute to the more general lit-
erature that studies government-guarantee loan programmes and their implications for the real
economy. The existing literature points overall to the usefulness of such programmes in reducing
informational costs and in dampening the effects of adverse aggregate shocks.
    Section 2 describes the related literature, while Section 3 describes the COVID-19 loan
programme, makes an international comparison and provides an overview of firms in Switzerland.
Section 4 presents the data that are used in the empirical analysis in Section 5. Finally, Section 6
provides the conclusion.
   3
      In the literature, there are various definitions of zombie firms. We had to resort to a definition, which can
actually be operationalised based on the data we have available. In particular, we only have a cross-section of
group-wise (headcounts within sectors) indicators of indebtedness and profitability. The lack of a time-series
dimension, for instance, excludes the possibility to apply the OECD-definition of a zombie firm, which is as
follows: “Zombie firms are defined as firms aged ≥ 10 years and with an interest coverage ratio < 1 over three
consecutive years.” (see, e.g. OECD Economic Policy Paper No. 21, December 2017: “Confronting the zombies:
policies for productivity revival”).
    4
      In general, participation could result from a precautionary motive, where the financing is not actually needed
to make current payments but just held for precautionary reasons. However, the trigger for that precautionary
behaviour should still be the determining factors explained in the main text.

                                                         3

                                                         3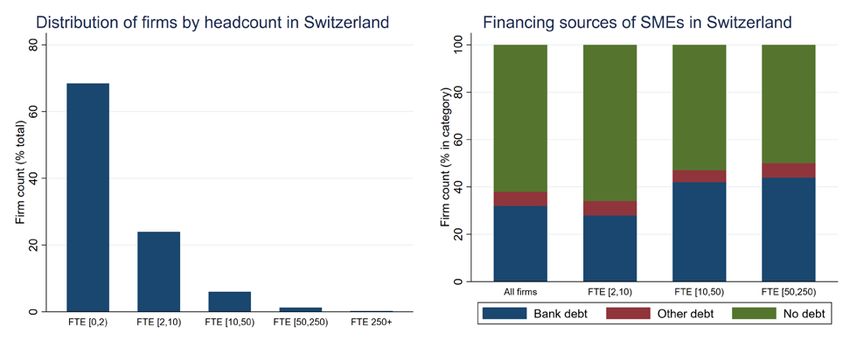
2       Literature review
Research on the Swiss COVID-19 loan programme is at this stage only nascent. We are aware of
three contributions. Similar to our paper, two studies (Brülhart, Lalive, Lehmann, and Siegen-
thaler (2020) and Zoller-Rydzek and Keller (2020)) investigate the determinants of participation
in government support programmes during the pandemic. In addition to the loan programme,
both papers also consider other support programmes, such as short-time work. In contrast to
our analysis, which is based on a comprehensive dataset of all eligible firms, these two contri-
butions are based on surveys. More specifically, Brülhart, Lalive, Lehmann, and Siegenthaler
(2020) use a survey of 1,011 self-employed workers and SMEs conducted in mid-April 2020.5 The
participants in that survey were asked about the importance and their participation in three
government programmes, namely: (1) short-time work, (2) income replacement for self-employed
workers and small business owners, and (3) COVID-19 loans. Programme participation is then
related to different variables measuring the extent of the lockdown as well as firm-specific eco-
nomic (e.g., employment), financial (e.g., debt and profit ratio) and other (e.g., linguistic region,
age and education of respondent) variables. Brülhart, Lalive, Lehmann, and Siegenthaler (2020)
find that lockdown restrictions are positively related with the usage of both short-time work
and COVID-19 loans. However, they find that lockdown restrictions are less important for ex-
plaining the participation in the loan programme than for explaining the participation in other
government support programmes. Moreover, they find that previously indebted firms are more
likely to take up COVID-19 loans.
    Another study based on survey evidence is the one by Zoller-Rydzek and Keller (2020), who
build a theoretical model and test the resulting empirical implications by using data from the
ZHAW managers barometer survey.6 In line with their theoretical model, they find that the
pre-pandemic business situation seems to be an important driver of programme participation.
In particular, firms in a worse ex ante situation are less likely to take out a COVID-19 loan.
Zoller-Rydzek and Keller (2020) conclude that there seems to be no evidence that the programme
creates zombie firms. In their model, a zombie firm is a firm that survives the crisis thanks to
the programme but cannot repay the debt.
    The third contribution by Kaufmann (2020) does not study the determinants of programme
participation but investigates its effect on the macroeconomy. In particular, he analyses the
impact of the COVID-19 loan programme on unemployment. He finds that higher loan supply
due to the programme indeed reduces unemployment, with approximately CHF 400,000 of loan
volume needed to save one job.
    Apart from the aforementioned more specific literature on the Swiss COVID-19 loan pro-
gramme, our paper relates to different strands of the literature relevant for government credit
guarantee programmes.7 The unifying questions in this regard are why such a programme might
    5
     The respondents were taken from an online pool of LINK, which provides a nationwide, representative sample
of 115,000 individuals.
   6
     In the first half of April 2020, 205 managers of Swiss companies were asked about their business situation
and their response to the pandemic.
   7
     Public credit guarantee programmes have existed at least since the beginning of the 20th century. According
to Green (2003), more than 2,000 such schemes existed in almost 100 countries.

                                                       4

                                                      4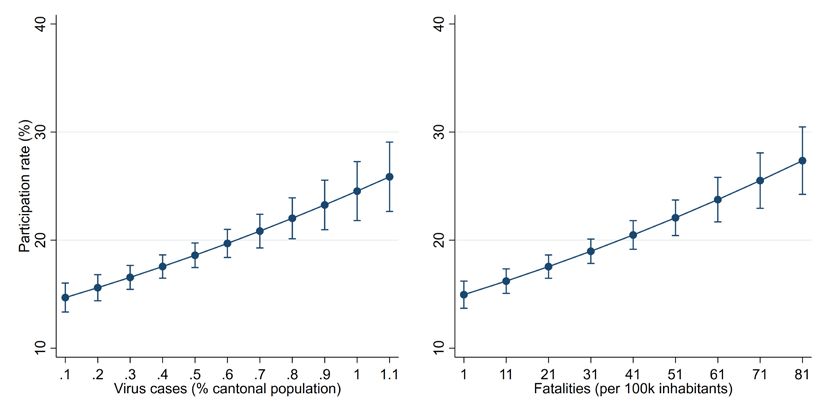
be needed, which firms should be targeted and whether these programmes have been effective.
    First, why might a government-guarantee loan programme be needed? There is a broad liter-
ature on financial frictions, where informational asymmetries or moral hazard and thus agency
problems potentially lead to a more difficult access to credit.8 For instance, in the financial
accelerator literature in the spirit of Bernanke and Gertler (1989) and Bernanke, Gertler, and
Gilchrist (1999), agency costs lead to a premium on external finance and deadweight losses,
while models along the line of Stiglitz and Weiss (1981) feature equilibrium rationing. Crisis
situations such as the COVID-19 pandemic could lead to a sudden increase in uncertainty and
informational problems, in turn increasing the difficulty to access credit or even leading to ra-
tioning. In such a situation, there might be a welfare-improving role for state guarantees as
an insurance mechanism.9 By overcoming informational problems, the state as an entity with
“deep pockets” basically acts as insurance for the entire economy.
    Second, for whom might a government-guarantee loan programme be set up? The findings
in the literature indicate that SMEs are particularly affected by informational issues and hence
face problems in obtaining external finance. Gertler and Gilchrist (1993, 1994) study the impact
of a cash squeeze on firms of different sizes and find that small firms, in contrast to larger ones,
cannot use borrowing as easily to smooth cash-flow shocks. Small firms typically have less
outside options of external finance. Chodorow-Reich (2014) use the more recent episode of the
2008/09 financial crisis to show that SMEs have more difficulty accessing credit during credit
crunches, which in turn has negative implications for the real economy. Thus, it is not surprising
that credit guarantee programmes are among the most common forms of government support
for SMEs, as indicated, for instance, in Beck, Klapper, and Mendoza (2010).10
    Third, have credit guarantee programmes worked? Overall, previous governmental loan
guarantee programmes are typically found to be successful. This evaluation is carried out along
several dimensions. For example, Cowling (2010) finds that small firms in the UK are indeed
affected by credit rationing and that this situation can be addressed by a guarantee programme.
In another study on the UK, Gonzalez-Uribe and Wang (2020) investigate the effect of a loan
guarantee introduced during the 2008/09 financial crisis on firm outcomes. They find that
the economic benefits significantly outweigh the costs of the programme. Riding and Haines
(2001) and Riding, Madill, and Haines (2007), using the case of Canada, study the question of
“additionality” of a credit guarantee programme. They ask whether such a programme leads
to the extension of additional loans, which otherwise would not have been granted, or whether
there is just a substitution of private loans by publicly guaranteed ones. Using credit scoring,
they show that firms that otherwise would not have obtained a loan (based on the credit score)
are able to secure a loan via the programme. Finally, Saito and Tsuruta (2014) analyse the costs
in terms of adverse selection and moral hazard of these programmes. Their findings indicate
   8
     Seminal contributions in this literature are, for example, Bernanke and Gertler (1989), Bernanke, Gertler, and
Gilchrist (1999), Carlstrom and Fuerst (1997), Holmström and Tirole (1997), and Kiyotaki and Moore (1997).
   9
     See, for example, Honohan (2010). Offering a public loan guarantee programme can be undertaken for other
reasons as well, for instance, to kick-start a lending process by allowing participants to gain experience, which
might be important for the economic development of a particular sector, region or country.
  10
     Beck, Klapper, and Mendoza (2010) survey 76 credit guarantee schemes in 46 developed and developing
countries.

                                                        5

                                                        5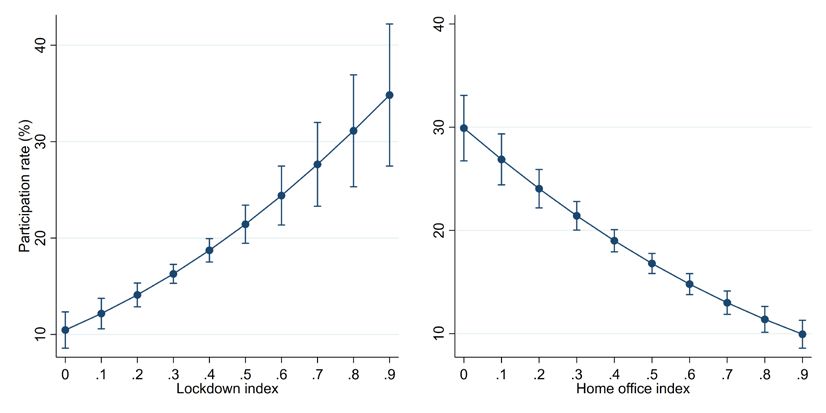
the presence of both costs. Based on the rich public credit guarantee landscape in Japan, they
show that banks with more risky customers offer more guaranteed loans. Moreover, they find
that firms with guaranteed loans are more likely to default. This finding is more prevalent for
guarantee programmes covering 100% than for programmes covering 80%.

3        COVID-19 loan programme
On 26 March 2020, the Swiss federal government launched the COVID-19 loan guarantee pro-
gramme to provide firms quick access to loans that could be used to bridge potential liquidity
shortfalls resulting from the pandemic.11 The programme was open to the vast majority of firms
residing in Switzerland; only firms with an annual turnover of more than CHF 500 million and
firms founded after February 2020 could not participate.12
    Under the programme, companies could receive from their bank government-guaranteed loans
for an amount up to 10% of their annual turnover (up to a maximum of CHF 20 million) and with
a maturity of five years.13 A first loan tranche of up to CHF 500,000 is fully guaranteed by the
government. Larger companies could apply for a second tranche (called COVID-19 plus loan),
of which the federal government would guarantee 85%. The pricing of the loan programme was
attractive, as the first (second) tranche has an interest rate of 0% (0.5% for the guaranteed part)
in the first year.14 Access to the loans was quick and easy since lending took place via existing
client-bank relationships; the money was typically disbursed within a day. Firms did not need
to have a pre-existing credit history or credit relationship – a bank account was sufficient. The
period for submission of applications for the programme lasted from 26 March to 31 July 2020.
    Nonetheless, there are a couple of requirements that may reduce the attractiveness of COVID-
19 loans for some firms. For instance, the loan cannot be used to finance investments (other than
replacement investments). Participating firms are not allowed to reimburse capital contributions
or pay dividends. Moreover, COVID-19 loans cannot be used to refinance private or shareholder
loans or repay intra-group loans. Likewise, there are restrictions on internal (potentially in-
ternational) transactions.15 Firm participation was hence not obvious ex ante, particularly for
larger and more complex firms.
    Normally, credit creation reflects both loan supply and demand. However, we exploit the
fact that due to the structure of the programme as well as the coordinated and complementary
policy measures taken, participation exclusively reflects firms’ demand for emergency loans.
Loan supply – in terms of programme participation – was almost perfectly elastic.16 Indeed,
    11
     Apart from the federal COVID-19 loan programme, there have been loan support programmes set up by
individual cantons and joint programmes, such as the one offered for start-ups. Quantitatively, the federal
programme is by far the largest programme.
  12
     There are approximately 300 firms (out of a total of more than 600,000) with an annual turnover of more
than CHF 500 million.
  13
     In case of hardship, the original emergency decree establishing the programme allowed for an extension of
another two years.
  14
     For COVID-19 plus loans, each bank can fix its own interest rate for the remaining 15% of the loan. For both
tranches, the emergency decree stipulated that the interest rate for the subsequent years would be determined by
the government and would reflect market conditions.
  15
     See Art. 6, COVID-19-Solidarbürgschaftsverordnung.
  16
     Loan supply in terms of the loan volume, however, is also determined by supply-side factors, such as the

                                                       6

                                                       6
banks had basically no incentive to reject loan applications: (i) credit risk was small or even
non-existent due to the government guarantee;17 (ii) liquidity risk was also absent due to the
SNB’s COVID-19 refinancing facility (CRF), by which banks can refinance the guaranteed part
of the loan at the SNB policy rate by posting the guaranteed part as collateral;18 (iii) regulatory
constraints on banks’ balance sheets were also relaxed via the Swiss financial market supervisory
authority’s (FINMA) temporary adjustment of the leverage ratio calculation and at the request
of the SNB, the deactivation of the countercyclical capital buffer by the federal government.19
    The Swiss programme has not been the only loan guarantee programme established in the
face of the pandemic. Tables A1-A3 in the Appendix give an overview of loan guarantee pro-
grammes set up internationally at the same time as the Swiss programme. Most programmes
focus on SMEs as the most relevant beneficiaries. Similar to the maturity of the loans in
Switzerland, a maturity of five years is quite typical. The Swiss programme closes, however,
at an unusually early date. Most programmes were initially intended to be open until at least
the end of 2020. The Swiss conditions in terms of the share of the loan guaranteed and interest
rate are more on the generous side. An interest rate of 0% without a guarantee fee for the first
tranche is at the lower end of the range and the guarantee of 100% is of course at the upper end.
However, there are a couple of other countries that also offer such a comprehensive guarantee.
Given these attractive terms, it is probably not surprising that the usage of the Swiss programme
is considerable relative to GDP in international comparison. The Swiss programme is similar in
magnitude to the US programme and to the two programmes in the UK combined. Only the
programmes in Hong Kong and Italy are larger in relation to GDP.
parameters of the programme. For instance, the loan volume is capped at 10% of a firm’s revenue. The potential
total loan volume hence varies across cantons. This fact is exploited by Kaufmann (2020) in his analysis of the
macroeconomic employment effects of the programme.
  17
     Few COVID-19 standard loan applications were initially rejected. Anecdotal evidence points to the fact that
rejections were due to incorrectly filling in the application. Credit risk considerations may be more relevant for
COVID-19 plus loans, but rejection rates seem to have been low also in this segment.
  18
     The CRF was established simultaneously and in coordination with the COVID-19 loan programme. By mid-
June, banks drew via the CRF liquidity amounting to almost two-thirds of the entire COVID-19 credit limits.
  19
     The FINMA temporarily excluded central bank reserves from the leverage ratio calculation.

                                                           7

                                                       7
Figure 1: Firms in Switzerland and financing sources
Figure 1. Sources: FSO (BUR) and SECO. Notes: The graph on the left uses our set of firms, discussed in
Section 4. The graph on the right uses data from a study commissioned by SECO and conducted by the Lucerne
University of Applied Sciences and Arts in the fall of 2016. The survey covers 1,922 SMEs in Switzerland (with
less than 250 employees) and assesses their financing forms, sources and conditions. “Bank debt” typically consists
of mortgages and credit lines, whereas “Other debt” contains, for example, bonds and trade credit.
The COVID-19 loan programme focuses on SMEs and aims to provide quick access to bank
financing. Both of those aspects are motivated by the structure of firms in Switzerland and
their financing sources. Figure 1 presents the distribution of firms’ size in terms of the number
of full-time equivalent employees (graph on the left) and their financing (graph on the right).
The distribution of firms’ size illustrates the importance of small firms for the Swiss economy.
More than 92% of firms have less than 10 employees, and over 99% have less than 250 employees,
thereby fitting the definition of an SME used by the Swiss State Secretariat for Economic Affairs
(SECO).20 Given the importance of smaller firms, it is not surprising that the programme focuses
on SMEs. Moreover, an examination of the typical financing structure of firms in Switzerland
indicates that a majority of SMEs do not have debt: 62% of all SMEs in Switzerland were debt-
free before the pandemic. This phenomenon is most pronounced for the smallest firms with 2-10
employees: two out of three of those firms are exclusively equity financed. This share drops with
increasing firm size: 50% of SMEs with 50-250 employees have some form of debt outstanding.
Across all firm sizes, the dominating type of outside financing is bank debt.
Overall, the data indicate that a significant share of Swiss SMEs do not have an established
credit relationship. This might be a problem if firms suddenly have to bridge liquidity shortfalls
by outside finance (e.g., bank debt) and could be particularly problematic for young firms that
have existed for only a couple of years. A government loan guarantee programme is a potential
solution to this problem, as it eliminates credit risk and solves potential informational problems
between borrowers and lenders, which otherwise might impede the extension of credit.
20
Those firms in that 99% of firms employ two out of three employees in Switzerland. For more information,
please visit the following link: SME Portal.
8
84 Data
4.1 Construction of dependent variable
Our analysis is based on firm-level data comprising all firms in Switzerland. We bring together
two datasets: on the one hand, data from the entire registry of commerce are used (Betriebs- und
Unternehmensregister, short BUR); on the other hand, data from the registry of all the COVID-
19 loans, recorded by the guaranteeing organisations, are used (called the JANUS database).
The entries in the two datasets are matched through a unique firm identifier, which is available
in both registries. We work with an anonymised version of the matched dataset, but we do know
which firms have a COVID-19 loan and which firms do not. Both datasets are cross-sectional
and correspond to a snapshot at the end of the COVID-19 loan programme.21 Table 1 provides
descriptive statistics.
Our cleaned dataset contains 675,111 active firms in Switzerland that were eligible for a
COVID-19 loan. This set of firms is obtained by selecting entities from an initial 1.87 million
entries available in the BUR registry. We excluded entries that are not active, currently in
liquidation, entities without economic activity (such as investment and legal purpose vehicles) as
well as domestic and foreign government entities (such as public administrations). We kept data
on financial companies as well as companies operating in the primary sector (i.e. agriculture)
as those companies were also eligible for a COVID-19 loan. The exclusion criteria are further
detailed in Appendix A.1. The BUR data also provide other information, such as the economic
sector22 , firm size (in terms of full-time equivalent employees), firm age (via the entry date in
the registry), or the canton (there are 26 cantons in Switzerland) in which the firm is legally
registered.23 Our firm count is close to the available count of 656,364 active firms reported by
the Federal Statistical Office (FSO) in January 2020. Similarly, our set of firms replicates well
the economic sector, region, headcount and legal form distributions that are made available by
the FSO (see Appendix A.1).
21
The September version of JANUS that we use reflects the loans outstanding as of 31 July 2020 (when the
COVID-19 loan programme ended). The BUR reflects Swiss firms as of 17 August 2020.
22
We build sectoral categorisations based on the General Classification of Economic Activities (NOGA) two-
digit codes.
23
Unfortunately, the BUR registry does not contain financial information such as cash holdings or leverage.
Hence, we resort to group-level financial variables in the analysis (see Table 1). Similarly, we do not have
information on non-COVID-19 loans that a firm might have secured. This lack of information is important unless
the decision to request a non-COVID-19 or a COVID-19 loan occurs at random, which is most likely not the case
for larger firms. Subsection 5.5 shows that our results are robust when excluding larger firms.
9
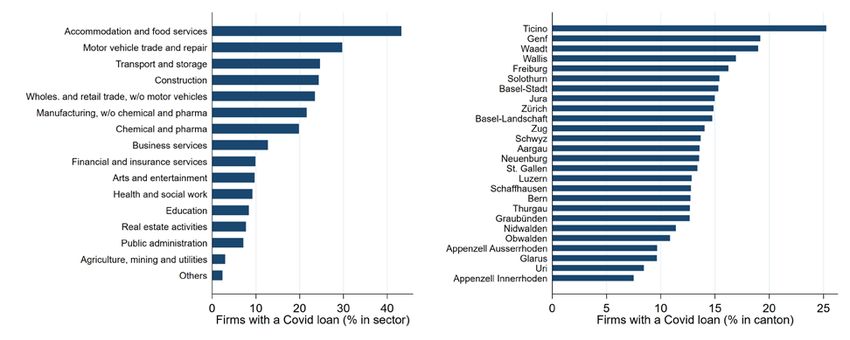
9Figure 2: Firm participation, by economic sector and canton
Figure 2. Sources: FSO (BUR), JANUS and own calculations. Notes: The economic sectors are obtained by
aggregating the more granular NOGA two-digit codes. The sector Others contains the activities of households
as employers, the production activities of households for their own use, and the activities of extra-territorial
organisations and bodies.
According to the latest estimate at the time of writing, there were 135,261 standard COVID-
19 loans outstanding when the programme ended. This corresponds to about 20% of our firm
count. We are able to match 103,605 loans to the BUR, as some loans were already paid
back in full and not all loans have a unique firm identifier (see Appendix A.1). Hence, we
obtain by construction a lower participation rate of approximately 15%. Our data set shows
that firms participated in the loan programme across sectors and cantons. Figure 2 shows the
participation rates by broad economic sectors and cantons. Overall, participation across cantons
is characterised by a considerable heterogeneity. By sector, the dispersion is even larger. The
sector with the highest participation rate is accommodation and food services, with 43%. The
lowest sectoral participation rates, below 3%, are found in agriculture, mining and utilities and
in others (consisting of household-related production and extra-territorial organisations). Across
cantons, the participation rate ranges between 7% (Appenzell Innerrhoden) and 25% (Ticino).
4.2 Explanatory variables
The figures described above reflect how firms that operate in different sectors and regions were
affected by the crisis. However, an unanswered question is what drove participation in the loan
programme? We bring answers by considering three broad dimensions of loan demand, namely,
a firm’s sensitivity to the lockdown, its exposure to the virus intensity, and the firm’s initial
financial conditions. The different measures that we use are summarised in Table 1. Because
these measures are not available at the firm level, we use group variables from various data
sources; each firm is then matched to its corresponding group.
10
10Table 1: Descriptive statistics
Groups Firms Mean Std. Dev. Min Max
Participation (yes/no) - 675’111 0.15 0.36 0.00 1.00
Lockdown index (sectors within cantons) 469 674’423 0.30 0.17 0.00 0.97
Home office index (sectors within cantons) 469 674’423 0.51 0.27 0.00 1.00
Short-time work (sectors within cantons) 1’118 671’713 0.20 0.15 0.00 3.50
Retail payments (sectors within cantons) 540 344’859 -0.42 0.67 -1.00 4.22
Virus cases (in canton) 26 675’111 0.40 0.28 0.11 1.07
Fatality cases (in canton) 26 675’111 21.01 22.08 0.00 88.90
Cash ratio, mean (headcount groups within sectors) 45 234’067 0.28 0.08 0.11 0.41
Liquidity ratio, mean (sectors) 63 530’351 1.29 0.35 0.19 2.57
Liquidity ratio, mean (sectors within cantons) 560 471’257 2.70 1.51 0.72 51.08
Liquidity ratio, median (sectors within cantons) 560 471’257 1.66 0.54 0.51 5.43
External financing (headcount groups within sectors) 18 214’489 0.39 0.11 0.28 0.67
Debt ratio, mean (sectors) 44 483’976 0.66 0.14 0.29 1.04
Debt ratio, mean (headcount groups within sectors) 54 230’420 0.41 0.17 0.21 0.87
Debt ratio, mean (sectors within cantons) 561 471’728 0.72 0.26 0.35 6.73
Debt ratio, median (sectors within cantons) 561 471’728 0.68 0.10 0.31 0.97
Profit margin, mean (headcount groups within sectors) 40 218’682 0.09 0.06 0.02 0.32
Profit to int. ratio, mean (headcount groups within sectors) 31 160’133 0.36 0.31 0.07 1.71
Table 1. Sources: FSO (BUR), JANUS, Faber, Ghisletta, and Schmidheiny (2020), SECO, SNB, FOPH, FSO,
CompNet. See main text for details. Notes: The table shows the number of groups available for the variable, and
the corresponding number of firms to which the group variable can be matched. The mean, standard deviation,
minimum and maximum are computed for the matched firms. See main text for the variable definitions.
Sensitivity to the lockdown. Loan demand may reflect the abrupt fall in revenue implied
by lockdown restrictions. Assessing a firm’s sensitivity to the lockdown is not straightforward:
hence, we resort to four different measures. To ensure exogeneity, our preferred measures are a
lockdown index, which relies on physical proximity, and a home office index, which relies on the
possibility to perform tasks at home. Faber, Ghisletta, and Schmidheiny (2020) built the index
by using the Occupational Information Network (ONET ) survey, which asks workers questions
about the level of physical proximity that is required in their occupation. Individual survey an-
swers are translated into an index that is available for economic sectors within cantons, yielding
a total of 469 groups. The index ranges between zero and one. A value of zero corresponds
to little physical proximity needed, whereas a value of one indicates that physical proximity is
essential to the worker’s tasks. The lowest index values are found in sectors, such as financial
and insurance activities, or agriculture, whereas the highest values are found in sectors such as
accommodation or construction.24 Faber, Ghisletta, and Schmidheiny (2020) also compute a
home office index with the ONET survey. The home office index can be used as an alternative
measure of lockdown restrictions.25 In contrast to the lockdown index, the home office index
captures the possibility for a worker to perform tasks at home. A value of zero indicates that
tasks cannot be operated remotely (for instance, a machine is needed), whereas a value of one
24
During the lockdown, essential sectors (such as food stores, pharmacies, petrol stations, banks or railway
stations) were allowed to operate freely. These sectors are assigned an index value of zero by Faber, Ghisletta,
and Schmidheiny (2020). The index value is also set to zero for workers who report working in the public sector.
25
Both indices capture the lockdown restrictions similarly. The correlation coefficient between the two indices
is -0.65 when using household observations for which the indices can be mapped.
11
11implies that the worker can readily perform tasks from home. The two indices are exogenous in
the sense that a firm cannot easily (or rapidly) alter the work conditions that require physical
proximity for production or that allow workers producing from their homes. We complement
the indices by using two indicators of business activity. First, the proportion of firms that use
the Swiss short-time work scheme (or Kurzarbeit) in a given sector within a canton is obtained
from SECO numbers relative to the firm counts in our cleaned dataset.26 This gives a total of
1,118 groups. Second, we obtained data on retail card payments in Switzerland from Kraenzlin,
Meyer, and Nellen (2020). Based on this data, we compute the year-on-year percentage change
in transaction values for April 2020. Comprising 540 groups, the data are available for sectors
within cantons.
Exposure to virus intensity. Loan demand may also reflect the severity of the pandemic
situation per se. The cautious behaviour of households (i.e., going less to shops or buying more
online) may increase with the severity of the pandemic. In particular, the degree of behavioural
adjustment is likely to be regional. To measure the intensity of the virus spread, we use the
cumulative cases (as a percentage of the cantonal population) in the canton in which the firm
is legally registered. Additionally, we use the cumulative number of fatalities due to the virus
(expressed per 100,000 inhabitants). Both measures are as of 13 July for the 26 Swiss cantons
and are obtained from the Federal Office of Public Health (FOPH).
Initial financial conditions. Loan demand may depend on a firm’s initial financial condi-
tions. We measure liquidity and debt conditions via several group-level variables. The broader
group-level liquidity variable that we have is a cash to assets ratio obtained from the CompNet
survey of Swiss firms. The average ratio in 2017 is available across five headcount groups within
nine sectors, representing a total of 45 groups. Additionally, we use a more granular liquidity
ratio made available for the year 2018 by the FSO. The liquid asset to short-term debt ratio is
not only available for 63 sectors but also for sectors within cantons (totalling 560 groups). The
corresponding mean and median ratios were computed by the FSO for groups that contained
a minimum of five surveyed firms. External financing is measured in two ways. First, we use
the proportion of firms with external financing (both bank and non-bank debt) in 2016. The
data was made available for broad headcount groups within sectors and totals 18 groups.27 .
Second, we measure indebtedness via the debt to asset ratio. We use the average ratio in 2017
from CompNet; this ratio is available for 44 of the 45 headcount-sector groups mentioned above.
Additionally, we use the more granular debt ratios made available for the year 2018 by the FSO.
The FSO debt ratio is available for 54 sectors but also for sectors within cantons (totalling
561 groups). Again, the corresponding mean and median ratios were computed by the FSO
for groups that contained a minimum of five surveyed firms.28 Last, we use two measures of
firm profitability for further analysis in Subsection 5.3: the profit margin as well as the profit
26
The SECO short-time work numbers are as of April 2020.
27
See SECO (2016), Studie zur Finanzierung der KMU in der Schweiz .
28
The FSO computed the equity (after profit distribution) to total assets ratio; we recovered the debt ratio by
taking the complement, i.e., the residual to 100%.
12
12to interest payment ratio. The 2017 average ratios across headcount groups within sectors, are
available from CompNet.
Figure 3: Main explanatory variables by firm participation
Figure 3. Sources: FSO (BUR), JANUS, Faber, Ghisletta, and Schmidheiny (2020), SECO, SNB, FOPH, FSO,
CompNet. See main text for details. Notes: The distribution of the variables’ values by firm participation is
shown. The liquidity and debt ratios are at the sector-canton level. The median is boxed around the 25th (Q1) and
75th (Q3) percentiles. The whiskers are the most extreme values found in Q3+1.5(Q3-Q1) and Q1-1.5(Q3-Q1),
respectively.
Figure 3 shows the distribution of the main explanatory variables by firm participation in the
loan programme. Firms with a COVID-19 loan tend to operate in sectors (within cantons) that
are more sensitive to the lockdown; both the median and the inter-quartile range of the lockdown
index for firms participating in the loan programme are higher than those for firms that do not
participate in the loan programme. Likewise, firms that participate in the programme tend to
be located in cantons with more virus cases. The liquidity ratio of participating firms is lower
than that of non-participating firms. This holds true not only for the median liquidity ratio,
but also for the inter-quartile range, which is narrower. By contrast, firm indebtedness seems
to be similar across firm participation. While the debt ratio’s 75th percentile is higher for firms
with a COVID-19 loan, the median does not differ from that of firms without a loan.
13
135 Empirical analysis
To disentangle the different determinants of loan demand, we consider a standard logit model:29
exp(x i β)
yi = + εi ,
1 + exp(x i β)
in which yi is a binary variable that indicates the participation of firm i in the loan programme
and xi is a vector of explanatory variables. It contains the measures described above as well
as dummies that control for firm size (via full-time equivalent headcount group buckets) and
firm age (via firm age group buckets). By doing so, we (partly) control for firms’ individual
characteristics. Our model permits the assessment of each determinant of loan demand, while
keeping constant the other factors. As indicated in the regression output tables, standard errors
are clustered at the level of the demand determinant (which is a group variable) that enters the
regression. The coefficients of a logit regression represent the log of the odds ratio, which is hard
to interpret quantitatively. Our discussion of the regression results hence focuses on the sign
and the significance of the coefficients, which determine the direction of the effect. We assess
the magnitude of the corresponding economic effects by plotting predictive margins.
Next, we present our regression results. The main regression results are described in Sub-
section 5.1, which discusses the firms’ sensitivity to the lockdown, their exposure to the virus
intensity as well as their ex ante liquidity and indebtedness positions. Based on the various mea-
sures detailed in Section 4, more detailed results are then provided for the lockdown and virus
intensity variables (Subsection 5.2) as well as for the financial variables (Subsection 5.3). Addi-
tionally, we discuss whether participation in the programme is higher for zombie firms. Next,
we use the heterogeneity in our dataset in greater detail to assess whether the loan programme
also reached the potentially more vulnerable firms, i.e., small and young firms (Subsection 5.4).
Finally, additional robustness checks are reported in Subsection 5.5.
5.1 Main results
Our main regression results are reported in Table 2. Columns (1)-(4) provide estimates focusing
on one main variable; these estimates are cross-checked in a multivariate specification in Column
(5). First, we show that participation in the loan programme is affected significantly by a firm’s
sensitivity to the lockdown (Column 1). Firms in sectors within cantons associated with a more
stringent lockdown index value have a higher probability of participation. This finding is also
true for firms in cantons with more virus cases (Column 2), which indicates that changes in
customer behaviour were not just determined by lockdown restrictions but also by the fear of
the virus. Additionally, we provide empirical support that the loan programme reached less
liquid firms. Indeed, our estimates show that firms with a lower ex ante liquidity ratio have
a higher probability to participate in the programme (Column 3). Finally, there is no clear
evidence that more indebted firms have a higher participation rate (Column 4). In the next
29
We obtain similar regression results for probit models. As the fitted log-likelihood of the logit model slightly
outperforms the probit model, we use logit models for our estimations.
14
14subsections, we use different measures to assess the robustness of these findings.
Table 2: Main results of the binary response model
(1) (2) (3) (4) (5)
Part.(y/n) Part.(y/n) Part.(y/n) Part.(y/n) Part.(y/n)
Lockdown index (sectors within cantons) 2.16∗∗∗ 1.75∗∗∗
Virus cases (in canton) 0.74∗∗∗ 0.73∗∗∗
Liquidity ratio, mean (sectors within cantons) -0.13∗∗∗ -0.11∗∗∗
Debt ratio, mean (sectors within cantons) -0.06 -0.21
Headcount dummies Yes Yes Yes Yes Yes
Age dummies Yes Yes Yes Yes Yes
Constant Yes Yes Yes Yes Yes
Observations 674423 675111 471257 471728 471211
Log-likelihood -277189.69 -281379.54 -215653.56 -216776.51 -212285.10
Table 2. Notes: Logit model. The dependent variable is a firm-level binary variable that indicates firm partici-
pation in the loan programme. Standard errors are clustered at the level of the grouped variable of interest; in
column (5), clustering is at the sector-canton level of the FSO financial variables. The number of observations
varies depending on data availability of the grouped variables. ***, ** and * denote statistical significance (two-
tailed) at the 1%, 5%, and 10% significance levels, respectively.
5.2 Lockdown and virus intensity
The loan programme aimed to provide liquidity to firms whose turnover was affected by the
coronavirus crisis. To evaluate whether the programme reached that objective, we assess how
participation depends on firms’ exposure to the lockdown restrictions as well as to the regional
virus intensity.
Table 3: Results: Lockdown and virus intensity variables
(1) (2) (3) (4) (5) (6)
Part.(y/n) Part.(y/n) Part.(y/n) Part.(y/n) Part.(y/n) Part.(y/n)
Lockdown index (sectors within cantons) 1.75∗∗∗
Home office index (sectors within cantons) -1.54∗∗∗
Short-time work (sectors within cantons) 3.00∗∗∗
Retail payments (sectors within cantons) -0.08
Virus cases (in canton) 0.73∗∗∗
Fatality cases (in canton) 0.01∗∗∗
Headcount dummies Yes Yes Yes Yes Yes Yes
Age dummies Yes Yes Yes Yes Yes Yes
Other demand determinants Yes Yes Yes Yes Yes Yes
Constant Yes Yes Yes Yes Yes Yes
Observations 471211 471211 470274 247969 471211 471211
Log-likelihood -212285.10 -210736.48 -206940.47 -119304.33 -212285.10 -212051.60
Table 3. Notes: Logit model. The dependent variable is a firm-level binary variable that indicates firm partic-
ipation in the loan programme. The other demand determinants comprise the Table 2 variables (lockdown in-
dex, virus cases, liquidity ratio, debt ratio) excluding the demand determinant shown in the respective columns.
Standard errors are clustered at the level of the grouped variable of interest. The number of observations varies
depending on data availability of the grouped variables. ***, ** and * denote statistical significance (two-tailed)
at the 1%, 5%, and 10% significance levels, respectively.
We find strong evidence that participation depends on a firm’s exposure to the government-
imposed lockdown restrictions. Table 3 reports regression results for the sensitivity of firms to
both lockdown restrictions and regional virus intensity. Columns (1) to (4) show specifications
focusing on the variables measuring lockdown restrictions that were described in Section 4. Our
15
15preferred lockdown restriction variables, namely, the lockdown and the home office indices, are
both statistically significant and have the expected signs. Both the physical proximity required
for production and the possibility to produce from home are inherent to the type of business in
which a firm operates. In that sense, the two corresponding indices are exogenous; firms cannot
easily – or rapidly – alter their sensitivity to the lockdown restrictions. Column (1) shows that
firm participation increases with the lockdown index: a firm (in a sector-canton group) whose
production requires relatively more physical proximity is more likely to participate in the loan
programme. Likewise, Column (2) shows that participation decreases with the home office index.
In other words, participation is higher for firms whose workers cannot execute tasks remotely.
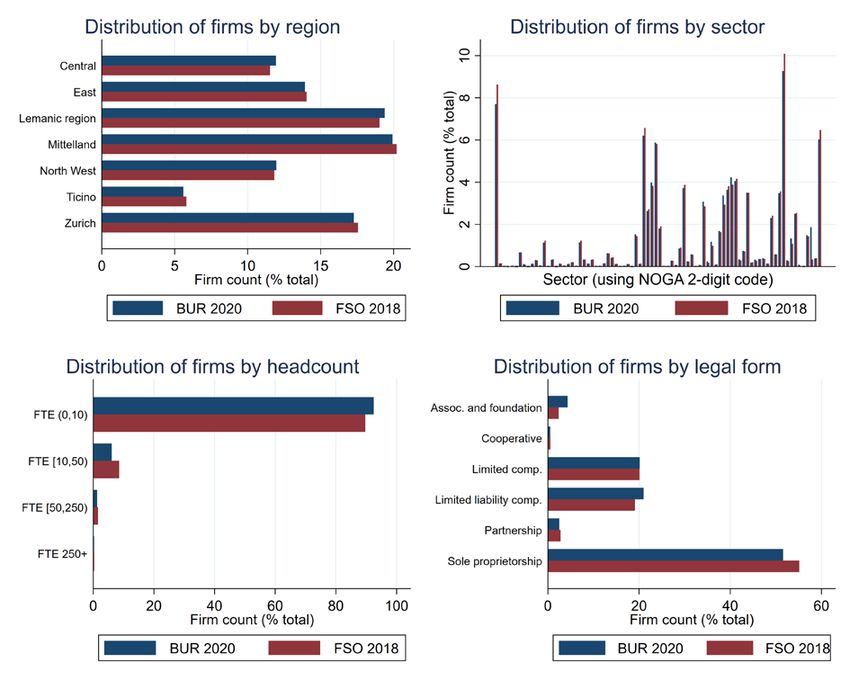
Figure 4: Margins of lockdown measures
Figure 4. Notes: Predictive margins resulting from column (5) in Table 2 are shown. The margins for the home
office index use the same estimation but replace the lockdown index by the home office index. Whiskers indicate
95% confidence intervals.
Importantly, the sensitivity of a firm to lockdown restrictions has a sizeable effect on par-
ticipation. Figure 4 shows the predictive margins of the lockdown and home office indices. The
values observed for the two indices can explain a wide interval of participation rates across sector-
canton groups; this interval ranges between 10% and 35%. Participation in the loan programme
is hence much higher for firms whose production was severely restricted by the lockdown.
These results are in line with the informative, although more endogenous (i.e. simultaneous),
variable of short-time work (see Column 3 in Table 3). Short-time work is a complement to credit
guarantees, as both policy measures alleviate firm’s financial strain that results from lockdown
restrictions. Intuitively, firm participation significantly increases with the use of short-time work.
We find moreover that the year-on-year change in retail card payments in a sector-canton group
is not significantly related to firm participation (see Column 4). Solely measuring the change in
retail card payments – which does neither cover all economic sectors, as indicated by the smaller
sample used in Column (4) nor all payment methods used – does not explain firm participation
16
16in the loan programme.
A higher regional intensity of the pandemic may prompt households to become more cautious,
in turn affecting nearby firms negatively. For instance, people may visit restaurants and shops
less frequently to reduce the probability of getting infected. Indeed, the regional virus intensity
also drives firm participation in the loan programme. In Table 3, Columns (5) and (6) show that
participation significantly increases in both virus cases and fatalities.30 A firm that operates
in a canton that has a relatively high virus intensity is hence significantly more likely to take
a COVID-19 loan.31 Despite being smaller in magnitude than the lockdown effects discussed
above, the virus effect remains economically meaningful. Figure 5 plots the predictive margins
for both the virus cases and fatalities. Cantonal variations in virus intensity are associated with
firm participation rates that vary between 15% and 25%.
Figure 5: Margins of virus intensity measures
Figure 5. Notes: Predictive margins resulting from column (5) in Table 2 are shown. The margins for fatalities
use the same estimation but replace virus cases by fatalities. Whiskers indicate 95% confidence intervals.
5.3 Financial position
Now, we discuss how the ex ante liquidity and indebtedness positions affect firm participation.
Additionally, we evaluate whether the loan programme particularly attracted firms that based
on their ex ante financial situation, were identified as zombies.
The goal of the programme was to provide firms with adequate liquidity. One measure
of success is accordingly whether the programme reached firms with relatively weaker ex ante
liquidity positions. Firms with less liquidity before the pandemic are more likely to end up
30
Depending on the testing regime, fatalities might be a better measure of actual virus intensity. However,
this aspect might be more important in international comparisons, as testing was relatively homogeneous across
Switzerland.
31
As indicated in Table 2, this also holds when controlling for lockdown restrictions (see Column 5). Hence, it
seems that there is a separate effect of virus intensity over and above that of the lockdown.
17
17in a precarious position once the effects of the pandemic have played out. We assess this by
estimating how ex ante liquidity affects firm participation. Table 4 provides regression results
using the various liquidity measures detailed in Section 4. Three out of four coefficients are
statistically significant, and all coefficients have a negative sign. Hence, we find evidence that
firms with lower liquidity ratios have a higher probability of participating in the programme.
The table orders variables by increasing granularity. Column (1) uses the cash ratio based on the
CompNet data. This relatively coarse measure, which uses variations across headcount groups
within sectors (45 groups), is only available for about 30% of the firms in our sample. The effect
of this measure on participation is not statistically significant. In Columns (2)-(4), we use the
more granular measures from the FSO. Column (2) reports the results for the liquidity ratio
at the sector level (63 groups). Columns (3) and (4) use the liquidity ratio at the finer sector-
canton level (560 groups), and this ratio is based on the prevailing average and median ratios,
respectively. For these three more granular measures, the effect of liquidity on firm participation
is statistically significant.
Table 4: Results: Liquidity variables
(1) (2) (3) (4)
Part.(y/n) Part.(y/n) Part.(y/n) Part.(y/n)
Cash ratio, mean (headcount groups within sectors) -0.22
Liquidity ratio, mean (sectors) -0.84∗∗
Liquidity ratio, mean (sectors within cantons) -0.11∗∗∗
Liquidity ratio, median (sectors within cantons) -0.15∗∗
Headcount dummies Yes Yes Yes Yes
Age dummies Yes Yes Yes Yes
Other demand determinants Yes Yes Yes Yes
Constant Yes Yes Yes Yes
Observations 205695 467375 471211 471211
Log-likelihood -117922.97 -208789.85 -212285.10 -212821.58
Table 4. Notes: Logit model. The dependent variable is a firm-level binary variable that indicates firm partici-
pation in the loan programme. The number of observations varies depending on data availability of the grouped
variables. The other demand determinants comprise the Table 2 variables (lockdown index, virus cases, liquid-
ity ratio, debt ratio) excluding the demand determinant shown in the respective columns. Standard errors are
clustered at the level of the grouped variable of interest. The number of observations varies depending on data
availability of the grouped variables. ***, ** and * denote statistical significance (two-tailed) at the 1%, 5%, and
10% significance levels, respectively.
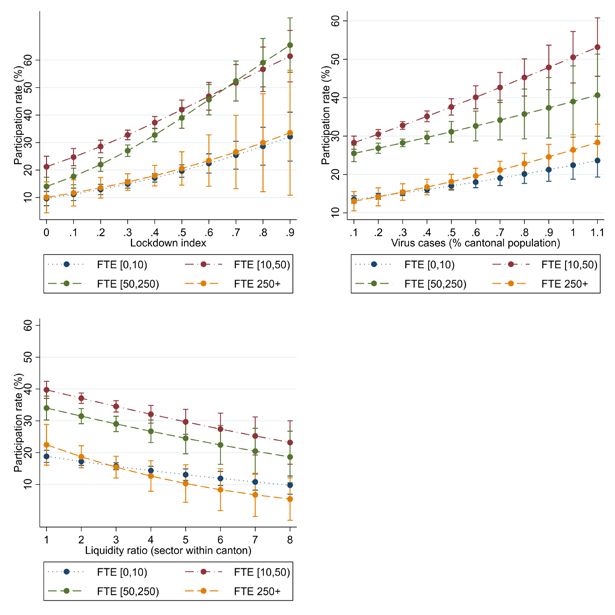
The liquidity position can also explain to a meaningful extent firm participation. To analyse
the magnitude of the effect, Figure 6 plots the predictive margins for the liquidity ratio at the
sector-canton level. The range of liquidity ratios observed in our data yields participation rates
ranging between slightly below 10% to values somewhat higher than 20%. Thus, the effect of
liquidity is comparable in magnitude to that of virus intensity but smaller than the effect of
lockdown measures.
18
18Figure 6: Margins of liquidity measure
Figure 6. Predictive margins resulting from column (5) in Table 2 are shown. Whiskers indicate 95% confidence
intervals.
Next, we discuss the effect of indebtedness on firm participation. Firms with higher leverage
may face difficulties in obtaining additional non-guaranteed loans. Indebtedness may hence be
positively related to firm participation in the loan programme.
Table 5 provides regression results for the indebtedness measures detailed in Section 4. As
similarly done for liquidity, the indebtedness variables are ordered in increasing granularity.
Overall, we find mixed evidence that a firm’s indebtedness affects participation. Three out of
the five indebtedness variables have a positive coefficient, indicating that more indebted firms
tend to have a higher participation rate. However, the coefficient is statistically significant for
only one out of the five measures.
Column (1) in Table 5 shows the results based on the proportion of firms that use external
financing. The coefficient is not statistically significant for this measure, which relies on varia-
tion across 18 headcount-sector groups. By contrast, the effect turns positive and statistically
significant for the average debt ratio across the finer 44 headcount-sector groups used in Column
(2). Column (3) shows that significance drops when using instead the average debt ratio across
sectors, which increases the number of observations considerably. Columns (4) and (5) show
the results for the more granular measures that are at the sector-canton level. When using
these more refined measures, which comprise observations for 561 groups, the debt ratio is not
statistically significant. This finding may imply that less granular variables just reflect sector
specific effects instead of the underlying relationship between indebtedness and participation.
Accordingly, we find mixed results for the effect of indebtedness on firm participation. Signifi-
cance vanishes as the indebtedness measure becomes more granular; hence, we do not illustrate
the magnitude of the effect via predictive margins.
19
19You can also read