FIRE RISK MODELLING FOR KANGAROO ISLAND - BLACK SUMMER 2019-20 FIRES ERICA MARSHALL1, DENIS KULTAEV1, SARAH MCCOLL-GAUSDEN1, ALEX FILKOV1,2 & ...
←
→
Page content transcription
If your browser does not render page correctly, please read the page content below
FIRE RISK MODELLING FOR
KANGAROO ISLAND
Black Summer 2019-20 fires

Erica Marshall1, Denis Kultaev1, Sarah McColl-Gausden1, Alex
Filkov1,2 & Trent Penman1,2

1University   of Melbourne & 2Bushfire and Natural Hazards CRC
RISK MODELLING FOR KANGAROO ISLAND – BLACK SUMMER FIRES SOUTH AUSTRALIA | REPORT NO. 684.2021

  Version        Release history                                    Date

  1.0            Initial release of document                        22/07/2021

 © 2021 Bushfire and Natural Hazards CRC

 All material in this document, except as identified below, is licensed under the
 Creative Commons Attribution-Non-Commercial 4.0 International Licence.

 Material not licensed under the Creative Commons licence:
       •     Department of Industry, Science, Energy and Resources logo
       •     Cooperative Research Centres Program logo
       •     Bushfire and Natural Hazards CRC logo
       •     Any other logos
       •     All photographs, graphics and figures

 All content not licenced under the Creative Commons licence is all rights
 reserved. Permission must be sought from the copyright owner to use this
 material.

 Disclaimer:
 The University of Melbourne and the Bushfire and Natural Hazards CRC advise that
 the information contained in this publication comprises general statements based
 on scientific research. The reader is advised and needs to be aware that such
 information may be incomplete or unable to be used in any specific situation. No
 reliance or actions must therefore be made on that information without seeking
 prior expert professional, scientific and technical advice. To the extent permitted
 by law, the University of Melbourne and the Bushfire and Natural Hazards CRC
 (including its employees and consultants) exclude all liability to any person for any
 consequences, including but not limited to all losses, damages, costs, expenses
 and any other compensation, arising directly or indirectly from using this
 publication (in part or in whole) and any information or material contained in it.

 Publisher:
 Bushfire and Natural Hazards CRC

 July 2021

 Citation: Marshall E, Kultaev D, McColl-Gausden S, Filkov A & Penman T (2021)
 Risk modelling for Kangaroo Island - Black Summer fires South Australia, Bushfire
 and Natural Hazards CRC, Melbourne.

 Cover: Locations on Kangaroo Island where wildfire frequency differed between
 the wildfire only and the prescribed burning burning scenarios. Positive values
 show where the frequency of wildfires was higher in the prescribed burning
 scenario compared to the wildfire only scenario. Negative values show where
 the wildfire only scenario had a higher freuqnecy than the prescribed burning
 scenario and zero indicates no change in the frequency of wildfires.

                                                                           1
RISK MODELLING FOR KANGAROO ISLAND – BLACK SUMMER FIRES SOUTH AUSTRALIA | REPORT NO. 684.2021

TABLE OF CONTENTS
ACKNOWLEDGMENTS                                                                                 4

EXECUTIVE SUMMARY                                                                               5

INTRODUCTION                                                                                    6

METHODS                                                                                         8
Study area                                                                                       8
Modelling approach                                                                               8
Results                                                                                         13

DISCUSSION                                                                                      21

FUTURE RESEARCH                                                                                 24

CONCLUSIONS                                                                                     25

REFERENCES                                                                                      26

                                                               3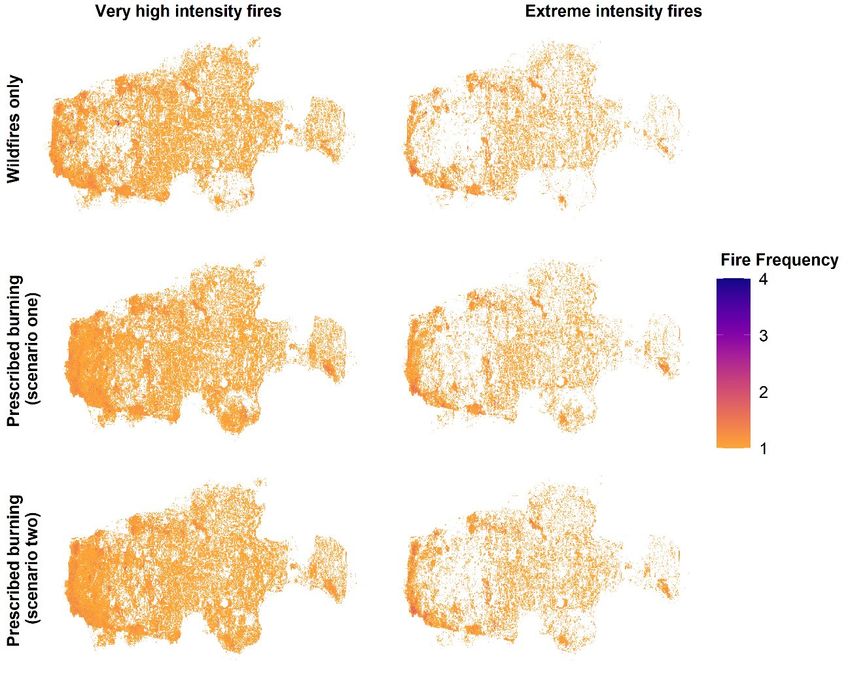
RISK MODELLING FOR KANGAROO ISLAND – BLACK SUMMER FIRES SOUTH AUSTRALIA | REPORT NO. 684.2021

ACKNOWLEDGMENTS
This research was part of the Bushfire and Natural Hazards Cooperative Research
Centre’s Black Summer research program, funded by the Australian Government
and the CRC to investigate key issues from the 2019-20 bushfire season.

                                                               4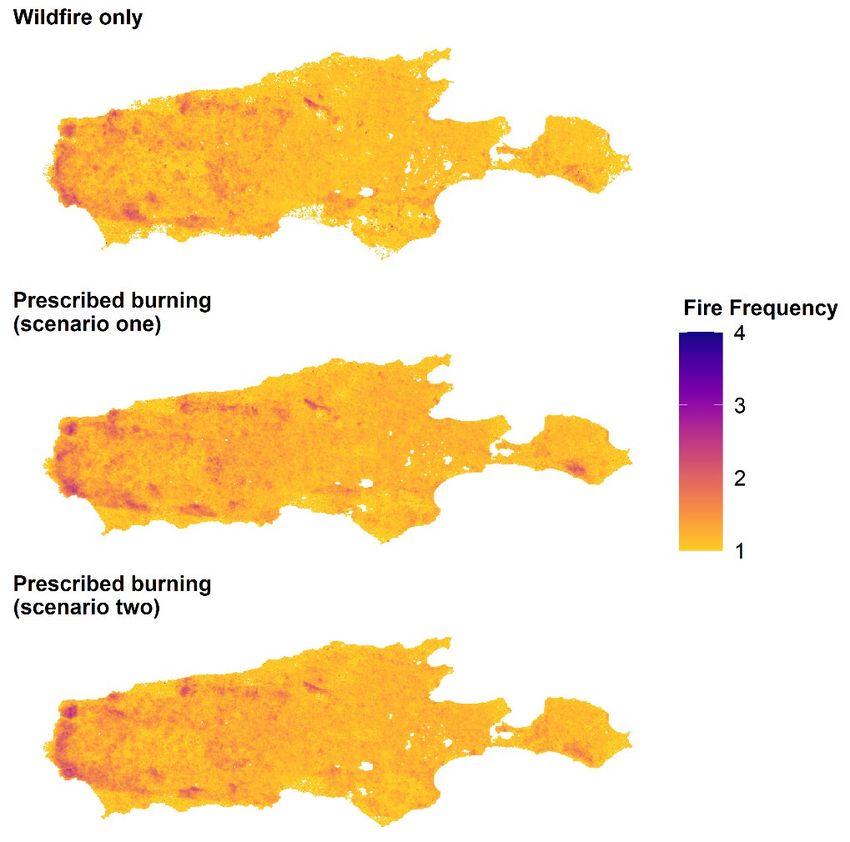
RISK MODELLING FOR KANGAROO ISLAND – BLACK SUMMER FIRES SOUTH AUSTRALIA | REPORT NO. 684.2021

EXECUTIVE SUMMARY
Understanding changing bushfire risks to people, property and biodiversity is a
key knowledge gap in many states and territories across Australia, including
South Australia. In the wake of the 2019/2020 bushfires which had significant
impacts on all three of these values across South Australia, understanding fire risks
and potential fire impacts is crucial for making informed management decisions
into the future. In our study we used a Fire Regime and Operations Simulation Tool
(FROST) to model fire risk on Kangaroo Island over 50 years. We estimated the
impacts of simulated fires on human life, property and biodiversity for three
management scenarios (wildfires only and two prescribed burning scenarios).
We found that prescribed burning resulted in a small decline in the frequency of
wildfires compared to the wildfire only scenario and a lower frequency of both
very high and extreme intensity fires. Despite a lower frequency of fires overall,
the likelihood of very high or extreme intensity fires happening at least once over
50 years increased.
Despite reduced frequency of bushfires during wildfire seasons, exposure to
people and property did not change between scenarios, probably because the
extent of fires remained unchanged. Prescribed burning also resulted in a greater
area burnt before minimum Tolerable Fire Interval (TFI) than wildfires alone. This is
because prescribed burn efforts reduce the age classes of the remnant
vegetation, resulting in the exposure of a larger proportion of vegetation below
minimum TFI during the wildfire season.
These results present a preliminary understanding of fire risk on Kangaroo Island.
The methods developed here could be applied to a range of case study sites in
South Australia and may provide helpful estimates of future fire risk which could
be incorporated into management decisions throughout the state.

                                                               5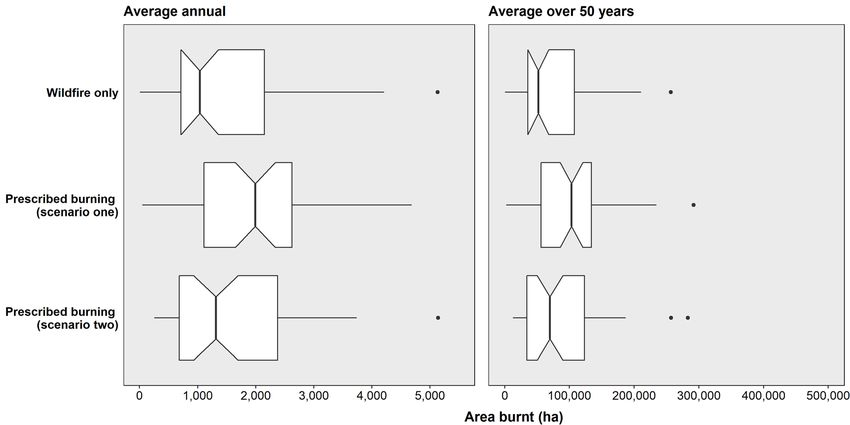
RISK MODELLING FOR KANGAROO ISLAND – BLACK SUMMER FIRES SOUTH AUSTRALIA | REPORT NO. 684.2021

INTRODUCTION
Bushfires present increasingly high risks to human life, property and biodiversity
around the globe (Banks, Knight, McBurney, Blair, & Lindenmayer, 2011; Borchers
Arriagada et al., 2020; R. Bradstock, Penman, Boer, Price, & Clarke, 2014; Higuera
& Abatzoglou, 2021). Understanding and predicting bushfire risk to these assets is
a key knowledge gap in many management jurisdictions around Australia. This
gap in knowledge is only increasing under the impacts of climate change and
predicting fire risk is fundamental for supporting future management decisions.
The 2019/2020 bushfire season in Australia resulted in an unprecedented area of
high-severity fires which impacted ecosystems across south eastern Australia and
had significant impacts on people and property (Collins et al., 2021b; Filkov, Ngo,
Matthews, Telfer, & Penman, 2020). Therefore, it is imperative that the risk of such
megafires reoccurring is predicted into the future and where possible
management actions should mitigate the potential risks to humans and
biodiversity.
Understanding the risks of future fire requires some knowledge of how fire regimes
are likely to shift going forward. Fire regimes are repeated patterns of burning,
characterised by certain fire characteristics such as frequency, intensity, size,
season, type and extent (Archibald et al., 2018; Gill, 1975; Murphy et al., 2013).
Weather, fuel load, vegetation type and human activities can all influence fire
behaviour and fire regimes (R. A. Bradstock, 2010). Changes to natural fire
regimes can be important for influencing species richness and community
composition (Andersen, Penman, Debas, & Houadria, 2009; Penman, Keith, et
al., 2015; Swab, Regan, Keith, Regan, & Ooi, 2012). Inappropriate fire regimes can
have significant long-term consequences for biodiversity (Banks et al., 2011;
Enright, Fontaine, Lamont, Miller, & Westcott, 2014; Penman et al., 2011).
Management agencies often attempt to reduce the risks caused by changing
fire regimes through various management strategies, mostly focusing on fuel
management i.e. thinning, clearing and prescribed burning (H. Clarke, Tran, et
al., 2019; Florec, Burton, Pannell, Kelso, & Milne, 2020).
Previous work has demonstrated that management through fuel treatments can
reduce risks but the placement and strategy of treatments is critical (R. A.
Bradstock et al., 2012; Finney et al., 2007; Penman, Ababei, Chong, Duff, &
Tolhurst, 2015; Penman, Bradstock, & Price, 2014; Plucinski, 2012). Implementing
management actions, such as prescribed burns, can be difficult because they
are costly, and cannot cover all affected areas (Bradshaw et al., 2013; Penman
et al., 2011). Moreover, implementing optimal management strategies to reduce
life and house loss is likely to require a different solution to those aimed at
managing biodiversity (Bentley & Penman, 2017; Driscoll et al., 2016; Penman,
Ababei, et al., 2015; Penman et al., 2011). Identifying appropriate fire
management strategies which protect people and property, as well as
biodiversity, is of critical importance going forward to minimise risks associated
with changing fire regimes.
There are several existing fire simulators which seek to understand the effects of
potential management actions on fuel and fire behaviour. One of the most
commonly used tools for modelling fire behaviour is PHOENIX RapidFire (hearafter
PHOENIX ; Penman et al., 2015; Tolhurst, Shields, & Chong, 2008). This tool

                                                               6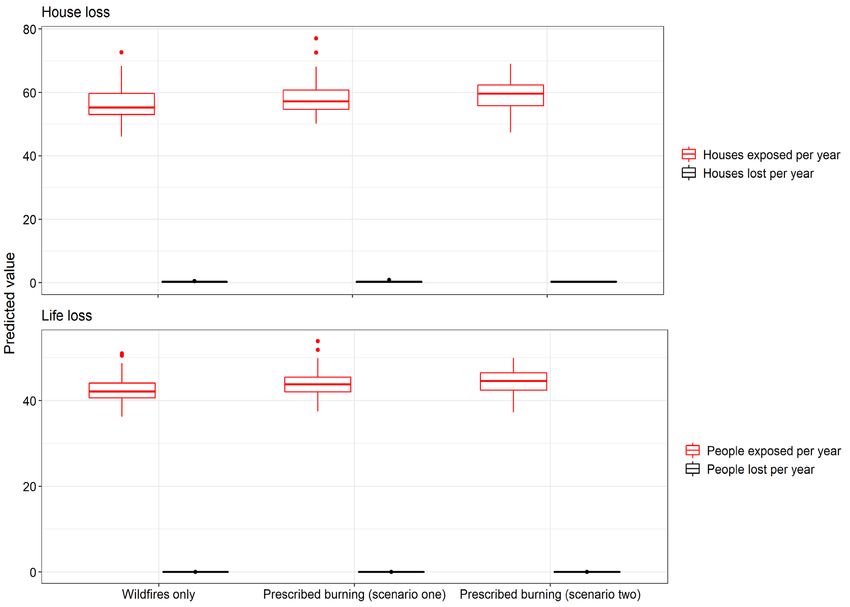
RISK MODELLING FOR KANGAROO ISLAND – BLACK SUMMER FIRES SOUTH AUSTRALIA | REPORT NO. 684.2021

incorporates active suppression efforts alongside various fuel management
strategies (Penman et al., 2013). PHOENIX is commonly used by fire management
agencies in south and eastern Australia (Penman, Ababei, et al., 2015). While this
tool is very useful for modelling single fire events, it does not model fire regimes
over multiple years under changing fuel and weather.
In our study, we use a recently developed fire regime simulator “Fire Regime and
Operations Simulation Tool” (FROST) which incorporates the PHOENIX fire
behaviour models with Bayesian Networks to predict changes in the fire regime
given ignition likelihoods, fuel accumulation and management efforts (Penman,
Ababei, et al., 2015). We simulate changing fire regimes over 50 years on
Kangaroo Island, South Australia (SA), under a wildfire only scenario and two fuel
management strategies (low and high prescribed burning) and analyse the risks
to human life, property and biodiversity. This project is a first attempt to apply
FROST simulations in SA and will serve as a foundation for future projects. Results
of this study will provide insights to fire managers about possibilities of using FROST
to predict risk across SA and to make informed decisions about future fuel
management actions.

                                                               7
RISK MODELLING FOR KANGAROO ISLAND – BLACK SUMMER FIRES SOUTH AUSTRALIA | REPORT NO. 684.2021

METHODS

STUDY AREA
This project focuses primarily on Kangaroo Island but collates data from across
the state and creates the opportunity for future simulations. Kangaroo Island is
an ~4400 km2 island located 112 km southwest of Adelaide (Figure 1) with a
population of around 4259 people (www.abs.gov.au, accessed 10th May 2021).
The Island is a biodiversity hotspot and approximately 65 percent of it is protected
under public and private agreements, with half the remnant native vegetation
intact (https://www.australianwildlife.org, accessed 10th May 2021). However,
during the Black Summer bushfires, ~211,000 hectares of the 440,500-hectare
island (approximately half) burnt in high severity fires resulting in devastating
impacts for biodiversity and people (Filkov et al., 2020).

FIGURE 1: LOCATION OF KANGAROO ISLAND (OUTLINED IN RED) RELATIVE TO AUSTRALIA (TOP LEFT PANEL) AND THE COAST OF SOUTH AUSTRALIA (TOP
RIGHT PANEL).

MODELLING APPROACH
Here we primarily use FROST, a fire regime model that builds on the strength of
existing fire behaviour models and Bayesian networks, to predict wildfire risk.
FROST uses a series of machines which represent an entity or model used in the
fire regime program, i.e., the ignition machine is the ignition model used to
predict ignition location and frequency. Data inputs for each machine must be
processed in advance. A separate data preparation programme (FROMAGE)
takes the raw machinery data required to run a FROST simulation, validates and

                                                                 8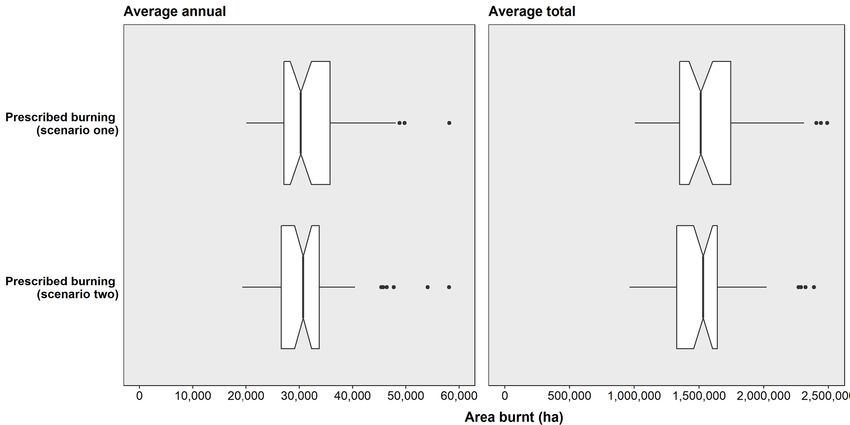
RISK MODELLING FOR KANGAROO ISLAND – BLACK SUMMER FIRES SOUTH AUSTRALIA | REPORT NO. 684.2021

modifies      it  for    use   in    FROST    (accessed  May    31st                            2021,
http://frostfamily.bushfirebehaviour.net.au/fromage-documentation).
The results of each simulation are stored in SQLite databases. These FROST outputs
can be utilised in multiple machines of a post-processing programme called
FRAPPE which calculates impacts on a range of assets, i.e., biodiversity, people
and            property         (accessed            May          31st          2021,
http://frostfamily.bushfirebehaviour.net.au/frappe-documentation/).               The
modelling approach employed in this research consists of three stages using the
three main software applications in the FROST family (accessed May 31st 2021,
http://frostfamily.bushfirebehaviour.net.au/): 1) preparation of data in
FROMAGE to ensure compatibility with FROST, 2) running simulations in FROST and
3) post-processing of FROST outputs in FRAPPE to calculate impacts on people,
property and biodiversity. At the first stage the data required to run FROST is
collected and prepared. The most important aspect of this is ensuring that all the
data is in the correct coordinate reference system and at the required resolution.
The data is then processed in FROMAGE which ensures it is clipped to the extent
of the study site and is compatible for use within FROST. A series of simulations are
then run in parallel within FROST (stage two) and the resulting outcomes in are
processed using FRAPPE (stage three).

Stage one: Data collection and preparation
Since FROST has not yet been tested in SA, this was the first use of the program
within the state using SA data. The essential part of this modelling framework
(FROMAGE + FROST + FRAPPE) is geographical coordinates. These coordinates
use a specific coordinate reference system (CRS), depending on the location of
the study region. Initial development of FROST incorporated EPSG:3111,
GDA94/Vicgrid94, EPSG:3308 and GDA94/NSW Lambert coordinates as baseline
CRSs. A crucial activity in this project was to adapt FROST to run simulations in SA,
requiring a new CRS system to be incorporated – EPSG:3107, GDA94/SA Lambert.
Several machines are required to run a FROST simulation, but the main machines
used to drive the simulations run here are the fuel, ignition, planned burn, post-
processing and weather machines. We collected and processed the data
required to run these machines into the correct formats and coordinate
reference system (EPSG:3107). The weather machine used daily weather
conditions (e.g., max forest fire danger index [FFDI]) to determine the number of
ignitions and hourly weather to simulate fire behaviour and spread. We used
NARCLIM weather data which provides high resolution climate change
projections based on four global climate models (MIRIC, ECHAM, CCCMA and
CSIRO Mk3.0). This weather data provides outputs for several variables including
temperature, precipitation, windspeed, humidity etc (accessed 31 May 2021
https://climatechange.environment.nsw.gov.au/Climate-projections-for-
NSW/About-NARCliM). Here we used the CSIRO Mk3.0 2020 to 2039 (near future)
model using the RCP 8.5 emission pathway (NARCLIM CSIRO Mk3.0 R1; Olson,
Evans, Di Luca, & Argüeso, 2016). The ignition machine used Bayesian Networks
to simulate ignition probability based on empirical models built by Clarke et al.
(2019). The number and time of ignitions provided by the DEWNR were used to
place potential ignitions across Kangaroo Island. Ignition probability was then
determined based on distance to roads, rainfall, FFDI and housing density data.

                                                               9
RISK MODELLING FOR KANGAROO ISLAND – BLACK SUMMER FIRES SOUTH AUSTRALIA | REPORT NO. 684.2021
The fuel machine simulated changes in fuel hazard across the landscape for
each fuel strata (surface, near-surface, elevated and bark hazard) based on the
models produced by McColl-Gausden et al, (2020). Th fuel machine uses fuel
hazard scores by strata collected from field assessments undertaken between
1995-2017, primarily from the study area (Victoria), but also included records from
adjacent states. The fuel model uses predictor variables selected from three key
drivers of vegetation distribution: climate and soil (as an indicator of vegetation
productivity; Hagger, Koch, Chatzisarantis, & Orbell, 2017) and fire history
(represented by time-since-last prescribed fire or wildfire; Chapin, Bret-Harte,
Hobbie, & Zhong, 1996; Nano & Clarke, 2008). Soil variables are the most
influential of the predictor variables for determining all fuel hazard ratings, with
some exceptions for bark hazard. Relationships with fuel hazard scores of the
most important climate variable (precipitation in the warmest quarter) vary by
fuel strata as did relationships of time since fire with extreme fuel hazard.
Probability of extreme fuel hazard in all fuel strata initially increases in this model
until approximately 10-20 years. Thereafter, the probability of extreme fuel hazard
plateaus for surface and bark strata but gradually decreases for near-surface
and elevated fuel hazard strata to 100 years
Time since fire data were calculated from the SA fire history data provided by
DEWNR up until the end of the 2021 fire season for SA. These machines provided
the baseline data required to run FROST for each day in the simulation. We also
used the fuel treatment manager to test different management scenarios and
their impacts on fire behaviour and predicted risk. Planned burns were driven by
selection algorithm (described below) inputted by the user and the fuel
treatment machine simulates the burns in PHOENIX. Post-processing was
conducted through a post-processing machine which uses a separate software
(FRAPPE) to conduct calculations of fire impact on biodiversity, people and
property (described below).
Stage two: Simulation fire regimes
We used FROST to simulate fire impacts on Kangaroo Island using current climate
models. FROST uses PHOENIX models to simulate single fire events and the spread
of fire from individual ignition locations (Penman, Ababei, et al., 2015; Tolhurst et
al., 2008). The model uses daily weather data to predict ignition occurrence and
rate. If one or more ignitions are predicting in the ignition model, the fire
behaviour model is initiated with hourly weather. All ignitions are run concurrently
and once the fires are complete for a day or days fuel consumption is calculated
to estimate the remaining fuel at each site. At the end of the season fuels are
grown based on fuel accumulation curves. Fuel treatments are implemented at
the end of each wildfire season and are also run through the fire behaviour
model to determine their impacts on fuel consumption. At the end of both
wildfire and planned burn seasons, annual risk estimates are calculated for
several asset types (Penman, Ababei, et al., 2015). We ran our simulations for 50
years in total beginning in 2020 and ending in 2070. For each scenario we
repeated our simulations 50 times (replicates) to capture environmental
stochasticity on our results. We ran three management scenarios; 1) wildfires only,
2) low prescribed burning efforts (~1%; hereafter scenario one) and high
prescribed burning efforts (~5%; hereafter scenario two).
10RISK MODELLING FOR KANGAROO ISLAND – BLACK SUMMER FIRES SOUTH AUSTRALIA | REPORT NO. 684.2021
Stage three: Calculating fire impacts
Knowing how fires behave and their impacts on the landscape from the FROST
simulations, we can calculate the fire’s impacts on asset values of interest. Post-
processing seeks to calculate these impacts using several post-processors
accessible in the FRAPPE application. Each post-processor is a separate unit
which contains an algorithm(s) to identify the impacts of a fire on a value of
interest. In our study we analysed biodiversity, life and house loss.
The biodiversity post-processor calculates the total area (hectares) affected by
fire before minimum Tolerable Fire Interval (TFI). Any cells which are impacted by
fire, i.e., where intensity and rate of spread is greater than zero are examined
and their time since fire (based on fire history) is calculated. If the time since fire
is lower than the minimum TFI for that vegetation type, it is counted towards the
total area burnt before TFI. This measure provides an estimate of how early age
class vegetation is impacted by wildfire and an approximation of the relative risk
towards biodiversity. The house loss post-processor uses a housing density layer
supplied by the user to calculate the number of houses per cell exposed and lost
to fire and then summing these values for each year. People exposed to fire was
calculated by dividing the total population by the total number of houses on
Kangaroo Island to get an average number of people per house. This value is
then multiplied with the housing density layer and the number of people exposed
is a sum of the values in each cell affected by fire. Estimated lives lost is
determined using method of (Harris, Anderson, Kilinc, & Fogarty, 2012) from the
number of people exposed.
Management scenarios
We establish three simulation scenarios;
1) wildfires only,
2) wildfire plus low prescribed burning (scenario one) and,
3) wildfires plus high prescribed burning (scenario two).
The prescribed burning machine in FROST uses burn block shapefiles with defined
fuel management zones to assign prescribed burning efforts across the
landscape. Burn block locations and categorisation were provided by DEWNR.
Three fuel management zone (FMZ) types used on Kangaroo Island; asset
protection, landscape management or bushfire moderation and unzoned.
These FMZs do not cover the full extent of Kangaroo Island. Given the overall goal
of the project was to test the effect of burning at a low and high percentage
burn rate, prescribed burning efforts were split up for each scenario to maximise
the chances of reaching these targets within the FMZs (Table 1).
11RISK MODELLING FOR KANGAROO ISLAND – BLACK SUMMER FIRES SOUTH AUSTRALIA | REPORT NO. 684.2021
Scenario 1- Asset 2- Landscape 3- Unzoned
protection management
Wildfire only 0 0 0
Prescribed 20% 10% 1%
burning
(scenario one)
Prescribed 20% 10% 5%
burning
(scenario two)
TABLE 1: PERCENTAGES BURNT PER YEAR IN EACH FUEL MANAGEMENT ZONE ON KANGAROO ISLAND.
We used the minimum TFI algorithm programmed in FROST to assign prescribed
burns within the ecological limitations of Kangaroo Island vegetation. Each
vegetation type is assigned a minimum TFI value. During each planned burn
season, the fire history and vegetation type for each burn block is analysed. Each
burn-block is checked and burnt if it contains at least 80 percent of the area that
is older than the minimum TFI. The algorithm continues to select and burn burn-
blocks until the total target percentage for each FMZ in reached during the
planned burn season.
Data analysis
Following post-processing, the results from FRAPPE and FROST were analysed in R
version 3.6 (R Development Core Team, 2017). We considered three measures
describing the fire regime and fire risk;
1) area burnt by wildfire (total and annual),
2) burn frequency, and
3) frequency of very high and extreme intensity fires.
Area burnt is calculated by taking the total area burnt by each fire simulated,
summing the values for each fire in a year and taking an average across the 50
years and again over 50 replicates. Burn frequency is calculated for each cell in
the landscape burnt with an intensity greater than zero. We summed the burn
frequency for each cell over the 50 years and take an average over 50
replicates. Fires were categorised as very high intensity if they were between 5000
and 10000 kW and extreme intensity fires were any fires above 10000 kW
(Bradshaw et al., 2013). We then follow the same procedure as fire frequency
and count the number of times a cell is burnt. We also present three measures of
risk from the post-processing results;
1) area burnt before minimum TFI,
2) house loss and houses exposed; and
12RISK MODELLING FOR KANGAROO ISLAND – BLACK SUMMER FIRES SOUTH AUSTRALIA | REPORT NO. 684.2021
3) life loss and people exposed.
Area burnt before TFI is calculated using the same method as previously.
However, cells are only counted towards the total area burnt if the vegetation is
below the minimum TFI when it was burnt. House and life loss metrics are
averaged across the 50 replicates. We examined the area burnt for prescribed
burns. However, for the remaining metrics we analysed wildfire seasons only since
we are primarily concerned with how different management options impact
wildfires. We took an average of all these values across the 50 replicates for each
scenario.
RESULTS
FROST results
1) Area burnt
An average annual area of 34,221 and 34,142 hectares were burnt during
prescribed burning in scenario one and scenario two respectively (Figure 2). This
rate of burning constitutes ~7.8 percent of the total landscape burnt annually.
The two prescribed burning scenarios did not significantly differ in the total or
annual area burnt (Figure 2). This is likely due to the similar burn percentages in
each FMZ (Table 1). Had we altered burn percentages more, we may have seen
a greater difference between the two prescribed burning scenarios in the
prescribed burning season. We do find the differences between scenarios are
more pronounced when looking at the wildfire seasons as opposed to the
prescribed burning season.
FIGURE 2: ANNUAL AND TOTAL AREA BURNT BY PRESCRIBED BURNING IN THE TWO PRESCRIBED BURNING SCENARIOS RUN.
Figure three shows a notched boxplot of annual and total area burnt during
wildfire seasons in each scenario. Where the notches on these boxplots do not
overlap there is a statistically significant difference between the mean values
shown. Prescribed burning scenario one resulted in a statistically significant
increase in the total and annual area burnt compared to the wildfire only
13RISK MODELLING FOR KANGAROO ISLAND – BLACK SUMMER FIRES SOUTH AUSTRALIA | REPORT NO. 684.2021
scenario. However, prescribed burning scenario one still overlaps with the
second prescribed burning scenario suggesting the observed differences
between these two results were not statistically significant. Prescribed burning
scenario two also did not significantly differ from the wildfire only scenario (Figure
3). These results could be explained by stochasticity in placement of prescribed
burns between scenarios which is also evident in the significant variation
observed around the mean area burnt for each scenario.
FIGURE 3: AVERAGE ANNUAL AND TOTAL AREA BURNT (HA) FOR THE THREE MANAGEMENT SCENARIOS RUN IN FROST.
2) Fire frequency
Burn frequency did not change significantly between the three management
scenarios (Figure 4). All three scenarios resulted in a minimum burn frequency of
one which demonstrates that each cell was burnt due to wildfire at least once
on average across the 50-year simulation. Wildfire only scenarios do result in a
greater maximum burn frequency of four compared to a maximum burn
frequency of three in the two prescribed burning scenarios. This indicates that
the prescribed burning scenarios can reduce the frequency of burns in some
high-risk areas of the landscape, although this change is minimal. Despite this
change in frequency, we do find that the total area burnt during the wildfire
season is increased even when prescribed burning is used (Figure 3).
14RISK MODELLING FOR KANGAROO ISLAND – BLACK SUMMER FIRES SOUTH AUSTRALIA | REPORT NO. 684.2021
FIGURE 4: AVERAGE FREQUENCY OF WILDFIRES ON KANGAROO ISLAND ACROSS 50 YEARS OF SIMULATIONS IN FROST. RASTERS ARE SCALED BETWEEN
A MINIMUM OF ONE AND A MAXIMUM OF 4. ZERO IS NOT INCLUDED AS ALL CELLS IN THE LANDSCAPE WERE IMPACTED BY WILDFIRES BY THE END OF
THE 50-YEAR SIMULATION AND WHEN AVERAGED ACROSS REPLICATES.
Across all three scenarios, fire frequency was highest in western half of the Island,
particularly in areas with a greater proportion of intact native vegetation such as
in the Flinders Chase National Park. This was also one of the main locations
impacted heavily by the 2020 bushfires. In the southern half of the Flinders Chase
National Park fewer bushfires were predicted than on the rest of the Island. This is
potentially due to the recent fire history we included which incorporates the 2020
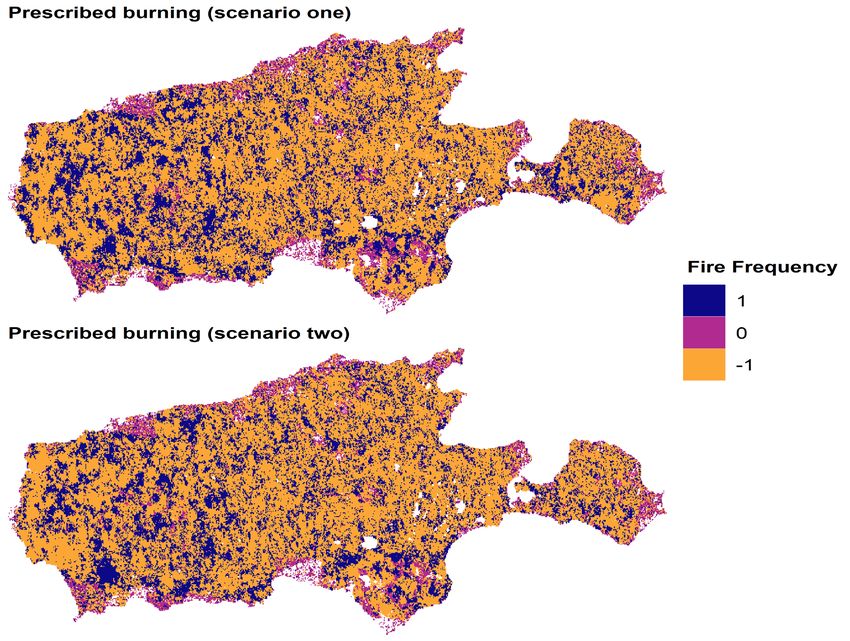
bushfires. Wildfires shifted spatially under prescribed burning scenarios compared
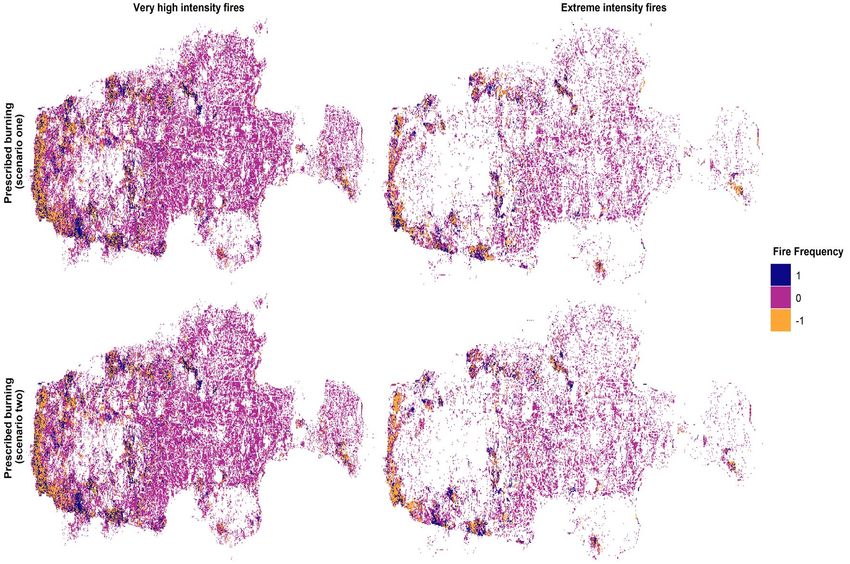
to the wildfire only scenario. Figure five shows locations where wildfires occurring
in prescribed burning scenarios one and two were different to those in the wildfire
only scenario. Zero values indicate frequency was unchanged between wildfire
seasons in each scenario. Values below zero show locations where frequency
was higher in the wildfire only scenario and above zero shows locations where
frequency is higher in the prescribed burning scenarios (Figure 5).
15RISK MODELLING FOR KANGAROO ISLAND – BLACK SUMMER FIRES SOUTH AUSTRALIA | REPORT NO. 684.2021
FIGURE 5: LOCATIONS ON KANGAROO ISLAND WHERE WILDFIRE FREQUENCY DIFFERED BETWEEN THE WILDFIRE ONLY AND THE PRESCRIBED BURNING
BURNING SCENARIOS. POSITIVE VALUES SHOW WHERE THE FREQUENCY OF WILDFIRES WAS HIGHER IN THE PRESCRIBED BURNING SCENARIO COMPARED
TO THE WILDFIRE ONLY SCENARIO. NEGATIVE VALUES SHOW WHERE THE WILDFIRE ONLY SCENARIO HAD A HIGHER FREUQNECY THAN THE PRESCRIBED
BURNING SCENARIO AND ZERO INDICATES NO CHANGE IN THE FREQUENCY OF WILDFIRES.
3) Fire intensity
Frequency of very high and extreme intensity wildfires also did not change
significantly between scenarios (Figure 6). However, extreme intensity fires
impacted a total of 34,751 hectares across all 50 years at least once in the wildfire
only scenario compared to 40,915 and 40,414 hectares in prescribed burning
scenarios one and two. Therefore, while frequency tends to go down in
prescribed burning scenarios, there is a slightly greater extent experiencing very
high or extreme intensity fires at least once. The maximum frequency of very high
intensity fires observed was four for the wildfire only scenario and three in both
prescribed burning scenarios. Again, there was a greater area impacted by very
high intensity wildfires in the two prescribed burning scenarios. On average
across all 50 years and replicates a total of 71,316 hectares experience at least
one very high intensity wildfire in the wildfire only scenario. Prescribed burning
scenarios result in 81,915 and 82,025 hectares for scenarios one and two
respectively.
16RISK MODELLING FOR KANGAROO ISLAND – BLACK SUMMER FIRES SOUTH AUSTRALIA | REPORT NO. 684.2021
FIGURE 6: FREQUENCY OF EXTREME INTENSITY FIRES AVERAGED ACROSS REPLICATES AND YEARS FOR WILDFIRES IN THREE MANAGEMENT SCENARIOS
ON KANGAROO ISLAND.
The increased extent in very high and extreme intensity fires tends to corelate
with areas of the landscape where predicted fire frequency was greater for
prescribed burning scenarios (Figure 5). In the wildfire only scenarios extreme and
very high intensity fires were more frequency around the western coastline
(Figure 7). Comparatively, prescribed burning scenarios tend to result in a higher
frequency of extreme or very high intensity fires further inland in the Flinders
Chase National Park than the wildfire only scenario (Figure 7).
17RISK MODELLING FOR KANGAROO ISLAND – BLACK SUMMER FIRES SOUTH AUSTRALIA | REPORT NO. 684.2021
FIGURE 7: LOCATIONS ON KANGAROO ISLAND WHERE THE FREQUENCY OF VERY HIGH AND EXTREME INTENSITY WILDFIRES DIFFERED BETWEEN THE
WILDFIRE ONLY AND THE PRESCRIBED BURNING BURNING SCENARIOS. POSITIVE VALUES SHOW WHERE FREQUENCY WAS HIGHER IN THE PRESCRIBED
BURNING SCENARIO COMPARED TO THE WILDFIRE ONLY SCENARIO. NEGATIVE VALUES SHOW WHERE THE WILDFIRE ONLY SCENARIO HAD A HIGHER
FREUQNECY THAN THE PRESCRIBED BURNING SCENARIO AND ZERO INDICATES NO CHANGE IN THE FREQUENCY OF WILDFIRES.
FRAPPE results
The total area burnt per year (averaged across replicates) before TFI was
significantly higher in both prescribed burning scenarios than in the wildfire only
scenarios (Figure 8). This is likely because prescribed burning results in an overall
lowering of the age classes. Therefore, when wildfire season is implemented in
FROST, a greater proportion of the vegetation burnt is below the minimum TFI.
18RISK MODELLING FOR KANGAROO ISLAND – BLACK SUMMER FIRES SOUTH AUSTRALIA | REPORT NO. 684.2021
FIGURE 8: AREA BURNT (HECTARES) BEFORE MINIMUM TFI FOR ALL THREE MANAGEMENT SCENARIO.
Conversely, for both people and property, prescribed burning did not
significantly impact the predicted number of these values exposed or lost (Figure
9). Slight changes between scenarios in the number of houses and people
exposed to fire likely reflect the shifting of fire impacts. This is due to spatial
stochasticity or cases where prescribed burning causes changes in the locations
affected by wildfire compared to wildfire only scenarios, exposing more people
and property (Figure 5). However, all three scenarios result in house and life loss
values just above or on zero and they do not change based on the levels of
prescribed burning.
19RISK MODELLING FOR KANGAROO ISLAND – BLACK SUMMER FIRES SOUTH AUSTRALIA | REPORT NO. 684.2021
FIGURE 9: PREDICTED NUMBER OF HOUSES AND PEOPLE EXPOSED AS WELL AS THOSE LOST PER YEAR FOR THREE MANAGEMENT SCENARIOS.
20RISK MODELLING FOR KANGAROO ISLAND – BLACK SUMMER FIRES SOUTH AUSTRALIA | REPORT NO. 684.2021
DISCUSSION
Improving our understanding of bushfire risk is an essential task to inform future
management practices and to protect human life, property and biodiversity
(Ager, Kline, & Fischer, 2015; Banks et al., 2011; Torre & Díaz, 2004). During the
2019/2020 Black Summer fires, the extent of high severity wildfires was larger than
previously recorded and the total area burnt amounted to almost 19 million
hectares across South Eastern Australia (Collins et al., 2021a; Filkov et al., 2020).
House losses in SA were the highest in 20 years and across the continent, impacts
to people, property and biodiversity were unprecedented (Filkov et al., 2020).
Predicting the likelihood and frequency of future megafires and understanding
the risks to biodiversity and people is essential going forward. This study aimed to
predict risks of changing fire regimes on people, property and biodiversity on
Kangaroo Island and identify the impacts of three management scenarios on
these risks. This is the first time FROST has been used to predict changing bushfire
risks in SA and to estimate risks to assets. The results we have presented here
provide the first insight into how fire regimes are likely to shift in terms of extent,
frequency and intensity on Kangaroo Island. From these results we are better
able to understand the benefits and limitations of different management
strategies on fire risk and the likely impacts for people, property and biodiversity.
Fire frequency during wildfire seasons is reduced by prescribed burning efforts,
but this reduction in frequency was not influenced by the level of prescribed
burning used (Figure 4). This is probably because the two prescribed burning
scenarios we tested only differed (in terms of percentage burnt) in the currently
unzoned FMZs which constitutes less than one percent of the ~120,000 hectares
worth of burn blocks. Asset protection and landscape management zones were
both burned at the same percentage between scenarios (Table 1). Increased
burning in these zones in scenario two may generate greater differences in
outcomes between the two prescribed burn scenarios and improve our ability to
prioritise management strategies for Kangaroo Island. Despite the slight decline
in fire frequency in prescribed burning scenarios, we see only a small shift in the
total and annual area burnt between the wildfire only scenario and the first
prescribed burning scenario (Figure 3). However, there was no difference
between the wildfire only and second prescribed burning scenario, or the latter
and prescribed burning scenario one (Figure 3). While a decline in the frequency
of very high and extreme intensity fires was observed, we saw an overall increase
in the area of the landscape which experienced very high or extreme intensity
fires at least once (Figure 6). This suggests that prescribed burning scenarios could
result in a greater total area burnt over the next 50 years and a greater area
burnt by very high and extreme intensity fires.
These results concur with previous research which suggests that prescribed
burning can reduce the frequency and intensity of wildfires but ultimately the
levels of burning required to achieve these outcomes result in a greater area of
the landscape burned overall (King, Cary, Bradstock, & Marsden-Smedley, 2013;
Penman et al., 2011; Price, Pausas, et al., 2015; Price, Penman, Bradstock, Boer,
& Clarke, 2015). Moreover, the effectiveness of prescribed burns is dependent on
the likelihood of a wildfire encountering one or more treated areas (Agee &
Skinner, 2005; Finney et al., 2007; Price, Penman, et al., 2015). This was also
supported in our results as we saw a spatial shift in the impacts of wildfires across
21RISK MODELLING FOR KANGAROO ISLAND – BLACK SUMMER FIRES SOUTH AUSTRALIA | REPORT NO. 684.2021
Kangaroo Island under prescribed burning scenarios (Figure 5). Wildfires in our
prescribed burning scenarios do not burn as frequently in some areas as the
wildfire only scenario, suggesting prescribed burning was effective in these burn
blocks. However, impacts seem to shift elsewhere the landscape, resulting in a
higher fire frequency in areas where the wildfire only scenario did not impact.
Our post-processing results show the impacts of frequent fuel reduction due to
prescribed burning on the area burnt before TFI (Figure 8). When prescribed burns
were applied, a greater proportion of the intact vegetation is below minimum
TFI, resulting in a greater impact on biodiversity during wildfire seasons. Fire
frequency is known to be important in Australian ecosystems (Andersen et al.,
2005; R. A. Bradstock, Bedward, Scott, & Keith, 1996; Penman et al., 2011) and
can drive community composition and diversity (Andersen et al., 2009; Penman,
Binns, Shiels, Allen, & Kavanagh, 2008; Penman & Towerton, 2008). It is however,
unclear how prescribed burning efforts may impact species and populations
long-term because few ecological studies have examined biodiversity response
to the impacts of varying fire regimes and prescribed burning efforts (M. F. Clarke,
2008; Penman et al., 2011). Further research is required to identify management
techniques which result in appropriate fire regimes for maintaining biodiversity (R.
A. Bradstock, Bedward, Kenny, & Scott, 1998; McCarthy, Possingham, & Gill,
2001). These are likely to be different to those used to manage fire frequency and
intensity for the purposes of protecting people and property (Bentley & Penman,
2017; Driscoll et al., 2016; Penman, Ababei, et al., 2015).
Fire management to date has focused primarily on reducing the incidence,
intensity and extent of wildfires as these are the aspects of fire regimes which
present the greatest risk to properties and human lives (Boer, Sadler, Wittkuhn,
McCaw, & Grierson, 2009; Russell-Smith, Mccaw, & Leavesley, 2020). Our
simulations found high predicted exposure of people and houses to wildfire, but
with a resulting lower loss of life and property. These results did not differ between
management scenarios and prescribed burning strategies tested did not appear
to directly impact these assets. Future research should explore a greater variety
of management scenarios (i.e. different levels and strategic placement of
prescribed burning) and examine the impacts of these management scenarios
under a variety of climate scenarios. This would help improve our understanding
of how fuel management influences exposure of people and property to the
direct impacts of wildfires. Future research should also aim to identify how the
exposure of people and property through wildfire impacts these assets long-term,
particularly when considering the less immediate hazards which accompany
wildfires such as smoke.
Wildfires release large amounts of smoke, which can pose a hazard to human
health by impacting air quality. Global average wildfire emissions were
estimated to be 2.2 billion tons per year from 1997 to 2016 (Magidimisha & Griffith,
2017). Many wildfire emissions can have acute or long-term health implications
on the exposed populations (Stone et al., 2019; WHO Regional Office for Europe,
2013).Globally, average annual mortality from wildfire smoke is estimated to be
339,000 deaths, with the worst impacted areas being sub-Saharan Africa and
South east Asia (Johnston et al., 2012. Studies have also found an association
between daily mortality from wildfires for all-causes of death, including
cardiovascular disease (Reid et al., 2016). For instance, Borchers Arriagada et al.,
22RISK MODELLING FOR KANGAROO ISLAND – BLACK SUMMER FIRES SOUTH AUSTRALIA | REPORT NO. 684.2021
(2020) estimated that bushfire smoke during the Black Summer fires was
responsible for 417 excess deaths, 1124 hospitalisations for cardiovascular
problems and 2027 for respiratory problems, and 1305 presentations to
emergency departments with asthma. While not everyone who is exposed to
thick smoke will have health problems, further research on the effects of exposure
to wildfire smoke are warranted. Risks caused by wildfire smoke should be taken
into consideration when estimating potential life loss from future wildfires and
planning management strategies and suppression efforts. For example, due to
higher exposure rates firefighters may be more at risk of long-term health issues
related to smoke inhalation (Engelsman, Toms, Banks, Wang, & Mueller, 2020),
therefore managing firefighters exposure and personal protective equipment
during wildfire season is critical. Population exposure and respiratory health
impacts of wildfire smoke is likely to grow in the future as global wildfire activity
and human population growth both increase.
23RISK MODELLING FOR KANGAROO ISLAND – BLACK SUMMER FIRES SOUTH AUSTRALIA | REPORT NO. 684.2021
FUTURE RESEARCH
One key outcome of this research was the establishment of a protocol for
predicting fire risk in SA. This research has established the foundations required to
expand our study and examine fire risks in different parts of the state. Future
research should capitalise on this capability to expand and explore bushfire risk
under different climate scenarios and alternative management approaches to
those presented here. For example, different levels of prescribed burning, the use
of fuel breaks, or increased suppression efforts would likely change our estimates
of wildfire risk on Kangaroo Island. We were only able to explore one climate
scenario here but to expand on this study, we could explore a series of climate
models and make predictions using far future climate change scenarios (e.g.,
2060 to 2079). Future research should also conduct sensitivity analyses by varying
the number of replicates used and exploring different lengths of simulations. This
would improve the accuracy of our predictions of risk and establish a baseline
against for the ideal simulation protocol in SA going forward.
We have shown here that a greater area of vegetation is burnt before minimum
TFI in the prescribed burning scenarios compared to wildfires only. Prescribed
burning efforts are known to influence richness, composition, diversity and
potentially even persistence (Andersen et al., 2009; Penman et al., 2008; Penman
& Towerton, 2008). However, it is still unclear what the medium to long-term
implications of such actions are to biodiversity beyond immediate changes to
vegetation or community composition. Future research could utilise the results of
FROST simulations and population studies for key species to examine the impacts
of wildfires on medium and long-term viability (Penman, Keith, et al., 2015; Swab
et al., 2012). There are several approaches which can be used to model changes
in persistence through time including Bayesian Networks and population viability
analyses (Akçakaya & Root, 2005; Visintin et al., 2020). Providing estimates of
abundance and long-term population persistence for keystone species under
current and future fire regimes may provide insight for managers on how
biodiversity holistically is impacted by shifting fire risks. Such analyses would inform
both fire management practices and could help us better understand the
effectiveness of conservation efforts under the pressure of changing fire regimes.
Lastly, current methods of estimating risks to people and property consider only
the direct impacts of fire and fail to account for the less immediate hazards
caused by wildfires. These include the health hazard risks which may increase life
loss (through smoke inhalation or long-term health impacts), as well as the risks to
people’s livelihood (loss of income through tourism or agriculture, etc). Future
research should examine what the long-term health implications in increase fire
frequency are as well as the economic risks associated with changing fire
regimes. This may give us a more accurate representation of the actual impacts
of wildfires on people and help to direct management efforts to minimise the
most at-risk communities.
24RISK MODELLING FOR KANGAROO ISLAND – BLACK SUMMER FIRES SOUTH AUSTRALIA | REPORT NO. 684.2021
CONCLUSIONS
Our simulations explore only a small set of the management strategies and
climate scenarios available. While we do observe a decline in the frequency of
wildfires in prescribed burning scenarios, these scenarios result in a greater area
burnt by very high and extreme intensity fires at least once across the 50-year
simulations. We also found that prescribed burning results in more area burnt
before minimum TFI during wildfires and therefore prescribed burning is likely to
have an impact on biodiversity on Kangaroo Island. However, we see no
difference in the number of houses or people exposed to wildfire between
scenarios. This research has highlighted that ideal fuel management practices
on Kangaroo Island should be carefully considered and strategically planned to
manage risks to different asset values. It has also demonstrated how FROST can
be used to predict bushfire risks in SA and explore different management options.
25RISK MODELLING FOR KANGAROO ISLAND – BLACK SUMMER FIRES SOUTH AUSTRALIA | REPORT NO. 684.2021
REFERENCES
1 Agee, J. K., & Skinner, C. N. (2005). Basic principles of forest fuel reduction treatments. Forest Ecology and
Management, 211(1–2), 83–96. doi: 10.1016/j.foreco.2005.01.034
2 Ager, A. A., Kline, J. D., & Fischer, A. P. (2015). Coupling the Biophysical and Social Dimensions of Wildfire
Risk to Improve Wildfire Mitigation Planning. 35(8). doi: 10.1111/risa.12373
3 Akçakaya, H. R., & Root, W. (2005). RAMAS GIS: Linking Spatial Data with Population Viability Analysis (version
5). Setauket, New York: Applied Biomathematics.
4 Andersen, A. N., Cook, G. D., Corbett, L. K., Douglas, M. M., Eager, R. W., Russell-Smith, J., … Woinarski, J. C.
Z. (2005). Fire frequency and biodiversity conservation in Australian tropical savannas: Implications from the
Kapalga fire experiment. Austral Ecology, 30(2), 155–167. doi: 10.1111/j.1442-9993.2005.01441.x
5 Andersen, A. N., Penman, T. D., Debas, N., & Houadria, M. (2009). Ant community responses to experimental
fire and logging in a eucalypt forest of south-eastern Australia. Forest Ecology and Management, 258(2),
188–197. doi: 10.1016/j.foreco.2009.04.004
6 Archibald, S., Lehmann, C. E. R., Belcher, C. M., Bond, W. J., Bradstock, R. A., Daniau, A. L., … Zanne, A. E.
(2018). Biological and geophysical feedbacks with fire in the Earth system. Environmental Research Letters,
13(3). doi: 10.1088/1748-9326/aa9ead
7 Banks, S. C., Knight, E. J., McBurney, L., Blair, D., & Lindenmayer, D. B. (2011). The effects of wildfire on
mortality and resources for an arboreal marsupial: Resilience to fire events but susceptibility to fire regime
change. PLoS ONE, 6(8). doi: 10.1371/journal.pone.0022952
8 Bentley, P. D., & Penman, T. D. (2017). Is there an inherent conflict in managing fire for people and
conservation ? Is there an inherent conflict in managing fire for people and conservation ? (January). doi:
10.1071/WF16150
9 Boer, M. M., Sadler, R. J., Wittkuhn, R. S., McCaw, L., & Grierson, P. F. (2009). Long-term impacts of prescribed
burning on regional extent and incidence of wildfires-Evidence from 50 years of active fire management in
SW Australian forests. Forest Ecology and Management, 259(1), 132–142. doi: 10.1016/j.foreco.2009.10.005
10 Borchers Arriagada, N., Palmer, A. J., Bowman, D. M. J. S., Morgan, G. G., Jalaludin, B. B., & Johnston, F. H.
(2020). Unprecedented smoke-related health burden associated with the 2019–20 bushfires in eastern
Australia. Medical Journal of Australia, 213(6), 282–283. doi: 10.5694/mja2.50545
11 Bradshaw, C. J. A., Bowman, D. M. J. S., Bond, N. R., Murphy, B. P., Moore, A. D., Fordham, D. A., … Specht,
A. (2013). Brave new green world - Consequences of a carbon economy for the conservation of Australian
biodiversity. Biological Conservation, 161, 71–90. doi: 10.1016/j.biocon.2013.02.012
12 Bradstock, R. A. (2010). A biogeographic model of fire regimes in Australia: Current and future implications.
Global Ecology and Biogeography, 19(2), 145–158. doi: 10.1111/j.1466-8238.2009.00512.x
13 Bradstock, R. A., Bedward, M., Kenny, B. J., & Scott, J. (1998). Spatially-explicit simulation of the effect of
prescribed burning on fire regimes and plant extinctions in shrublands typical of south-eastern Australia.
Biological Conservation, 86(1), 83–95. doi: 10.1016/S0006-3207(97)00170-5
14 Bradstock, R. A., Bedward, M., Scott, J., & Keith, D. A. (1996). Simulation of the Effect of Spatial and Temporal
Variation in Fire Regimes on the Population Viability of a Banksia Species. Conservation Biology, 10(3), 776–
784. doi: 10.1046/j.1523-1739.1996.10030776.x
15 Bradstock, R. A., Cary, G. J., Davies, I., Lindenmayer, D. B., Price, O. F., & Williams, R. J. (2012). Wildfires, fuel
treatment and risk mitigation in Australian eucalypt forests: Insights from landscape-scale simulation. Journal
of Environmental Management, 105, 66–75. doi: 10.1016/j.jenvman.2012.03.050
16 Bradstock, R., Penman, T. D., Boer, M., Price, O., & Clarke, H. (2014). Divergent responses of fire to recent
warming and drying across south-eastern Australia. Global Change Biology, 20(5), 1412–1428. doi:
10.1111/gcb.12449
17 Bushfire School. (2019). Fromage raw machines data specification. Retrieved May 31, 2021, from
http://frostfamily.bushfirebehaviour.net.au/fromage-documentation/fromage-raw-machine-data-
specification/
18 Bushfire School. (2020a). Fire simulation and the post-processing step. Retrieved May 31, 2021, from
http://frostfamily.bushfirebehaviour.net.au/frappe-documentation/
19 Bushfire School. (2020b). Welcome to the FROST family. Retrieved May 31, 2021, from
http://frostfamily.bushfirebehaviour.net.au/
20 Chapin, F. S., Bret-Harte, M. S., Hobbie, E. S., & Zhong, H. (1996). Plant functional types as predictors of
transient responses of arctic vegetation to global change. Journal of Vegetation Science, (7), 347–358.
21 Clarke, H., Gibson, R., Cirulis, B., Bradstock, R. A., & Penman, T. D. (2019). Developing and testing models of
the drivers of anthropogenic and lightning-caused wildfire ignitions in south-eastern Australia. Journal of
Environmental Management, 235(June 2018), 34–41. doi: 10.1016/j.jenvman.2019.01.055
22 Clarke, H., Tran, B., Boer, M. M., Price, O., Kenny, B., & Bradstock, R. (2019). Climate change e ff ects on the
frequency , seasonality and interannual variability of suitable prescribed burning weather conditions in
south- eastern Australia. Agricultural and Forest Meteorology, 271(December 2018), 148–157. doi:
10.1016/j.agrformet.2019.03.005
23 Clarke, M. F. (2008). Catering for the needs of fauna in fire management: science or just wishful thinking?
Michael F. Clarke. Wildlife Research, 35, 385-394.
24 Collins, L., Bradstock, R. A., Clarke, H., Clarke, M. F., Nolan, R. H., & Penman, T. D. (2021a). The 2019/2020
mega-fires exposed Australian ecosystems to an unprecedented extent of high-severity fire. Environmental
Research Letters, 16(4). doi: 10.1088/1748-9326/abeb9e
25 Collins, L., Bradstock, R. A., Clarke, H., Clarke, M., Nolan, R. H., & Penman, T. D. (2021b). The 2019/2020 mega-
fires exposed Australian ecosystems to an unprecedented extent of high-severity fire. Environmental
26RISK MODELLING FOR KANGAROO ISLAND – BLACK SUMMER FIRES SOUTH AUSTRALIA | REPORT NO. 684.2021
Research Letters, (December 2016), 11–14.
26 Driscoll, D. A., Bode, M., Bradstock, R. A., Keith, D. A., Penman, T. D., & Price, O. F. (2016). Resolving future
fire management conflicts using multicriteria decision making. Conservation Biology, 30(1), 196–205. doi:
10.1111/cobi.12580
27 Engelsman, M., Toms, L. M. L., Banks, A. P. W., Wang, X., & Mueller, J. F. (2020). Biomonitoring in firefighters
for volatile organic compounds, semivolatile organic compounds, persistent organic pollutants, and metals:
A systematic review. Environmental Research, 188(April), 109562. doi: 10.1016/j.envres.2020.109562
28 Enright, N. J., Fontaine, J. B., Lamont, B. B., Miller, B. P., & Westcott, V. C. (2014). Resistance and resilience to
changing climate and fi re regime depend on plant functional traits. 1572–1581. doi: 10.1111/1365-
2745.12306
29 Filkov, A. I., Ngo, T., Matthews, S., Telfer, S., & Penman, T. D. (2020). Impact of Australia’s catastrophic 2019/20
bushfire season on communities and environment. Retrospective analysis and current trends. Journal of
Safety Science and Resilience, 1(1), 44–56. doi: 10.1016/j.jnlssr.2020.06.009
30 Finney, M. A., Seli, R. C., McHugh, C. W., Ager, A. A., Bahro, B., & Agee, J. K. (2007). Simulation of long-term
landscape-level fuel treatment effects on large wildfires. International Journal of Wildland Fire, 16(6), 712–
727.
31 Florec, V., Burton, M., Pannell, D., Kelso, J., & Milne, G. (2020). Where to prescribe burn : the costs and benefits
of prescribed burning close to houses. International Journal Of Wildland Fire, 29, 440–458.
32 Gill, A. M. (1975). Fire and The Australian Flora : A Review A Review. Australian Forestry, 9158(1975). doi:
10.1080/00049158.1975.10675618
33 Hagger, M. S., Koch, S., Chatzisarantis, N. L. D., & Orbell, S. (2017). The common sense model of self-
regulation: Meta-analysis and test of a process model. Psychological Bulletin, Vol. 143, pp. 1117–1154.
Hagger, Martin S.: Health Psychology and Behavioral Medicine Research Group and Laboratory of Self-
Regulation, School of Psychology and Speech Pathology, Faculty of Health Sciences, Curtin University, GPO
Box U1987, Perth, WAU, Australia, 6845, martin.hagger@curtin.edu.au: American Psychological Association.
doi: 10.1037/bul0000118
34 Harris, S., Anderson, W., Kilinc, M., & Fogarty, L. (2012). The relationship between fire behaviour measures
and community loss: An exploratory analysis for developing a bushfire severity scale. Natural Hazards, 63(2),
391–415. doi: 10.1007/s11069-012-0156-y
35 Higuera, P. E., & Abatzoglou, J. T. (2021). Record-setting climate enabled the extraordinary 2020 fire season
in the western United States. Global Change Biology, (October 2020), 1–2. doi: 10.1111/gcb.15388
36 King, K. J., Cary, G. J., Bradstock, R. A., & Marsden-Smedley, J. B. (2013). Contrasting fire responses to climate
and management : insights from two Australian ecosystems. Global Change Biology, 19, 1223–1235. doi:
10.1111/gcb.12115
37 Magidimisha, E., & Griffith, D. J. (2017). Remote optical observations of actively burning biomass fires using
potassium line spectral emission: SPIE.
38 McCarthy, M. A., Possingham, H. P., & Gill, A. M. (2001). Using stochastic dynamic programming to
determine optimal fire management for Banksia ornata. Journal of Applied Ecology, 38(3), 585–592. doi:
10.1046/j.1365-2664.2001.00617.x
39 McColl-Gausden, S. C., Bennett, L. T., Duff, T. J., Cawson, J. G., & Penman, T. D. (2020). Climatic and edaphic
gradients predict variation in wildland fuel hazard in south-eastern Australia. Ecography, 43(3), 443–455. doi:
10.1111/ecog.04714
40 Murphy, B. P., Bradstock, R. A., Boer, M. M., Carter, J., Cary, G. J., Cochrane, M. A., … Bowman, D. M. J. S.
(2013). Fire regimes of Australia: A pyrogeographic model system. Journal of Biogeography, 40(6), 1048–
1058. doi: 10.1111/jbi.12065
41 Nano, C. E. M., & Clarke, P. J. (2008). Variegated desert vegetation : Covariation of edaphic and fire
variables provides a framework for understanding mulga-spinifex coexistence. 848–862. doi: 10.1111/j.1442-
9993.2008.01855.x
42 Olson, R., Evans, J. P., Di Luca, A., & Argüeso, D. (2016). The NARCliM project: Model agreement and
significance of climate projections. Climate Research, 69(3), 209–227. doi: 10.3354/cr01403
43 Penman, T. D., Ababei, D., Chong, D. M. O., Duff, T. J., & Tolhurst, K. G. (2015). A fire regime risk management
tool. Proceedings - 21st International Congress on Modelling and Simulation, MODSIM 2015, 270–276.
44 Penman, T. D., Binns, D. L., Shiels, R. J., Allen, R. M., & Kavanagh, R. P. (2008). Changes in understorey plant
species richness following logging and prescribed burning in shrubby dry sclerophyll forests of south-eastern
Australia. Austral Ecology, 33(2), 197–210. doi: 10.1111/j.1442-9993.2007.01809.x
45 Penman, T. D., Bradstock, R. A., & Price, O. F. (2014). Reducing wildfire risk to urban developments: Simulation
of cost-effective fuel treatment solutions in south eastern Australia. Environmental Modelling and Software,
52, 166–175. doi: 10.1016/j.envsoft.2013.09.030
46 Penman, T. D., Christie, F. J., Andersen, A. N., Bradstock, R. A., Cary, G. J., Henderson, M. K., … York, A. (2011).
Prescribed burning: how can it work to conserve the things we value? International Journal of Wildland Fire,
20, 721–733.
47 Penman, T. D., Collins, L., Price, O. F., Bradstock, R. A., Metcalf, S., & Chong, D. M. O. (2013). Examining the
relative effects of fire weather, suppression and fuel treatment on fire behaviour - A simulation study. Journal
of Environmental Management, 131, 325–333. doi: 10.1016/j.jenvman.2013.10.007
48 Penman, T. D., Keith, D. A., Elith, J., Mahony, M. J., Tingley, R., Baumgartner, J. B., & Regan, T. J. (2015).
Interactive effects of climate change and fire on metapopulation viability of a forest-dependent frog in
south-eastern Australia. Biological Conservation, 190, 142–153. doi: 10.1016/j.biocon.2015.05.020
49 Penman, T. D., & Towerton, A. L. (2008). Soil temperatures during autumn prescribed burning: Implications
for the germination of fire responsive species? International Journal of Wildland Fire, 17(5), 572–578. doi:
10.1071/WF07092
27You can also read